____________
Amino acid sequence correlation in optimally designed proteins
Author: Joan Àguila RojasAdvisor: Giancarlo Franzese
Facultat de Física, Universitat de Barcelona, Diagonal 645, 08028 Barcelona, Spain.
Abstract: Water plays a fundamental role in protein’s stability. Polymers with a segregation of hydrophilic amino
acids in their surface have shown to have a larger stability region over changes in Pressure and Temperature in an aqueous solvent. This work expands the two-dimensional computational study made by Bianco, Franzese, Dellago and Coluzza to three dimensions, obtaining results consistent with their findings.
I. INTRODUCTION
Proteins are complex molecules consisting in chains of smaller units called amino acids. These amino acids will be a sequence of the 20 hydrophilic (PHI) and hydrophobic (PHO) possible monomers. Molecules with these sets (polymers) are only functional within a certain range of pressures P and temperatures T, in which we say that the protein is in its native state [1]. The protein state is presented in the geometrical figure that its configuration shows or, in other words, the ratio between its residues’ contacts and the amount of contacts they could have. When the polymer is in a folded configuration (i.e., with only a few of its monomers exposed to the surrounding water) thus ensembled in a compact conformation, both its entropy and intramolecular enthalpy are low, and the protein is stable and active. If exposed to changes in temperature or pressure, the molecule will maintain its form in a specific range, called Stability Region, until the energetic cost of doing so forces it to unfold onto a denatured state.
Protein design is the process of selecting the polymer’s configuration by choosing a set of amino-acids that will ensure the protein’s stability in the desired range of water pressure and temperature, as the stability of a folded protein depends on interfacial water and residue-residue interactions [2]. A computational simulation is used to study the system thermodynamic variables while changing the monomers that conform the protein to achieve a stable configuration.
II. ROLE OF WATER IN THE SELECTION
OF STABLE PROTEINS A. Interactions
The interactions of the system we are studying are described by the Hamiltonian
ℋ = ℋ𝑅,𝑅+ ℋ𝑅,𝑤+ ℋ𝑤,𝑤(ℎ) + ℋ𝑤,𝑤(𝑏) (1)
where the first term accounts for residue-residue interactions, the second for residue-water interactions in the hydration layer, the third details those between water molecules in that layer and the fourth accounts for bulk water interactions (those water molecules not in immediate contact with the protein).
These interactions will be mediated by the pressure and temperature of the system, resulting in certain activation p,T ranges in which the protein will be allowed to maintain its stable configuration, i.e. its native state.
The causes of those interactions comprise the following sources [3]:
1. The covalent (peptide) bonds between the amino terminal and the carboxyl terminal of each pair of monomers of the chain, which keep it from breaking off and limit its changes in configuration to the folding or unfolding of itself.
2. Van der Walls interactions between the amino acids, which can overcome the conformational entropy.
3. The intramolecular hydrogen bonding of water and residues at the hydration layer influencing the adoption of secondary structures like alpha helices or beta sheets which expose the most hydrophilic residues to water.
4. The hydrogen bonding and Van der Walls’ interactions between water molecules of the bulk that will affect the residue-solvent and solvent-solvent H-bonds in the hydration layer.
B. Denaturation
The unfolding of the protein occurs in various domains [4]: i) High T: Thermal fluctuations dominate other interactions and force the protein to disclose.
ii) Low T: Although it’s been observed, a clear explanation is yet to be found.
iii) High P: Possibly caused by the loss of internal cavities. It’s been observed at 100MPa ≤ P ≤ 600Mpa.
iv)Low P: Denaturation has been observed and simulated, showing how low-pressure favours H-bonding and crystallization.
C. Hawley’s theory
In 1971, Hawley proposed a theory based on the assumption that the folding (f) unfolding (u) transition is a first order phase transition and that equilibrium thermodynamics hold during the denaturation, so it’s reversible at any moment [5]. This model is based on a Taylor expansion of the difference in Gibbs’ free energy between the folded and the unfolded state truncated at second order:
∆𝐺(𝑃, 𝑇) = ∆𝛽 2 (𝑃 − 𝑃0)2+ 2∆𝛼(𝑃 − 𝑃0)(𝑇 − 𝑇0) + −∆𝐶𝑝 2𝑇0(𝑇 − 𝑇0) 2+ ∆𝑉 0(𝑃 − 𝑃0) − ∆𝑆0(𝑇 − 𝑇0) + ∆𝐺0 (2)
where 𝑇0 and 𝑃0 are the temperature and pressure of the
ambient conditions, ∆𝑉0 and ∆𝑆0 are the volume and entropy
variation. 𝛼 is the thermal expansivity factor, 𝐶𝑃 is the isobaric
heat capacity and β is the isothermal compressibility factor. This equation is constrained by ∆𝛼 > ∆𝐶𝑝∆𝛽/𝑇0 resulting
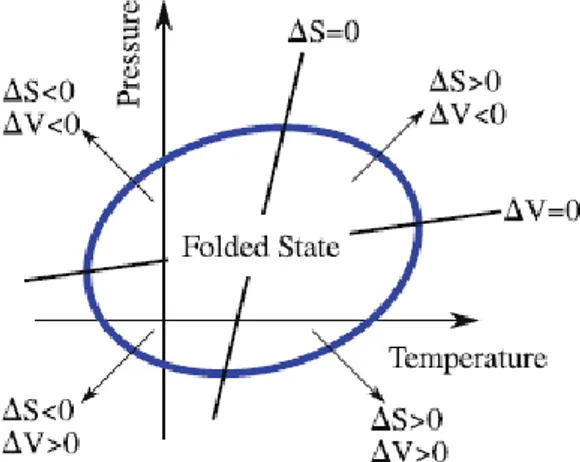
in the Stability Region (SR) having an elliptic shape, as shown in figure 1.
Even if it’s a phenomenological model, its ability to predict the processes observed in experiments makes it a useful tool when studying these types of systems.
FIG. 1: Stability Region of a protein according to the Hawley theory
in a P-T representation. The elliptic line separates the native from the denatured state. This transition can be done varying either the Volume or the Entropy or both, illustrated by the straight lines and arrows.
III. DESIGN APPROACH
Until the work of Bianco, Franzese, Dellago and Coluzza, in which they developed a strategy for protein design focusing on the relation between sequence and folded structure, we lacked a direct observation of how the protein selection responds to extreme changes in its enclosing conditions [6].
They simulated a coarse-grain model based on a two-dimensional lattice representation of the system that consists of N non-overlapping cells with volume v≡ V/N ≥ v0 (v0 being the water excluded volume and V the system’s volume) that accommodate one molecule at most. It is a many-body system in which the bulk water interactions are treated in relation to the hydration layer and the thermodynamic properties of the system, so the individual motion of each molecule is considered implicitly, (opposed to atomistic models, that are unfeasible to be run by current computers due to the large number of molecules involved).
A. System’s Potts-model Hamiltonian
In this approach, the terms in the Hamiltonian of the system (1) can be expressed in the following manner:
i) ℋ𝑤,𝑤(𝑏) = ∑ 𝑈(𝑟𝑖𝑗 𝑖𝑗) − 𝐽𝑁𝐻𝐵(𝑏)− 𝐽𝜎𝑁𝑐𝑜𝑜𝑝 (3) Where the first term:
∑ 𝑈(𝑟𝑖𝑗) = 4𝜖 ∑ [(𝑟𝑟0 𝑖𝑗) 12 − (𝑟0 𝑟𝑖𝑗) 6 ] 𝑖𝑗 𝑖𝑗
is the Lennard-Jones potential energy (isotropic term), being 𝜖 = 5.8𝑘𝐽/𝑚𝑜𝑙 the depth of the potential well, 𝑟0=
2.9𝐴 the distance from the molecule to the well (molecule’s hard core) and 𝑟𝑖𝑗 the O-O distance. A cut-off was established
at r=6𝑟0 to accelerate the calculations.
The second term accounts for covalent interaction, with J=1.2𝜖 being the energetic cost of each HB and 𝑁𝐻𝐵(𝑏)= ∑〈𝑖𝑗〉𝑛𝑖𝑛𝑗𝛿𝜎𝑖𝑗𝜎𝑗𝑖 (3.1)
the number of hydrogen bonds in the bulk. The sum in 3.1 runs over neighbouring cells and its Kronecker’s δ adds an HB if molecules i and j have the same bonding index 𝜎𝑖𝑗 = 1, . . , 𝑞
in respect to each other. q was decided to be 6 because each HB is stable only in a range of [-30º,30º] with respect to the O-O axes, and 360º/60º = 6. Each water molecule can form up to 4 HBs. This constraint had no implication in a 2D lattice (each molecule has 4 nearest neighbours and further ones are not taken into account) but became relevant in my work of expanding the system to 3 dimensions, as we will see in section IV.
The third term takes into account the quantum many-body interaction caused when a new HB is formed affecting the electron-distribution around the molecule, thus favouring the formation of new HBs. 𝑁𝑐𝑜𝑜𝑝= ∑ 𝑛𝑖 𝑖∑(𝑙,𝑘)𝑖𝛿𝜎𝑖𝑘𝜎𝑖𝑙 mimics the
cooperativity of the HBs between the possible pairs of the 𝜎𝑖𝑗
indices of the molecule. 𝐽𝜎= 0.2𝜖 was chosen to ensure that
the covalent term would dominate, as we want HBs to be formed and leave the cooperative term as a secondary effect.
ii) The protein’s Hamiltonian is modelled as ℋ𝑝= ℋ𝑅,𝑅+ ℋ𝑅,𝑤= ∑ [∑𝑖𝑁𝑐 𝑁𝑖≠𝑗𝑐 𝐶𝑖𝑗𝑆𝑖𝑗+ ∑𝑁𝑗′𝑤𝐶𝑖𝑗′𝑆𝑖𝑊] (4)
where C is a contact matrix with 𝐶𝑚𝑛= 1 if m and n are first
neighbours and 0 otherwise. S is the Miyazawa-Jernigan matrix [7] where 𝑆𝑖𝑗 accounts for the interaction between
amino acids and 𝑆𝑖𝑊 equals 𝜀𝑃𝐻𝐼 or 𝜀𝑃𝐻𝑂 depending on
i-residue’s hydropathy.
iii) When modelling the hydration layer Hamiltonian 𝐻𝑤,𝑤(ℎ),
Bianco et al. considered the numerical and experimental observations that point to a higher correlation in the h-bonding between hydrophobic residues and water particles [8], hence using (3) and replacing J by JФ=1.83J for water-water molecules in that layer.
B. Enthalpy of the hydrated protein
Calculating the enthalpy associated to the protein was an important aspect in the design of a stable protein, as we will discuss later. It is designated as:
𝐻𝑅(ℎ)= ℋ𝑅,𝑅+ ℋ𝑅,𝑤+ ℋ𝑤,𝑤(ℎ) + 𝑃(𝑉 − 𝑉(𝑏)) (5)
where V is the system’s volume and 𝑉(𝑏) the volume of the
bulk. The reason to divide the volume into these two contributions is to take into consideration an effect that has been observed in water hydrating hydrophobic solutes, of which hydration shell’s particles display a far greater compressibility than those in the bulk. Hydrogen bonds contribute to the volume of the system, as a heavily bonded system will resemble its solid state. We assume the average volume of HB’s in the hydration layer (denoted by Ф) to be:
𝑣𝐻𝐵(Ф)≡ 𝑣𝐻𝐵,0(Ф)(1 − 𝑘1𝑃) , where 𝑘1= 𝑣0/4𝜖 is a positive
constant and 𝑣𝐻𝐵,0(Ф) is the hydration shell HB’s volume at P=0.
The total volume will then be:
𝑉 ≡ 𝑁𝑣0+ 𝑁𝐻𝐵(𝑏)𝑣𝐻𝐵(𝑏)+ 𝑁𝐻𝐵(Ф)𝑣𝐻𝐵(Ф), with 𝑁𝐻𝐵(Ф) being the
number of H-bonds in that layer and 𝑣𝐻𝐵,0(Ф) and 𝑣𝐻𝐵(𝑏) are fixed
at 0.5𝑣0. The volume of the amino acids is supposed to be
constant.
C. Design protocols
Bianco, Franzese, Dellago and Coluzza developed two protocols in order to design a stable protein, both based in the average enthalpy associated to the hydrated protein. MIN ENTHALPY consisted in minimizing the average enthalpy in the folded state of the protein while MAX GAP tried to maximize the enthalpy gap between the folded and unfolded
conformations. My work is based on the first protocol, where the folded protein is placed at the lattice and the program starts sampling the space of sequences starting from an initial random sequence. In each step of the program, an amino-acid of the polymer is replaced either by simply exchanging it with another of the 20 possible monomers or by swapping the position of two already existing amino acids (in a relation 100 to 1). Once it has done that, the program:
i) Checks that the move has not led to a more homogeneous sequence (otherwise we would easily end up with a strongly homogeneous one that would not be capable of folding).
ii) Detects whether it will decrease or increase the protein’s enthalpy.
If both conditions are met, we accept the protein move and perform a series of Monte-Carlo steps to equilibrate the water using both cluster algorithms and single variable moves. Once the water is equilibrated, we compute the protein’s average enthalpy and ensure it has decreased in respect to the previous one, which makes it a better candidate for the protein to fold at the given pressure and temperature.
D. Results of the 2D simulations
The data obtained in their work demonstrated that the proteins artificially developed by following the protocols mentioned above, had similar stability regions to natural proteins. Bianco et al. study showed segregation in the protein hydrated layer (and in the protein’s core) to be correlated to the P-T conditions of the design. Once the optimization was made, the designed protein was put on another simulation to study its stability (i.e. the domain of the folded and unfolded conformations) over changes in Temperature and Pressure, and observed how polymers designed in different P-T conditions had different SR.
Thermal and pressure stability of proteins
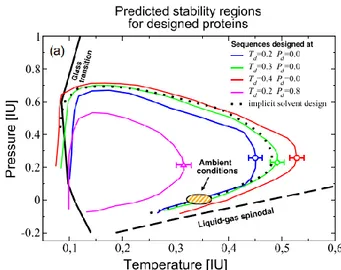
Proteins were designed over a series of thermodynamic conditions varying from water’s liquid-glass phase transition range to the liquid-gas one. When the Stability Region was computed, it was found to resemble previous theoretical, simulated and experimental results [9], as one can see in figure 2.
Moreover, it was seen that proteins designed at high T and intermediate P had the widest stability regions, maintaining its folded state through an extended range of temperatures and pressures, although no protein could fold over ≈0.7 GPa. Sequences designed at low P-T conditions, on the other hand, were the less stable.
The size of the polymer also factored in its SR. Small proteins had more hydrophilic residues on their surface and resisted cold-denaturation (unfolding by cooling the system) at much lower values than larger ones.
Water effect on the protein surface and core hydropathy profiles
As mentioned in the previous section, the study found proteins designed at low T to be less segregated than thermophilic sequences. Those optimized at high temperatures had a higher ratio of hydrophilic monomers in their surface as well as more hydrophobic ones in their core, resulting in a
wider Stability Range. Table II and figure 6 show their results along with those observed in the 3-dimentional study.
FIG. 2: T-P stability region for proteins designed with the MIN
ENTHALPY protocol. Region enclosed by the dotted line shows the SR of a polymer designed using implicit bulk water. The continuous black line marks the liquid-glass transition wall and the discontinuous one traces liquid-gas phase transition. The simulations are in concordance with the results predicted by Hawley’s theory.
While both protocols showed similar segregation at intermediate (mesophilic proteins) and high (thermophilic proteins) temperatures for the design, at low temperature (ice-binding proteins) MIN ENTHALPY protocol favored sequences more hydrophobic at their surfaces while MAX GAP preferred more hydrophilic core proteins. This discrepancy was due to the fact that MAX GAP took into account the unfolded state of the protein, and a strong hydrophilic core would minimize the unfolded enthalpy of the protein (PHI monomers are more soluble at low-T) thus minimizing the relative gap. This discrepancy was not important considering that at low-T there is a bigger number of sequences capable of folding.
IV. EXPANSION OF THE SYSTEM TO 3D
The main objective of my work has been to expand the program coded in FORTRAN 90 by Dr. Valentino so it would be capable of designing a three-dimensional stable protein, compute it in order to extract the data of the designs and assess whether the results were in concordance with those achieved in their 2D study.
In that endeavor, some obstacles were presented, that I will now detail along with the manner in which they were solved:
i) The 3-dimentional lattice increased dramatically the number of cells in the system and therefore the memory necessary to allocate all the matrixes and the computing time of each step, taking over 10Gbs of ram. It couldn’t be run on a personal computer, so I was allowed to use the University cluster in order to execute it. Even so, I had to reduce the initial system to a 4·4·3 polymer in a 93 lattice, hence having only 4 internal monomers.
ii) The maximum of 4-bonds per particle was a constrain that had to be taken into account because each particle had 6 nearest neighbors. To consider it, a protocol was designed that
counted the bonds each molecule was making and broke off one randomly whenever a water molecule was going to do more than 4.
iii) The covalent term of the Hamiltonian (see 3.1) also had to be changed. In 2 dimensions we had 6 possible pairs, as we can see in the binomial coefficient (42) = 6. In 3D we had (6
2) = 15 pairs of neighboring cells.
Other obstacles were of a structural nature and won’t be discussed in this memoir.
V. RESULTS
Once the program was finished, it was executed for several P-T conditions, shown in table I.
Pressure [IU] Temperature [IU] Initial enthalpy Final enthalpy 0.2 0.2 -0.2 -12 0.2 0.5 -0.2 -14.12 0.8 0.2 -0.2 -33.71
TABLE I: Initial and final associated enthalpy for the proteins
designed at various design temperatures and pressures. These P-T conditions were chosen to enable comparison with 2D results.
FIG. 3: Graphic representation of the protein’s enthalpy (in internal
units) as a function of time (optimization sequences) for T=0.2 and P=0.2. Each dot marks a step in which the swap led to a lower value for the associated enthalpy.
Figure 3 shows how the protocol successfully optimized sequences to achieve configurations with lower associated enthalpy. The study of the stability regions for the designed proteins is out of the scope of this work, but it would complement the findings by ensuring that the expected stability region is confirmed.
As previously said, the target structures were polymers consisting in 48 monomers distributed in three layers of 16, with 44 amino acids in contact with the solvent and 4 in their core. Figure 4 shows a vertical cut of each layer for a protein designed at P,T=0.8,0.2 so the structure and hydropathy of the chain can be properly appreciated.
Z=3
Z=4
Z=5
FIG. 4: Hydropathy profile for the protein designed at P=0.8 and
T=0.2. Hydrophobic residues have been painted green and hydrophobic are coloured brown. A cross has been used to indicate that the chain moves onto the next layer following a z-positive direction and a circle points otherwise. The protein core corresponds to the central monomers of z=4.
In the figure above one can see a strong presence of PHI amino acids on the surface of the protein. On the other hand, only one internal monomer is found to be hydrophobic on all three designs. The cause for this asymmetry between the presented results and those found on the previous study may lay in the fact that, because of the constraint in the lattice’s volume, the core in this design consists only of four monomers, while a small chain of 30 amino acids in 2D could have up to 12. Nonetheless, a deeper study should be done in order to clarify the reason behind the inconsistency.
Observing table II, we can see how the hydropathy of the surface is maintained. Although more data points would have been desirable, the amount of time taken in the design of the code and the increased executing time caused by the lattice’s dimensions have made impossible to replicate the design any further. Even so, our results in 3D expose a higher number of hydrophilic residues while maintaining the positive trend found when design temperature is increased.
P[IU] T[IU] 𝑄2D 3D
ℎ𝑦𝑑𝑃𝐻𝐼 𝑄ℎ𝑦𝑑𝑃𝐻𝐼
0.2 0.2 0.64 0.77
0.2 0.5 0.70 0.80
0.8 0.2 0.64 0.80
TABLE II: Quotient of hydrophilic residues (number of PHI divided
by total) on optimized proteins surfaces for the two-dimensional and the three-dimensional computational studies.
-14 -12 -10 -8 -6 -4 -2 0 0 5000000 10000000 15000000 H [I U] t(steps) Enthalpy vs Time
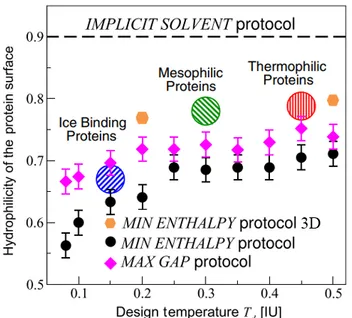
FIG. 5: Hydrophilicity quotient on designed proteins over a range of
design temperatures for the 2D protocols (MIN ENTHALPY is designed by black dots and MAX GAP by purple rhombuses) and the points found computing the MIN ENTHALPY protocol in 3D (orange hexagons). Discontinuous line marks IMPLICIT SOLVENT protocol, a study that doesn’t take into account the bulk’s water contribution to the enthalpy associated to the protein surface. Striped circles denote hydropathy found in real proteins. No error treatment has been done on 3D design because I only could do one simulation per each p,T.
In figure 5 one can see how sequence optimization using the different protocols we have discussed results in a distinct hydrophilicity of the monomers in the surface. We observe that
the expanded MIN ENTHALPY protocol draws proteins with heavily hydrophilic surfaces for low-temperature designs but is closer to experimental data at high temperatures. It is also clear that treating bulk water contribution to enthalpy non-explicitly is crucial in order to design proteins with a SR similar to those found in nature.
IV. CONCLUSIONS
• In this work we have expanded successfully the design of a stable protein to three dimensions. The protocol used has allowed us to obtain proteins with a low enthalpy in their folded state and a strong hydrophilic surface, thus we expect them to have a wide Stability Range.
• The study should be followed with a larger variety of replicas over the P-T range of interest along with a computational study of their stability to obtain further knowledge on their behaviour over changes in the solvent’s P-T conditions.
Acknowledgments
I would like to sincerely thank my advisor, Dr. Franzese for his continued help throughout every step of this work and his patience while explaining the most difficult parts of its theoretical basis. I am also very grateful to Dr. Bianco help in the understanding of the code, without his help taking on this project would have been impossible. Finally, I want to thank Sotiris Panayiotou for his advice in working with the cluster and my parents for their constant support during my studies.
_
___________________________________________________________ [1] Vilanova O., Bianco V., Franzese G. (2017) «Multi-Scale
Approach for Self-Assembly and Protein Folding.» In: Coluzza I. (eds) Design of Self-Assembling Materials. Springer, Cham Phys.
[2] V. Bianco, N. Pagès-Gelabert, I. Coluzza, G. Franzese, «How the stability of a folded protein depends on interfacial water properties and residue-residue interactions.» Journal of molecular Liquids, Volume 245, 129-139 [3] V. Bianco, G. Franzese, C. Dellago, I. Coluzza, «Role of
Water in the Selection of Stable Proteins at Ambient and Extreme Thermodynamic Conditions,» Phys. Rev. X, 021047.
[4] V. Bianco, G. Franzese, «Contribution of Water to Pressure and Cold Denaturation of Proteins» Phys. Rev. Lett. 115, 108101
[5] Hawley SA, «Reversible pressure–temperature denaturation of chymotrypsinogen,» Biochemistry 1971;10(13):2436–42.
[6] Jamadagni SN, Bosoy C, Garde S. Designing
heteropolymers to fold into unique structures via water-mediated interactions. J Phys Chem B.
2010;114(42):13282–8
[7] S. Mizayawa, R. Jernigan; «Estimation of effective interresidue contact energies from protein crystal structures: quasi-chemical approximation, » Macromolecules 1985, 18, 3, 534-552
[8] Strong temperature dependence of water reorientation in hydrophobic hydration shells J. Chem. Phys. 130, 214511 (2009)
[9] Best RB, Mittal J. Protein simulations with an optimized water model: cooperative helix formation and
temperature-induced unfolded state collapse. J Phys Chem 2010;114(46):14916–23.