FUNCTIONAL BIODIVERSITY IN ETHIOPIAN AGROFORESTRY SYSTEMS:
IMPLICATIONS ON SOIL FERTILITY
SCUOLA SUPERIORE SANT’ANNA, PISA, ITALY
FUNCTIONAL BIODIVERSITY IN ETHIOPIAN AGROFORESTRY SYSTEMS:
IMPLICATIONS ON SOIL FERTILITY AND LIVELIHOOD STRATEGY
HAILIE SHIFERAW WOLLE
DOCTORAL DISSERTATION
PhD PROGRAMME IN AGROBIODIVERSITY SCUOLA SUPERIORE SANT’ANNA, PISA, ITALY
JUNE, 2018
FUNCTIONAL BIODIVERSITY IN ETHIOPIAN AGROFORESTRY SYSTEMS:
AND LIVELIHOOD STRATEGY
FUNCTIONAL BIODIVERSITY IN ETHIOPIAN AGROFORESTRY SYSTEMS:
IMPLICATIONS ON SOIL
1
Academic Year
PhD
FUNCTIONAL BIODIVERSITY IN ETHIOPIAN AGROFORESTRY SYSTEMS:
IMPLICATIONS ON SOIL FERTILITY AND LIVELIHOOD STRATEGY
Author
Hailie Shiferaw Wolle
Supervisor
Prof. Paolo Bàrberi
Academic Year 2017‐18
PhD in Agrobiodiversity
FUNCTIONAL BIODIVERSITY IN ETHIOPIAN AGROFORESTRY SYSTEMS:
AND LIVELIHOOD STRATEGY
2
FUNCTIONAL BIODIVERSITY IN ETHIOPIAN AGROFORESTRY SYSTEMS:
IMPLICATIONS ON SOIL FERTILITY AND LIVELIHOOD STRATEGY
HAILIE SHIFERAW WOLLE
SUBMITTED TO THE SCUOLA SUPERIORE SANT'ANNA, PISA
FOR THE REQUIREMENTS OF THE DEGREE OF PhD IN AGROBIODIVERSITY
JULY, 2018
PISA, ITALY
3
DECLARATION
I hereby declare that this PhD thesis comprises only my own research work except
where indicated. Any external contribution regarding data collection or analysis as well
as all the sources of information or any other material used have been fully
acknowledged in accordance with the standard referencing rules. I certify that this
thesis has not been previously submitted, neither partially nor totally, to any University
or Institution for the award of any other degree.
Hailie Shiferaw Wolle
i
ACKNOWLEDGEMENTS
First of all, I would like to thank the almighty God for being with me from the start to the end of this work. Next, I am very grateful to Prof. Paolo Bàrberi, my supervisor for his consistent advice, encouragement and critical comments, understanding, wholehearted support, supervision, and proper guidance of my research activities.
I would like to greatly indebted to my families for all their love and moral encouragement, Scuola Superiore Sant’Anna (SSSA) and Bioversity International for the financial support of my graduate study. I also very much thankful and keen appreciation should go to Dr. Gionata Bocci and Dr. StefanoCarlesi for their support and useful suggestion during statistical analysis. I additionally thankful to my intimate friends to all Agroecology group for their encouragement to complete this study.
Lastly but not the least, my special thanks to Mr. Daniel Adimasu and Mr. Belayneh Azene for their continue encouragement, insight and generous support in all my study. Finally, my gratitude goes to Amhara Regional Agricultural Research Institute for their finance management facilities and to all development agents and farmers who participated during the field data collection.
ii TABLE OF CONTENTS ACKNOWLEDGEMENTS ... i LIST OF ABBREVIATIONS ... v 1. General introduction ... 1 1.1. Agroecosystem services ... 1
1.2. Functional diversity and agroecosystem services ... 2
1.3. Agroforestry and soil fertility ... 3
1.4. Agroforestry systems in Ethiopia ... 4
1.5. Agroforestry and plant species diversity ... 6
2. General description of the study site ... 7
3. Structure of the PhD thesis ... 9
4 Plant species diversity and composition in homegarden and parkland agroforestry systems ... 11
4.1 Introduction ... 11
4.2 Materials and methods ... 12
4.3 Statistical analysis ... 14
4.4 Results ... 15
4.4.1 Woody species in the homegarden agroforestry system ... 15
4.4.2 Species accumulation curves of woody species ... 24
4.4.3 Woody species composition in the homegarden agroforestry system ... 25
4.4.4 Herbaceous species diversity in the homegarden agroforestry system ... 27
4.4.5 Species accumulation curves of herbaceous species in the homegarden agroforestry system27 4.4.6 Species diversity in the parkland agroforestry system ... 28
4.4.7 Species accumulation curves of parkland agroforestry species ... 30
4.4.8 Species composition in parkland agroforestry systems ... 31
4.5. Discussion ... 33
4.5.1. Species diversity in homegarden and parkland agroforestry ... 33
4.5.2. Species composition in homegarden and parkland agroforestry systems ... 34
4.6. Conclusion ... 35
5 Traits of dominant tree/shrub species in home-garden and parkland agroforestry systems as related to soil fertility ... 37
5.1 Introduction ... 37
5.2 Materials and Methods ... 38
iii
5.3 Statistical analysis ... 40
5.4 Results ... 40
5.4.1 Functional traits of Coffea arabica, Rhamnus prinoides and Croton macrostachyus ... 40
5.4.2 Effects of functional traits on soil fertility... 43
5.5 Discussion ... 45
5.5.1 Functional traits variation across villages ... 45
5.5.2 Effects of functional traits on soil fertility... 45
5.1 Conclusions ... 46
6 Effect of home-garden and parkland agroforestry systems on selected soil properties ... 47
6.1 Introduction ... 47
6.2 Materials and methods ... 48
6.3 Statistical analysis ... 48
6.4 Results ... 49
6.5 Discussion ... 51
6.5.1 Soil pH ... 51
6.5.2 Soil organic carbon and soil organic matter ... 51
6.5.3 Available phosphorus and exchangeable potassium ... 52
6.6 .Conclusions ... 53
7 Gender analysis: species preference and decision making in the homegarden agroforestry system 55 7.1 Introduction ... 55
7.2 Materials and methods ... 56
7.2.1 Household survey... 56
7.3 Statistical analysis ... 56
7.4 Results ... 57
7.4.1 Household characteristics of the respondents ... 57
7.4.2 Wild edible fruit tree species in the study villages ... 58
7.4.3 Livelihood strategy of the villages ... 60
7.4.4 Homegarden agroforestry tree/shrub species preferred by women ... 62
7.4.5 Level of women’s decision making ... 64
7.5. Discussion ... 65
7.5.1. Importance of wild edible fruit species in the study area ... 65
iv
7.5.3. Homegarden agroforestry tree/shrub species preferred by women ... 66
7.6. Conclusions ... 66
8 General discussion ... 68
8.1. Agroforestry system management for plant diversity conservation ... 68
8.2. Implication of agroforestry systems on soil management ... 68
8.3. Conclusions and recommendations ... 69
v LIST OF ABBREVIATIONS
ANOVA Analysis of Variance
Av.P Available phosphorus
CC Canopy cover
CCA Canonical correspondence analysis
Das Development agents
DBH Diameter at breast height
Df Degrees of freedom
Ex.K Exchangeable potassium
FAO Food and Agricultural Organization
HH Household
ICRAF International Centre for Research in Agroforestry1
LL Leaf length
LW Leaf width
MoFED Ministry of Finance and Economics development
MS Mean square
NMDS Non‐metric Multidimensional Scaling NLB Number of leading branches
OC Organic carbon
OM Organic matter
PERMANOVA Permutational Analysis of Variance
PL Petiole length
Q-Q-plots Quintile‐Quintile plots SE Standard error of the Mean SOC Soil Organic Carbon
SS Sum of squares
SSSA Scuola Superiore Sant’Anna
TN Total nitrogen
1
vi ABSTRACT
Agroforestry is a human‐managed habitat which is home of many and diversified plant species. Studies on various agroforestry systems developed in Ethiopia focused on system interactions, food production and spatial design. So far little attention has been given to the role of homegarden and parkland agroforestry systems and of functional plant diversity on plant species conservation and soil fertility improvement in the study area. The objectives of this study were to assess and evaluate plant species diversity and composition, characterize plant functional traits, examine effects of agroforestry on soil fertility improvement and assess women’s tree and shrub species preference in homegardens and their decision making process at five villages in the Amhara regional state of Ethiopia.
Vegetation surveys were carried out on the two agroforestry systems common in the study area: homegarden (10 x 10 m sampling plot per household) and parkland (two transects 1000 m far from one another, including 50 x 100 m plots). Leaf functional trait characterization was carried out by choosing one healthy tree/shrub individual on which five leaves were collected, where leaf width, leaf length and petiole length were measured. Soil samples were taken in homegarden and parkland agroforestry systems and on adjacent agricultural land without trees (control) at 0‐15 and 15‐30 cm depths. A semi‐structured questionnaire and focus group discussion were used as tools to collect information on lists of available wild fruits, and on women’s homegarden agroforestry tree and shrub species preference and their level of decision making.
A total of 148 plant species, belonging to 51 families were recorded in the homegarden agroforestry system, whereas 24 plant species, belonging to 15 families were recorded in the parkland agroforestry system. Dominant tree/shrub species functional traits significantly varied across the villages in both agroforestry systems. Most functional traits like canopy cover, above‐ground biomass, leaf length, leaf width, relative abundance of nitrogen fixing trees and tree diameter were positively correlated with key soil fertility parameters. Higher soil organic carbon, organic matter, available phosphorus and exchangeable potassium were found in the homegarden agroforestry system, while the lowest values were recorded on fields without trees (control). A comparatively similar wild fruit species composition was found in Kuyu, Mariamwuha and Addisalem villages. Wild edible fruits provide supplementary food, nutrition and generate income for households. Women and men have different livelihood alternatives, the former having more livelihood options than men. The level of women involvement in decision making in the choice of homegarden agroforestry tree/shrub species selection was not
vii
different among villages. The overall results suggest that homegarden and parkland agroforestry in the Amhara region should be given more attention for maintaining soil fertility and conserving plant agrobiodiversity. Future land use management would need to raise awareness on the importance of agroforestry systems for the provision of ecosystem functions and services and for improving food security.
1
CHAPTER ONE
1. General introduction
1.1. Agroecosystem services
Agroecosystems are terrestrial ecosystems where part of the surface is managed for production, and to achieve this goal vegetation is mostly planted and managed to increase harvestable parts. Agroecosystems consist of a diversity of different habitats, like plantation forests, agroforestry systems, croplands, and various types of natural and semi‐natural habitats (Tscharntke et al., 2005). As an element of agricultural landscapes, an agroforestry system may provide numerous agroecosystem services: improved soil fertility, reduced erosion, biodiversity conservation, improved water quality, carbon sequestration, pollination, pest and disease management (Julián et al., 2017; Tully and Ryals, 2017; Nair et al., 2009).
Agroforestry is “a dynamic ecologically based natural resources management system that, through integration of trees on farms and in the agricultural landscape, diversifies and sustains production for increased social, economic and environmental benefits” (ICRAF, 1997). It is an integrated approach to solve land use problems by allowing farmers to produce fodder, food, and fuel simultaneously from the same unit of land. Moreover, agroforestry systems offer stable environment for natural enemies due to diverse age structure of trees/shrub species that creates a moderate microclimate (Lithourgidis et al., 2011; Rusch et al., 2010; Tscharntke et al., 2007) and provides abundant food sources (Harterreiten‐Souza et al., 2014; Tscharntke et al., 2011).
Agroforestry has positive effects on crop productivity, when it is carefully managed and proper species are selected (Smethurst et al., 2017; Geremew, 2016; Young, 1987a; Nair, 1984). Studies carried out in Ethiopia (at Debre Zeit and Alemaya) showed that wheat and maize yields increased by 50% under Faidherbia albida canopy compared to those further away from the base of the tree (Dechasa, 1989). Faidherbia albida had an effect on grain crops growing under the tree and increased yields by 100 percent compared with crops grown away from the trees also in Jain (2010). Wheat grain yield was significantly influenced by Melia azedarach trees and the highest grain yield (3.27 t ha‐1) was obtained under the tree canopy (Roy et al., 2005). In the highlands of Tigray (northern Ethiopia), higher barley
2
yield was found at 1 m distance from the tree (1.44 t ha‐1) compared to yields measured at 50 m distance (0.94 t ha‐1) on scattered Faidherbia albida based parkland agroforestry systems (Kiros et al., 2009). Therefore, integration of trees with crops are important for enhancing agroecosystem services (here intended as crop productivity).
However, trees in agroforestry systems sometimes have negative effects on associated crops due to various interactions taking places between the tree and crop species; this mainly happens when the agroforestry system is poorly designed showing improper tree/shrub species integration with crops. Friday and Fownes (2002) showed that trees and crops competed for light, resulting in reduced maize yield in an alley cropping system. Other authors reported that crop yield decreased due to soil nutrient competition between trees and crops (Yun et al., 2012). Furthermore, studies conducted by Kater et al. (1992) and Kessler (1992) showed that grain sorghum yield was reduced by 50 to 70% under the canopy of Vitellaria paradoxa and Parkia biglobosa, compared to areas without tree influence. Therefore, production‐related agroecosystem services provided by an agroforestry system are maintained as long as proper management and careful species selection is ensured.
1.2. Functional diversity and agroecosystem services
Anywhere in the globe modern industrialized agriculture is encountering sustainability concerns (Verbruggen and Kiers, 2010) because this system is extremely depending on high input and emphasizes cultivation of one or few crops to maximize yield. Growing of single crops reduces diversification and attracts more pests, diseases and weeds. Instead, the use of functional diversity related to the provision of agroecosystem services can increase productivity, and reduce weed, pest and disease damage (Costanzo and Bàrberi, 2014; Ratnadass et al., 2012). Functional diversity has been defined as a part of the total biodiversity composed of clusters of elements (at gene, species or habitat level) providing the same agroecosystem service, that is driven by within cluster diversity (Moonen and Bàrberi, 2008).
Functional diversity in agricultural landscapes can be increased by diversifying crop rotations, introducing cover crops, intercrops and especially agroforestry systems. Cover crops provide many agroecosystem services like weed suppression, soil erosion control, soil organic matter content increase, enhanced nutrient cycling, reduced pest and disease occurrence (Costanzo and Bàrberi, 2014;
3
Samedani et al., 2014; Ulla et al., 2014; Moonen and Bàrberi, 2008; Nakhone and Tabatabai, 2008). Cover crops suppress weed by hindering their growth through niche pre‐emption and allelophatic effects (Amoghein et al., 2013; Kruidhof et al., 2009; Kruidhof et al., 2008).
Agroforestry systems provide numerous agroecosystem services like soil fertility improvement, increased productivity, pollination and provision of food, fodder, fibre and medicine, and maintain species diversity (Bucheli and Bokelmann, 2017; Jose, 2009; Sileshi et al., 2007). Understanding and identifying functional diversity as an important part of overall biodiversity may help maintaining high plant species richness and diverse species composition in agroforestry systems.
1.3. Agroforestry and soil fertility
Agroforestry have proven potential to improve soil fertility (Pinho et al., 2012; Young, 1997; Nair, 1984). The known evidence‐based positive effects of agroforestry on soil fertility are: (1) increased nutrient supply (through nitrogen fixation from legume trees/shrubs and increased organic matter) and crop nutrient uptake, (2) reduced nutrient losses (through increased organic matter and erosion control) and (3) beneficial effects on soil biological processes (Sharma et al., 2016; Mehmod et al., 2015; Pinho et al., 2012; Buresh and Tian, 1998; Rhoades, 1997; Young, 1989a).
The presence of trees could enhance the status of soil organic carbon and total nitrogen which in turn improves soil quality (Wang et al., 2010). Pandey and Sharma (2005) reported that Acacia nilotica trees enriched soil organic matter levels under the canopy. In West Africa, Sirois et al. (1998) reported improved concentration of organic matter and total nitrogen in soils under canopies of Parinari excelsa and Parkia biglobosa. Organic matter accumulation under tree canopies is mainly attributed to leaf, fine root and twig litter falling under trees, which decomposes to form organic matter. In addition, tree roots absorb nitrate from the subsoil, subsequently bringing them to the surface soil (Young, 1997). Also, the shade created by tree canopy has the effect of reducing soil temperature and increasing soil moisture content, creating a better microclimate for soil microorganisms linked to soil organic matter formation and decomposition.
Jiregna et al. (2005) reported significantly higher surface and subsurface total soil nitrogen content under Cordia africana than in open field at Badessa, Ethiopia. Similar results were reported in other studies involving Cordia africana (Abebe et al., 2009; Zebene and Agren, 2007). Likewise, Millettia
4
ferruginea and Ficus thonningii significantly increased soil organic carbon and total nitrogen under their canopy (Daniel, 2011; Tadesse et al., 2000). All these evidences demonstrate that agroforestry systems with proper integration of trees with crops have paramount importance for soil fertility improvement in semi‐arid regions.
1.4. Agroforestry systems in Ethiopia
Ethiopia is one of the tropical countries in which agroforestry is a long‐time practice as old as agriculture (McNeely and Schroth, 2006; Atta‐Krah et al., 2004). The total area of agroforestry systems in Ethiopia is not well documented; however, different types of agroforestry systems are practiced in different parts of the country. According to Azene (2007), the various types of agroforestry practices identified in different parts of Ethiopia provide diverse ecological and socioeconomic services. Some of the identified agroforestry practices are boundary planting, live fencing, homegardens, trees on rangelands, windbreaks, woodlots, alley cropping, scattered trees on farmland (parkland agroforestry), enset‐coffee‐tree based agroforestry, and conservation based agroforestry. All these agroforestry systems are primarily designed for satisfying household food needs and generating income (Pinho et al., 2012; Mesele, 2007; Zebene, 2003) and can lead to sustainable production (Mehmood et al., 2015).
5
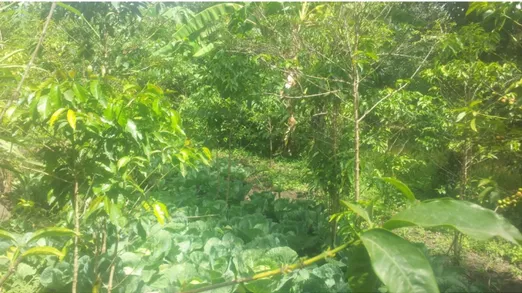
Figure 1.1: Parkland agroforestry system (top) and homegarden agroforestry system (bottom). Photos by the author
Homegarden and parkland agroforestry systems are the most common practices in Ethiopia as well as in the Amhara region. Both systems play a significant role for sustainable agricultural development and livelihood improvement for the local communities. Homegarden agroforestry systems provide multiple products like wood, food, fodder and cash income for the household (Tesfaye, 2005). Moreover, the presence of diverse species in this system considerably contributes to conservation of native species and soil fertility improvement (Kippie, 2002).
Homegarden agroforestry is practiced around the household and, unlike parkland agroforestry, involves the active presence of women: this is why the gender analysis part of this study (Chapter 7) was carried out only in homegarden agroforestry systems. Moreover, homegarden agroforestry depends on family labour where men and women actively participate in its management for improving their livelihoods. Studies on homegarden agroforestry systems indicate that tree growing and diversity may be affected by gender preferences. Men and women have a great traditional knowledge and
experience on agroforestry trees choice and management. Women are primary actors and are greatly
involved in all aspects of homegarden agroforestry activities (Bargali, 2015; Akhter et al., 2010; Fortmann and Rocheleau, 1985). Yet women decision making on homegarden agroforestry tree/shrub species selection is often hindered by their social and economic status, limited access to information and higher household workload.
6 1.5. Agroforestry and plant species diversity
Agroforestry is a viable habitat for many plant species, especially for endangered and rare species. Studies on various agroforestry systems developed in Ethiopia indicated that a variable yet high number of plant species was found in different agroforestry systems. Zemede (2002) found 146 shrubs, 135 herbaceous, 123 trees, and 25 climber plant species in and around homegarden agroforestry systems of Ethiopia. Different studies found a higher number of plant species in southern Ethiopia: 258 at Hawassa city (Reta, 2016), 224 at Basketo and Kefa (Feleke, 2011), 214 in Loma and Gena Bosa districts of Dwaro zone (Mathewos et al., 2013), 198 in the Sidama zone (78 cultivated crops + 120 tree species) (Tesfaye, 2005), 165 in the Gedeo zone (Solomon, 2011), 159 in the Wolayta zone (Talemos et al., 2013), and 133 in Arba Minchi Zuria (Belachew et al., 2006).
In north western Amhara region, Fentahun (2008) and Ewuketu et al. (2014) reported 85 and 69 plant species respectively. Belay et al. (2014) found 55 woody species (48 indigenous and 7 exotic) in agricultural landscapes of the Debark district (NW Amhara). In addition, available reports from different parts of the country reported 64 woody species in the homegarden of Arisi Negele (Motuma, 2006) and 113 plant species in the Sebeta‐Awas district of the Oromia region (Tefera et al., 2015). All these studies reveal a high role of agroforestry systems as support of plant species diversity and their significant contribution to conservation of plant species.
7
CHAPTER TWO
2. General description of the study site
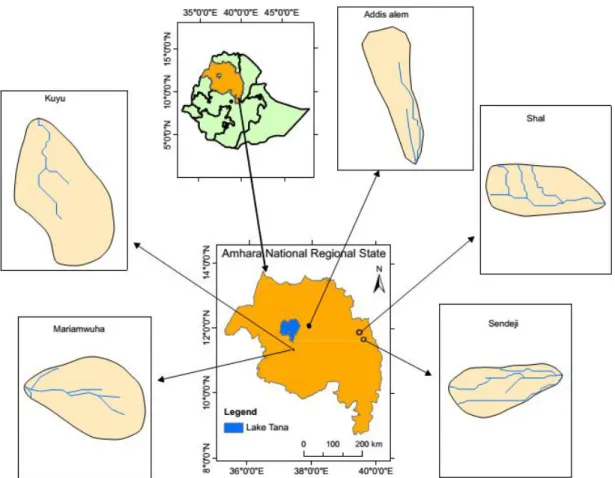
The study was conducted in the Amhara national regional state of Ethiopia. Amhara national regional state (ANRS) is one of the federal states located in the north western and north central part of the country (Figure 2.1). The region is located 565 km from the capital city (Addis Ababa) and it has a total area of 170,052 km2 (Alemayehu, 2017). The current population of the region is about 27 million people comprised of five different ethnic groups. The elevation ranges from approximately 500 to 4620 m a.s.l. in the highlands. Out of the different agro‐climatic zones existing in the region, the moist to sub‐humid warm subtropical climate (woyina‐dega) areas, which are situated between 1500‐2300 m a.s.l., are the most important in terms of agricultural productivity.
8
The average annual rainfall of lowland areas is around 700 mm (Bewket and Conway, 2007) while highlands receive more than 2000 mm of rainfall (Awulachew et al., 2009). The main rainy season usually occurs between June and September. Maximum annual temperatures occur in March or April whereas minimum annual temperatures occur in November or December. The main agricultural practice is rainfed mixed farming systems. Crops that are commonly grown in the area are tef, sorghum, maize, finger millet, grass pea, bread wheat, food barley and potato. Farmers keep livestock for different purposes such as cattle for traction and donkeys to transport agricultural and non‐ agricultural products. Climate data for the sites (Table 2.1) were obtained from nearby meteorological stations.
Table2.1: Site characteristics of the study villages in the Amhara region, Ethiopia Village
Site characteristics Addisalem Kuyu Mariamwuha Sendeji Shal Latitude Longitude 12°6’29’’ N 37°54’7’’ E 11°21’29’’ N 37°26’7’’ E 11°20’39’’ N 37°25’45’’ E 11°40’14’’ N 39°36’40’’ E 11°53’48’’ N 39°28’23’’ E Zone South Gonder West Gojam West Gojam North Wollo North Wollo District Libo kemkim Yilmana densa Yilmana densa Habru Gubalafito
Elevation (m a.s.l.) 2031 2292 2238 1849 2027 Precipitation (mm year‐1) 1017 1238 1238 924 994 Mean maximum Temperature (°C) 28.0 26.7 26.7 31.0 28.1 Mean minimum Temperature (°C) 10.7 12.4 12.4 14.9 15.2
9
CHAPTER THREE
3.
Structure of the PhD thesis
General objective
The general objective of this study was to investigate and compare the species diversity, functional trait, soil quality, women decision making and species preference of two agroforestry systems in five villages of Amhara regional state of Ethiopia.
Specific objectives
Assess and characterize plant species composition and functional diversity in home garden and parkland agroforestry systems.
Assess functional trait variability of dominant tree/shrub species in home‐garden and parkland agroforestry systems.
Evaluate the effect of homegarden and parkland agroforestry systems on soil quality properties and relate it to functional plant diversity.
Assess women’s homegarden tree and shrub species preference and their level of decision making on species preference.
Scientific hypotheses
Homegarden agroforestry systems have higher species richness and plant diversity than parkland agroforestry systems due to a higher level of planned agrobiodiversity (selected tree/shrub species and crop varieties), whereas parkland agroforestry systems are mainly targeted at the maintenance of associated agrobiodiversity (spontaneous tree/shrub species). The size and arrangement of leaves and canopy cover are highly variable under different
environmental conditions such as altitude, temperature, precipitation, availability of water and light, and homegarden agroforestry system has better expression of services than parkland agroforestry. Higher species diversity increase biomass production and vegetation cover, which has positive effects on soil fertility.
10
Species functional diversity, and especially the presence of legume trees plays a crucial role in improving soil fertility through enhanced nutrient cycling and optimized nutrient availability; this effect is expected to depend on the type of agroforestry system (homegarden vs parkland). Both men and women play an important role in managing plant species, but often their
management and species preferences differ, and the level of decision on species preference of women is downplayed by local customary norms.
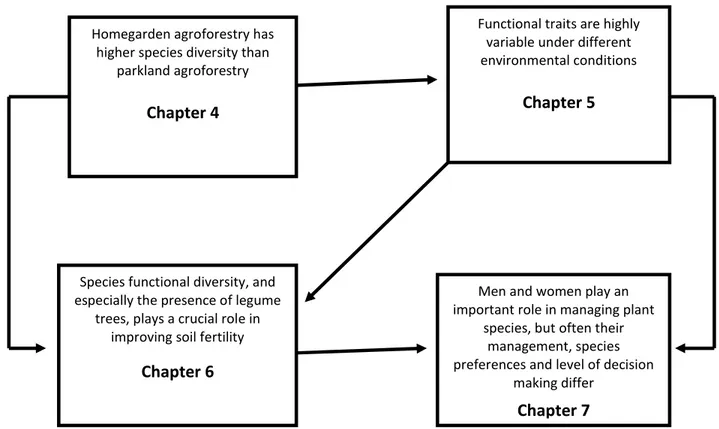
The links between research hypotheses and thesis chapters is reported in Fig. 3.1 below:
Figure 3.1: The links between hypotheses and main thesis chapters
Functional traits are highly variable under different environmental conditions
Chapter 5
Men and women play an important role in managing plant
species, but often their management, species preferences and level of decision
making differ
Chapter 7
Species functional diversity, and especially the presence of legume
trees, plays a crucial role in improving soil fertility
Chapter 6
Homegarden agroforestry has higher species diversity than
parkland agroforestry
11
CHAPTER FOUR
4 Plant species diversity and composition in homegarden and parkland agroforestry
systems
4.1 Introduction
Ethiopian agricultural lands are fragile due to inherent unfavourable soil properties, over‐exploitation, mismanagement (deforestation, over‐grazing and inappropriate land use systems) and harsh weather conditions. These factors that are even worsened by changing climatic conditions, leading to significant problems in terms of soil erosion and loss of soil fertility. The consequences of such processes can be detected at the economic level [the agricultural production ‐ which accounts for 48% of the country GDP (World Bank, 2015; MoFED, 2006) – is currently being jeopardized], at the social level (with risks of food insecurity and increasing malnutrition rates) and at the biological one (risks of biodiversity loss and habitat fragmentation).
Agroforestry practices can help mitigating the negative impacts of the above mentioned processes. Agroforestry is commonly defined as a land use system involving deliberate management of multipurpose trees and shrubs in association with annual and/or perennial agricultural crops and invariably livestock (Kumar and Nair, 2006). Depending on the expected function, species composition and structure (Nair, 1993), agroforestry can be classified in different practices. Among these, homegarden agroforestry is defined as a land use system involving integrated management of trees/shrubs, crops and livestock within the compounds of individual houses, where the whole tree‐ crop‐animal system is being intensively managed by family labour (Fernandes and Nair, 1986). In contrast, parkland agroforestry is a land‐use system in which scattered individuals of woody perennials are deliberately preserved in association with crops and/or animals in a spatially disperse arrangement, where there is both ecological and economic interaction between trees and other system components (Bonkoungou et al., 1994).
Well managed agroforestry systems have potential to control soil erosion, maintain soil fertility, promote nutrient cycling and conserve biodiversity (Sistla et al., 2016; McNeely, 2004). Usually, homegarden agroforestry systems have higher species richness and plant diversity than parkland agroforestry systems due to a higher level of planned agrobiodiversity (selected tree/shrub species and
12
crop varieties), whereas parkland agroforestry systems are mainly targeted at the maintenance of associated agrobiodiversity (spontaneous tree/shrub species) (Yemenzwork et al., 2017; Etefa and Raj, 2013).
However, the role of homegarden and parkland agroforestry system on species conservation in the study area is not well studied. Therefore, this study has been initiated to reveal the contribution of local agroforestry systems on conservation of agro‐biodiversity (i.e. agroforestry system components at species and habitat levels) and hence on the potential provision of multiple ecosystem services. As such, we first assessed and characterized plant species composition and diversity in homegarden and parkland agroforestry systems. We hypothesized that home garden agroforestry systems have higher species richness and plant diversity than parkland agroforestry systems due to a higher level of planned agrobiodiversity (selected tree/shrub species and crop varieties) whereas parkland agroforestry systems are mainly targeted at the maintenance of associated agrobiodiversity (spontaneous tree/shrub species).
4.2 Materials and methods
First a reconnaissance survey was conducted to have an overview of the characteristics of a representative study village. Next, we contacted the District development agents (DAs) before we started selection of the specific study villages. Based on the information obtained from the DAs, we selected five villages (Addisalem, Kuyu, Mariamwuha, Sendeji and Shal) with both homegarden and parkland agroforestry systems out of nine initial villages. Within each selected village, plant species diversity assessments were carried out on both agroforestry systems. Vegetation surveys were carried out in the dry season (May to June 2016).
Plant species diversity assessments in homegarden agroforestry were done in one randomly chosen 10 x 10 m sampling plot per household (Ewuketu et al., 2014; Mesele, 2013). Tree species diameter at breast height (DBH) was measured and all the individuals with DBH ≥ 2.5 cm were identified and counted by species. A total of 178 homegardens were sampled across the five villages. For herbaceous plants an ‘’X’’ sampling design was used: within the main plot, 2 x 2 m subplots were laid at the four corners of the main plot plus one in the central point (Ewuketu et al., 2014; Tesfaye , 2005). Inside the sub‐plots all herbaceous plants were identified and counted by species.
13
To characterize the vegetation of parkland agroforestry systems, two transects of 1800 m length each (at 1000 m distance from one another) were identified in each village. Along transects, six 50 x 100 m plots were laid at 300 m distance from one another. The first transect line and plot were randomly selected (Nikiema, 2005). All woody plants found in the plots were identified and counted by species. Plant species diversity was estimated through ecological indices: Shannon diversity index (H’), Equitability index (E) and Inverse Simpson diversity index (D).
The Shannon diversity index (H’) and Shannon equitability index (E) are used as a measure incorporating both species richness and evenness (Magurran, 2004). Shannon diversity index (H’) is high when the relative abundance of the different species in the sample is even, and decreases when few species are more abundant than the others. The Shannon diversity index (H’) is calculated as follows:
i
lnp
1
i
i
p
H'
s
Where s = number of species
pi = the proportion of individuals or abundance of the ith species expressed as proportion of the total abundance
ln = natural logarithm
Evenness compares the distribution of individuals among the species in a given habitat (Pielou, 1975). Evenness (Shannon equitability) index (E) was calculated to estimate the degree of homogeneity of species distribution, as follows:
. lns 1 i i lnp i p . max H' H' s E
Where H’ = Shannon diversity index Hmax = lnS
S = total number of species in the sample
Simpson diversity index is derived from probability theory and it is the probability of randomly sampling two organisms that belong to different species (Magurran, 2004). Simpson diversity index (D) was calculated using the following formula:
14
Where pi = the proportion of individuals of the ith species or the abundance of the ith species expressed as proportion of total plant cover
Species accumulation models deal with collections of sites and their species richness (Oksanen, 2016). In this study, species accumulation curves were used to compare species richness among villages where plants were sampled with different sampling efforts. The curve is plotted by using the number of species as a function of the number of samples. The curves generally grow rapidly initially, as most common species are found first, and then approaches a plateau when only the rarest species remain to be sampled.
4.3 Statistical analysis
Statistical analysis was performed through Analysis of Variance (ANOVA) for Shannon diversity, Inverse Simpson diversity (1/D), species richness and evenness of woody and herbaceous species in homegarden agroforestry, and of tree/shrub species in parkland agroforestry. ANOVA was followed by protected Tukey HSD mean comparison test. For data that violated the assumptions of ANOVA, the non‐parametric Kruskal‐Wallis rank sum test was used (Hollander and Wolfe, 1973), performed with the kruskal.test function in the stats package of R. Following the Kruskal‐Wallis test, a post‐hoc analysis was performed to determine which independent variables significantly differed from each other. This was done with the Dunn test of multiple comparisons (Dunn, 1964), performed with the dunn.test function in the FSA package of R.
The structure of plant species assemblages was inspected using species accumulation curves through the specaccum accumulator functions with rarefaction method of the R software. Rarefaction finds the expected species richness and its standard deviation by sampling individuals instead of sites (Colwell et al., 2012). Subsequently, Permutational Multivariate Analysis of Variance (PERMANOVA) was performed using the adonis function in the vegan packageof R (Anderson, 2001) to check differences in dissimilarities of species among villages. Adonis is a function for the analysis and partitioning of sums of squares using semi‐metric distance matrices (Anderson, 2001). Species composition was inspected by using non‐metric multidimensional scaling analysis (NMDS), performed using the vegan metaMDS function (Faith et al., 1987) with Bray‐Curtis ordination method. The latter calculates a distance matrix
2
1
p
i
15
by selecting two reference points (either real or synthetic samples) for determining the direction of each axis and projects all samples onto each axis using their relationship to the two reference points (Beals, 1984). Moreover, NMDS allows for an indirect examination of how environmental factors may influence community composition by fitting vectors representing environmental variables onto the ordination. This was done using the envfit function of R (Oksanen, 2016). All analyses were performed using R 3.4.2 software (R development core team, 2017).
4.4 Results
4.4.1 Woody species in the homegarden agroforestry system
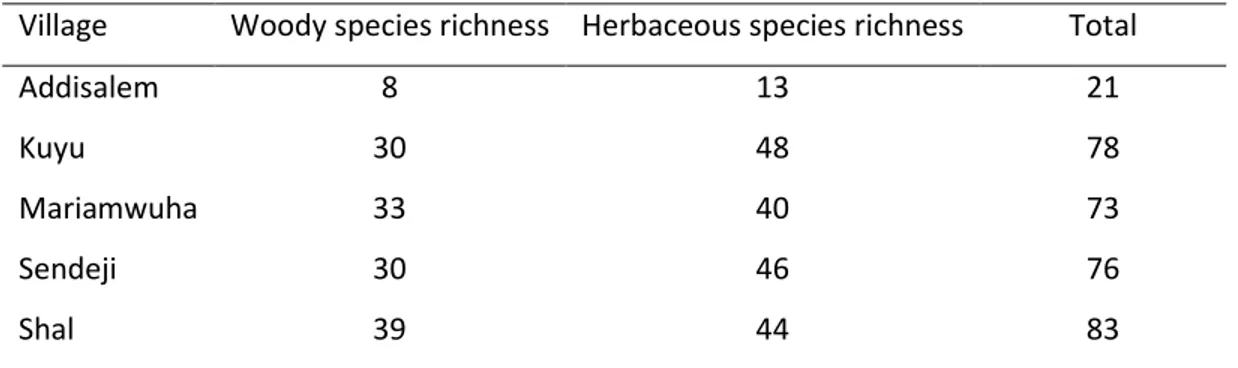
A total of 148 plant species (59 woody and 89 herbaceous species), belonging to 51 families were recorded from all the 178 sample plots in the study villages. The number of species varied across villages: the highest numbers of woody and herbaceous species were recorded at Shal and Kuyu respectively, while by far the lowest number of species of both kinds was recorded at Addisalem (Table 4.1). Among the woody species families, Fabaceae, Rutaceae, Euphorbiaceae and Moraceae were the most diverse, i.e. they comprised the highest number of species, having 10, 6, 5 and 4 species respectively. Seventeen families were represented by a single species while the rest of the families were represented by two or more species. Among the herbaceous families Asteraceae, Poaceae, Fabaceae, Solanaceae, and Lamiaceae were the most diverse, being represented by 10, 9, 7, 6 and 5 species respectively.
Table 4.1: Woody and herbaceous species richness in the homegarden agroforestry system in five villages of the Amhara region, Ethiopia
Village Woody species richness Herbaceous species richness Total
Addisalem 8 13 21
Kuyu 30 48 78
Mariamwuha 33 40 73
Sendeji 30 46 76
16
The frequency of occurrence of woody and herbaceous species across the study villages is presented in Tables 4.2 and 4.3. From the total woody species recorded Rhamnus prinoides, Coffea arabica, Cordia africana and Ricinus communis were the four that more frequently appeared in the homegarden agroforestry system. Among herbaceous species Salvia tiliifolia, Snowdenia polystachya, Cyperus fischranus, Amaranthus retroflexus and Cynodon dactylon were the five most frequent.
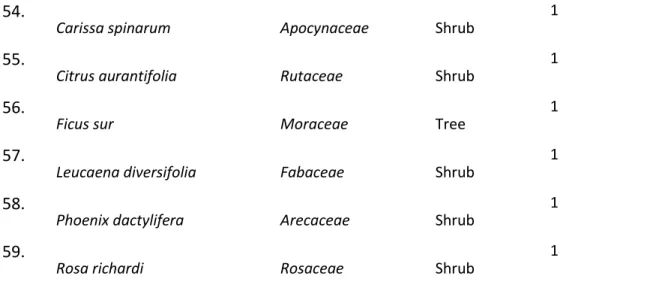
Table 4.2: List of woody plant species with name, botanical family, growth habit and abundance (total number of individuals) found in homegarden agroforestry systems in five villages of the Amhara region, Ethiopia
No. Species Family Growth habit Abundance
1.
Rhamnus prinoides Rhamnaceae Shrub
2531 2.
Coffea arabica Rubiaceae Shrub
2269 3.
Cordia africana Boraginaceae Tree
478 4.
Ricinus communis Euphorbiaceae Shrub
429 5.
Vernonia rueppellii Asteraceae Shrub 246
6.
Persea americana Lauraceae Tree
221 7.
Mangifera indica Anacardiaceae Tree 211
8.
Citrus sinensis Rutaceae Tree 198
9.
Justitia schimprerana Acanthaceae Shrub 194
10.
Sesbania sesban Fabaceae Shrub 182
11.
Catha edulis Celastraceae Shrub
173 12.
Vernonia amygdalina Asteraceae Shrub 143
13.
Psidium guajava Myrtaceae Tree
17 14.
Croton macrostachyus Euphorbiaceae Tree
82 15.
Ehretia cymosa Boraginaceae Tree
78 16.
Grevillea robusta Proteaceae Tree
48 17.
Clausena anista Rutaceae Shrub
47 18.
Euphorbia tirucalli Euphorbiaceae Shrub
45 19.
Olea africana Oleaceae Tree
44 20.
Eucalyptus camaldulensis Myrtaceae Tree
40 21.
Celtis africana Ulmaceae Tree
28 22.
Euphorbia cotinifolia Euphorbiaceae Shrub
28 23.
Dodonea angustifolia Sapindaceae Shrub
27 24.
Cajanus cajan Fabaceae Shrub
26 25.
Grewia bicolor Tiliaceae Tree 25
26.
Casimiroa edulis Rutaceae Tree
17 27.
Senna siamea Fabaceae Shrub 17
28.
Euphorbia abyssinica Euphorbiaceae Tree 14
29.
Brucea antidysenterica Simaroubaceae Shrub 12
30.
Schinus molle Anacardiaceae Tree 12
31.
Ficus ovata Moraceae Tree
11 32.
Juniperus procera Cupressaceae Tree 11
33.
Ziziphus spina-christi Rhamnaceae Tree
18 34.
Gossypium herbaceum Malvaceae Shrub
10 35.
Millettia ferruginea Fabaceae Tree
10 36.
Pavetta oliverana Rubiaceae Tree
9 37.
Malus domestica Rosaceae Shrub
8 38.
Chamaecytisus palmensis Fabaceae Shrub
7 39.
Citrus aurantium Rutaceae Shrub
7 40.
Grewia ferruginea Tiliaceae Shrub
6 41.
Morus alba Moraceae Shrub
6 42.
Acacia saligna Fabaceae Shrub
5 43.
Citrus medica Rutaceae Shrub
5 44.
Acacia decurrens Fabaceae Tree
4 45.
Calpurnia aurea Fabaceae Shrub 4
46.
Casuarina equisetifolia Casuarinaceae Tree
4 47.
Ficus thonningii Moraceae Tree 4
48.
Rosa abyssinica Rosaceae Shrub 4
49.
Buddleia polystachya Buddlejaceae Shrub 3
50.
Maytenus arbutifolia Celastraceae Shrub 3
51.
Azadirachta indica Meliaceae Tree
3 52.
Withania somnifera Solanaceae Shrub 3
53.
Acacia abyssinica Fabaceae Tree
19 54.
Carissa spinarum Apocynaceae Shrub
1 55.
Citrus aurantifolia Rutaceae Shrub
1 56.
Ficus sur Moraceae Tree
1 57.
Leucaena diversifolia Fabaceae Shrub
1 58.
Phoenix dactylifera Arecaceae Shrub
1 59.
Rosa richardi Rosaceae Shrub
1
Table 4.3: List of herbaceous plant species with name, botanical family, growth habit and abundance (total number of individuals) found in homegarden agroforestry systems in five villages of the Amhara region, Ethiopia
No. Species Family Growth habit Abundance
1.
Salvia tiliifolia Lamiaceae Herb 989
2.
Snowdenia polystachya Poaceae Herb
390 3.
Cyperus fischranus Cyperaceae Herb
322 4.
Amaranthus retroflexus Amaranthaceae Herb
300 5.
Cynodon dactylon Poacea Herb
297 6.
Brassica carinata Brassicaceae Herb
288 7.
Tagetes minuta Asteraceae Herb
199 8.
Oxalis corniculata Oxalidaceae Herb
184 9.
Bidens pilosa Asteraceae Herb
171 10.
Sida tenuicarpa Malvaceae Herb
160 11.
Solanum tuberosum Solanaceae Herb
20 12.
Commelina benghalensis Commelinaceae Herb
132 13.
Dichondra repens Convolvulaceae Herb
102 14.
Capsicum annuum Solanaceae Herb
100 15.
Carica papaya Caricaceae Shrub
110 16.
Achyranthes aspera Amaranthaceae Herb
97 17.
Emex spinosa Polygonaceae Herb
83 18.
Cyperus dichroostachyus Cyperaceae Herb
82 19.
Reseda lutea Resedaceae Herb
78 20.
Plectranthus lanunginosus Lamiaceae Herb
75 21.
Datura stramonium Solanaceae Herb
72 22.
Ocimum basilicum var. pilosum Lamiaceae Herb
72 23.
Galinsoga quadriradiata Asteraceae Herb 57
24.
Acmella caulirhiza Asteraceae Herb
54 25.
Launaea taraxacifolia Asteraceae Herb 54
26.
Setaria viridis Poaceae Herb 53
27.
Oxygonum sinuatum Polygonaceae Herb 47
28.
Zea mays Poaceae Herb 43
29.
Cuminum cyminuni Umbelliferae Herb
41 30.
Lathyrus sativus Fabaceae Herb 41
31.
Solanum lycopersicum Solanaceae Herb
21 32.
Solanum nigrum Solanaceae Herb
39 33.
Ruta chalepensis Rutaceae Herb
36 34.
Conyza pyrrhopappa Asteraceae Herb
35 35.
Brassica oleracea var.capitata Brassicaceae Herb
34 36.
Pergularia daemia Asclepiadaceae Vine
33 37.
Plantago lanceolata Plantaginaceae Herb
29 38.
Euphorbia prostrata Euphorbiaceae Herb
26 39.
Parthenium hysterophorus Asteraceae Herb
23 40.
Musa paradisiaca Musaceae Shrub
22 41.
Phaseolus vulgaris Fabaceae Herb
22 42.
Crinum ornatum Amaryllidaceae Herb
20 43.
Guizotia scabra Asteraceae Herb 19
44.
Hibiscus macranthus Malvaceae Herb
19 45.
Coriandrum sativum Compositae Herb 18
46.
Brassica oleracea Brassicaceae Herb 17
47.
Senecio steudelii Asteraceae Herb 15
48.
Lactuca sativa Asteraceae Herb 14
49.
Allium sativum Amaryllidaceae Herb
13 50.
Ipomoea batatas Convolvulaceae Vine 13
51.
Salix mucronata Salicaceae Herb
22 52.
Urtica simensis Urticaceae Herb
13 53.
Guizotia abyssinica Asteraceae Herb
12 54.
Saccharum officinarum Poacea Herb
12 55.
Galeopsis tetrahit Lamiaceae Herb
11 56.
Geranium arabicum Geraniaceae Herb
11 57.
Rumex abyssinica Polygonaceae Herb
11 58.
Acanthus eminens Acanthaceae Herb
10 59.
Centella asiatica Apiaceae Vine
10 60.
Ocimum lamiifolium Labiatae Shrub
10 61.
Triumfetta pilosa Tiliaceae Herb
10 62.
Cicer arietinum Fabaceae Herb
9 63.
Ocimum basilicum Lamiaceae Herb 9
64.
Zehneria scabra Cucurbitaceae Vine
9 65.
Solanum indicum Solanaceae Herb 8
66.
Triolium decorum Fabaceae Herb 8
67.
Eragrostis tef Agavaceae Herb 7
68.
Cucurbita pepo Cucurbitaceae Vine 6
69.
Lagenaria siceraria Cucurbitaceae Vine
6 70.
Myrtus communis Myrtaceae Herb 6
71.
Eleusine coracana Poaceae Herb
23 72.
Galium asparinoides Rubiaceae Herb
5 73.
Leucas martinicensis Lamiaceae Herb
5 74.
Lupinus albus Fabaceae Herb
5 75.
Nicandra physaloides Poaceae Herb
5 76.
Verbascum sinaticum Scrophulariaceae Herb
5 77.
Hordeum vulgare Poaceae Herb
4 78.
Beta vulgaris Amaranthaceae Herb
3 79.
Beta vulgaris subsp. vulgaris Amaranthaceae Herb
3 80.
Chamaesyce maculata Euphorbiaceae Herb
3 81.
Discopodium penninervium Solanaceae Shrub
3 82.
Evolvulus nummularius Convolvulaceae Herb
3 83.
Malva parviflora Malvaceae Herb 3
84.
Senna corymbosa Fabaceae Herb
3 85.
Ensete ventricosum Musaceae Shrub 2
86.
Rumex nervosus Polygonaceae Herb 2
87.
Asparagus africanus Asparagaceae Herb 1
88.
Eleusine floccifolia Poaceae Herb 1
89.
Vicia faba Fabaceae Herb
1
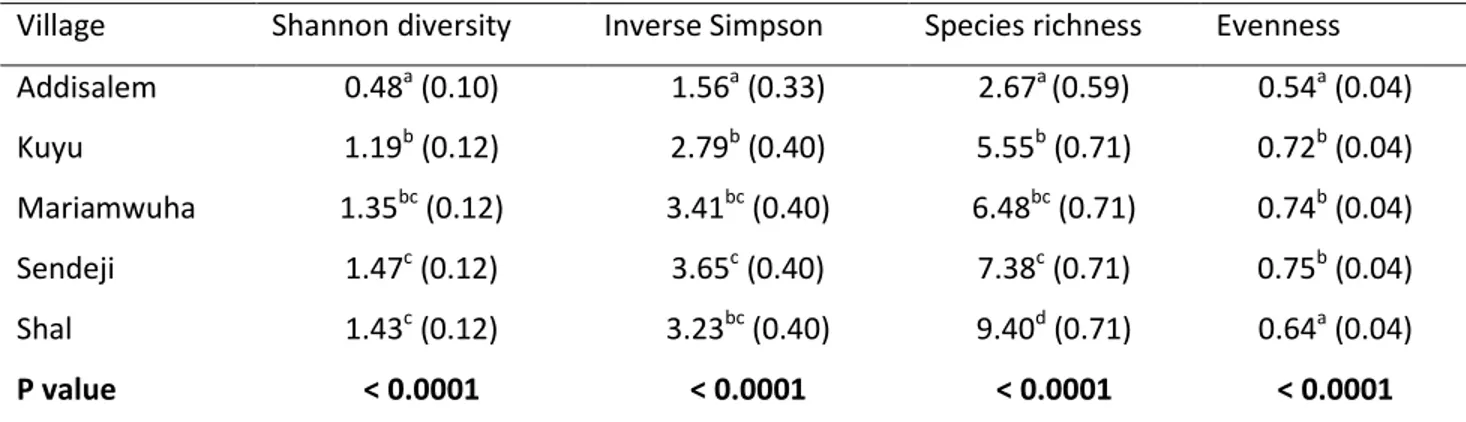
The diversity indices of woody plant species in the homegarden agroforestry system showed significant differences among villages (Table 4.4). Shannon diversity was significantly different among villages: the highest Shannon diversity index value was found at Sendeji followed by Shal, whereas the lowest was
24
recorded at Addisalem. Between the villages with the highest (Shal) and lowest (Addisalem) woody species diversity there was a three‐fold difference. The highest evenness was found at Sendeji and Mariamwuha.
Table 4.4: Mean value (SE) of Shannon, Inverse Simpson, Species richness and Evenness indices of woody species in homegarden agroforestry systems in five villages of the Amhara region, Ethiopia Village Shannon diversity Inverse Simpson Species richness Evenness
Addisalem 0.48a (0.10) 1.56a (0.33) 2.67a (0.59) 0.54a (0.04) Kuyu 1.19b(0.12) 2.79b(0.40) 5.55b(0.71) 0.72b(0.04) Mariamwuha 1.35bc(0.12) 3.41bc(0.40) 6.48bc(0.71) 0.74b(0.04) Sendeji 1.47c(0.12) 3.65c(0.40) 7.38c(0.71) 0.75b(0.04) Shal 1.43c(0.12) 3.23bc(0.40) 9.40d(0.71) 0.64a(0.04) P value < 0.0001 < 0.0001 < 0.0001 < 0.0001
Note: In each column, means with different letters are significantly different at P < 0.05
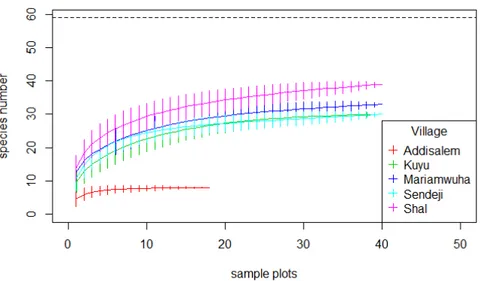
4.4.2 Species accumulation curves of woody species
The accumulation patterns of woody species in the homegarden agroforestry system showed clearly that the Addisalem village was different from all other villages. Shal had the highest species richness followed by Mariamwuha (Figure 4.1).
25
Figure 4.1: Species accumulation curve of woody species in the homegarden agroforestry system in five villages of the Amhara region, Ethiopia.
4.4.3 Woody species composition in the homegarden agroforestry system
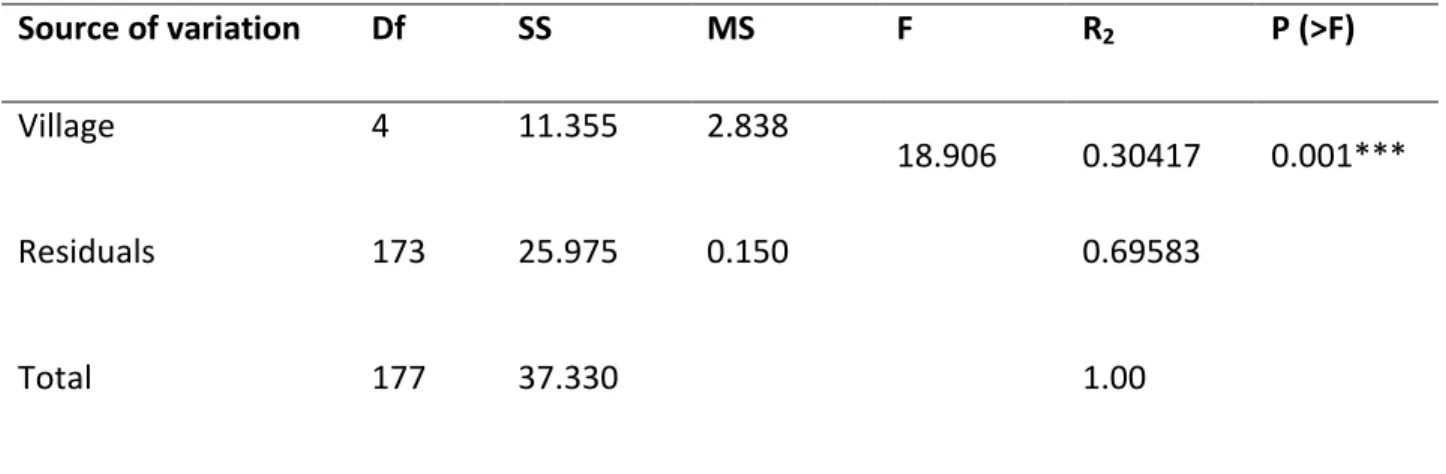
Non‐metric multidimensional scaling (NMDS) plot run with Bray‐Curtis dissimilarity with a final stress of 0.22 revealed that Kuyu, Mariamwuha and Addisalem villages grouped together, suggesting that they have relatively similar woody species composition and they are different from Shal and Sendeji villages (Figure 4.2). The PERMANOVA analysis showed that villages were dissimilar (F4, 173 = 18.906, P = 0.001) in woody species composition of the homegarden agroforestry system. Village explained 30% of total variation (R‐square) observed (Table 4.5). Species like Rhamnus prinoides, Justitia schimprerana, Sesbania sesban, and Croton macrostachyus overlapped around the centroids of Kuyu, Adisalem and Mariamwuha while others like Olea africana, Citrus sinensis, Psidium guajava, Cordia africana, overlapped around the centroids of Shal and Sendeji, indicating their association with the first or second group of villages respectively. Ziziphus spina-christi, Ficus thonningii, Acacia abyssinica, Casuria equisetifolia, Acacia saligna, Leucaena diversifolia, and Acacia decurrens were far away from any centroid and hence their association with a given village was even stronger. The Addisalem ellipsoid is far larger than the others, indicating a less homogeneous plant community. The reason for this could be that in this village the agroforestry practice began recently (pers. obs.), thus farmers are planting trees/shrub species according to their needs.
26
Figure 4.2: Non‐metric multidimensional scaling (NMDS) plot carried out by Bray‐Curtis ordination method of wood plants in the homegarden agroforestry systems of all villages. Ellipsoids represent 95% confidence intervals for each village.
Table 4.5: PERMANOVA analysis of variance of woody plants in homegarden agroforestry systems Source of variation Df SS MS F R2 P (>F) Village 4 11.355 2.838 18.906 0.30417 0.001*** Residuals 173 25.975 0.150 0.69583 Total 177 37.330 1.00 *Significant at P < 0.001
27
4.4.4 Herbaceous species diversity in the homegarden agroforestry system
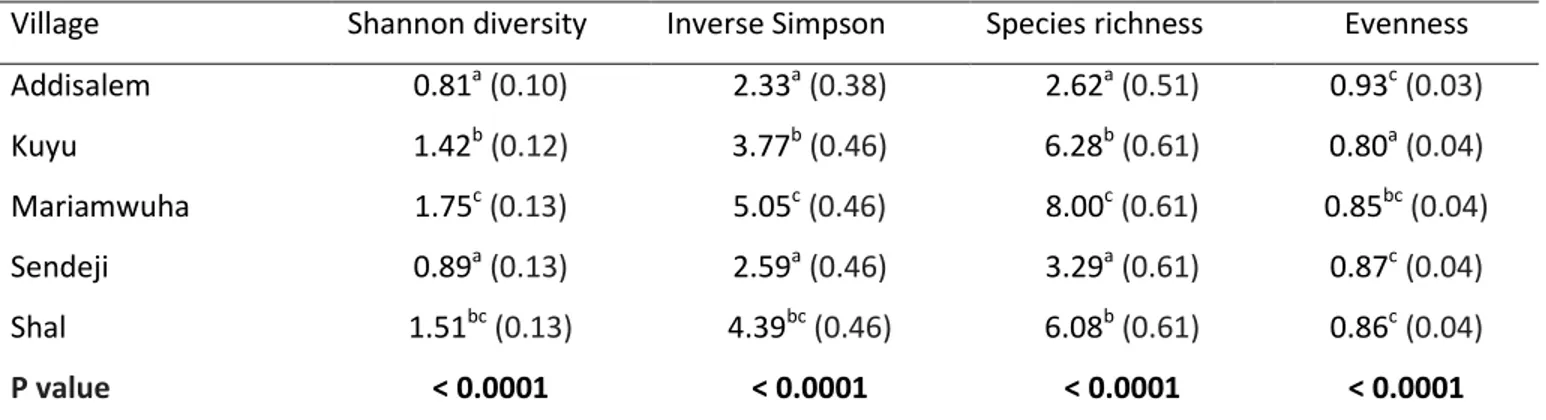
For herbaceous species, Shannon‐Weiner indices, Inverse Simpson, species richness and evenness showed significant differences among villages (Table 4.6). In contrast with woody species diversity, the highest Shannon diversity was found at Mariamwuha followed by Kuyu whereas, similarly to woody plant species diversity, the lowest Shannon diversity value was recorded at Addisalem.
Table 4.6: Mean value (SE) of Shannon, Inverse Simpson, Species richness and Evenness indices of herbaceous species in the homegarden agroforestry system in five villages of the Amhara region, Ethiopia
Village Shannon diversity Inverse Simpson Species richness Evenness Addisalem 0.81a (0.10) 2.33a (0.38) 2.62a (0.51) 0.93c (0.03) Kuyu 1.42b (0.12) 3.77b (0.46) 6.28b (0.61) 0.80a (0.04) Mariamwuha 1.75c (0.13) 5.05c (0.46) 8.00c (0.61) 0.85bc (0.04) Sendeji 0.89a (0.13) 2.59a (0.46) 3.29a (0.61) 0.87c (0.04) Shal 1.51bc (0.13) 4.39bc (0.46) 6.08b (0.61) 0.86c (0.04) P value < 0.0001 < 0.0001 < 0.0001 < 0.0001 Note: In each column, means with different letters are significantly different at P < 0.05
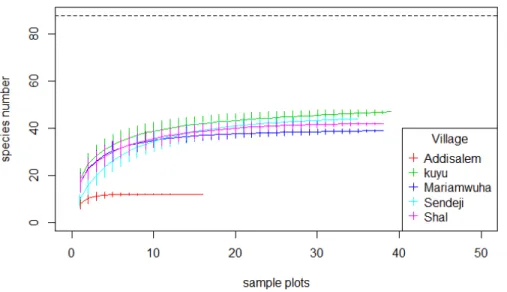
4.4.5 Species accumulation curves of herbaceous species in the homegarden agroforestry system The accumulation of herbaceous species indicated that Kuyu had the highest herbaceous plant species richness followed by Sendeji. Likewise accumulation of woody plants in homegarden agroforestry, Addisalem had the lowest herbaceous species richness (Figure 4.3).
28
Figure 4.3: Species accumulation curve of herbaceous species in the homegarden agroforestry system in five villages of the Amhara region, Ethiopia
4.4.6 Species diversity in the parkland agroforestry system
Farmers in the study villages retain various tree species based on space availability and their compatibility with agricultural crops and household objectives. In the study villages, a total of 24 plant species, belonging to 15 families, were recorded (Table 4.7). Among plant species, the family Fabaceae was the most represented; all the other families were present with a single species.
Table 4.7: Overall plant species richness of the parkland agroforestry system in five villages of the Amhara region, Ethiopia
Village Parameter
Species richness Mean number of trees ha‐1
Addisalem 10 2.0
Kuyu 5 5.8
Mariam wuha 9 3.3
Sendeji 6 2.2
29
The top five more frequent woody plant species in parkland agroforestry system across the study villages were Acacia seyal, Croton macrostachyus, Acacia abyssinica, Brucea antidysenterica and Fedherbia albida (Table 4.8).
Table 4.8: List of woody plant species with name, botanical family, growth habit and abundance (total number of individuals) found in parkland agroforestry in five villages of the Amhara region, Ethiopia
No. Species Family Growth habit Abundance
1 Acacia seyal Fabaceae Tree 153
2 Croton macrostachyus Euphorbiaceae Tree 110
3 Acacia abyssinica Fabaceae Tree 95
4 Brucea antidysenterica Simaroubaceae Shrub 51
5 Faidherbia albida Fabaceae Tree 40
6 Ziziphus spina-christi Rhamnaceae Tree 26
7 Acacia sieberiana Fabaceae Tree 18
8 Vernonia auriculifera Asteraceae Shrub 18
9 Cajanus cajan Fabaceae Shrub 16
10 Acacia tortilis Fabaceae Tree 13
11 Cordia africana Boraginaceae Tree 8
12 Terminalia brownii Combretaceae Tree 8
13 Olea africana Oleaceae Tree 5
14 Albizia gummifera Fabaceae Tree 4
15 Gardenia volkensii Rubiaceae Tree 2
16 Stereospermum kuntbianum Loganiaceae Tree 2
17 Acacia lahai Fabaceae Tree 1
18 Eucalyptus camaldulensis Myrtaceae Tree 1
19 Ficus sycomorus Moraceae Tree 1
20 Juniperus procera Cupressaceae Tree 1
21 Maytenus arbutifolia Celastraceae Shrub 1
22 Millettia ferruginea Fabaceae Tree 1
23 Piliostigma thonningii Fabaceae Tree 1
30
The ANOVA for Shannon diversity, inverse Simpson and species richness of parkland agroforestry species showed significantly differences among villages (Table 4.9). Addisalem village had a relatively higher Shannon diversity (0.73) followed by Kuyu (0.70), while Shal had the lowest value (0.23). Mariamwuha had a relatively higher inverse Simpson diversity (1.91) whereas Shal had the lowest (1.21). Like the case of Shannon diversity, Addisalem had relatively higher mean species richness (2.90) while Shal had the lowest (1.58). Evenness (the relative distribution of species) was not significantly different among villages.
Table 4.9: Mean value (SE) of Shannon, Inverse Simpson, Species richness and Evenness indices of parkland agroforestry species in five villages of the Amhara region, Ethiopia
Village /parameter Shannon diversity Inverse Simpson Species richness Evenness Addisalem 0.73b (0.10) 1.82b (0.15) 2.90b (0.29) 0.77a (0.04) Kuyu 0.70b (0.14) 1.88b (0.20) 2.50ab (0.41) 0.81a (0.06) Mariamwuha 0.66b (0.14) 1.91b (0.20) 2.58ab (0.41) 0.84a (0.06) Sendeji 0.51b (0.14) 1.65b (0.20) 1.91ab (0.41) 0.88a (0.06) Shal 0.23a (0.14) 1.21a (0.20) 1.58a (0.41) 0.68a (0.07) P value 0.0036 0.0057 0.014 0.09
Note: In each column, means with different letters are significantly different at P ≤ 0.05 4.4.7 Species accumulation curves of parkland agroforestry species
Species accumulation patterns of parkland agroforestry species in the five villages showed that more species accumulated at Addisalem than in the other villages. The curve for Kuyu flattened more quickly and showed a lower number of cumulated species (Figure 4.4). Mariamwuha and Shal showed a similar species accumulation pattern.
31
Figure 4.4: Species accumulation curve of parkland agroforestry species in five villages of the Amhara region, Ethiopia.
4.4.8 Species composition in parkland agroforestry systems
Non‐metric multidimensional scaling (NMDS) plot run with Bray‐Curtis dissimilarity matrix (final stress = 0.076) revealed that Kuyu and Mariamwuha grouped together, suggesting that they had relatively similar species composition, which was different from that at Addisalem, Shal and Sendeji (Figure 4.5). The latter two villages had more or less similar species composition, as shown by their partially overlapping ellipsoids, while Addisalem showed a species composition different from that in any other villages. The PERMANOVA performed on parkland agroforestry species indicated that villages were significantly dissimilar (F4, 54 = 20.2, P = 0.001) (Table 4.10). Moreover, village explained 60% of total variation (R‐square). Species like Croton macrostachyus, Vernonia auriculifera and Cordia africana were common between Mariamwuha and Kuyu villages (their ellipsoids overlapped around the centroids of the two villages), while Eucalyptus camaldulensis and Albizia gummifera were specific to Mariamwuha (they were far away from the centroids of the two villages).
32
Figure 4.5: Bray‐Curtis based non‐metric multidimensional scaling (NMDS) plot of parkland agroforestry species in all villages. Ellipsoids represent 95% confidence intervals for each village
Table 4.10: PERMANOVA analysis of variance of parkland agroforestry tree/shrub species
Source of variation Df SS MS F R2 P (>F)
Village 4 12.189 3.047 20.2 0.5994 0.001***
Residuals 54 8.146 0.150 0.4006
Total 58 20.33 1.00
33 4.5. Discussion
4.5.1. Species diversity in homegarden and parkland agroforestry
In our study, species richness found in the homegarden agroforestry system was higher than that reported in some studies previously conducted in Ethiopia: 82 plant species (58 woody and 24 herbaceous species) in the south‐eastern Rift Valley escarpment in the Gedeo zone (Mesele, 2013), 85 plant species in north‐west Amhara (Fentahun, 2008), 133 plant species in Arba minchi zuria (Belachew et al., 2006), 113 plant species in Sebeta‐Awas district of Oromia (Tefera et al., 2015), 64 woody species in Arisi Negele (Motuma, 2006), and 75 plant species in Dilla Zuriya districts of the Gedeo Zone (Melese and Daniel, 2015).
However, the species richness reported in this study was lower than that reported in southern Ethiopia: 258 plant species were recorded at Hawassa city (Reta, 2016), 224 plant species at Basketo and Kefa (Feleke, 2011), 214 at Loma and Gena Bosa districts of Dwaro zone (Mathewos et al., 2013), 198 at Sidama zone (Tesfaye, 2005), 165 at Gedeo zone (Solomon, 2011) and 159 species at Wolayta zone (Talemos et al., 2013). Species richness variation occured in homegarden agroforestry is likely due to differences in water availability, personal species preference and age of the agroforestry system (Aklilu and Mikrewongel, 2015; Tefera et al., 2015; Tesfaye, 2005). Shal had higher species richness than the other villages. This could be due to the fact that Shal farmers used irrigation for homegarden agroforestry system during the dry season (pers. obs.) which positively affected species richness. If the plant is taking enough water, nutrients can travel through the plant easily so that they can develop healthy root system and better tolerate drought. As to personal species preference, some farmers in Sendeji village experienced income generation through cultivation of many high value tree/shrub species satisfying their needs grown within fields. Addisalem village had lower species richness. This might be due to the fact that agroforestry was introduced recently in this village (pers. obs.). As such, age of the agroforestry system affects species richness positively: the older the homegarden agroforestry system, the more species richness is found (Coomes and Ban, 2004).
Studies carried out on tropical homegarden agroforestry systems around the globe showed a high to very high species richness, e.g. 151 plant species were found in Puebla state, central Mexico (Larios et al., 2013), 116 in Jharkhand state, Gumla district of India (Shukla et al., 2017), 110 in Gulmi and Palpa districts, West Nepal (Pokhrel et al., 2015), 348 in Agastheeswaram taluk of Kanyakumari district, India