Airports or Parks? the impact of fiscal competition on the composition of public expenditure
35
0
0
Testo completo
(2) EUI Working Paper RSCAS No. 2004/03 Hannes Winner, Airports or Parks? the impact of fiscal competition on the composition of public expenditure.
(3) The Robert Schuman Centre for Advanced Studies carries out disciplinary and interdisciplinary research in the areas of European integration and public policy in Europe. It hosts the annual European Forum. Details of this and the other research of the centre can be found on: http://www.iue.it/RSCAS/Research/. Research publications take the form of Working Papers, Policy Papers, Distinguished Lectures and books. Most of these are also available on the RSCAS website: http://www.iue.it/RSCAS/Publications/. The EUI and the RSCAS are not responsible for the opinion expressed by the author(s)..
(4) EUROPEAN UNIVERSITY INSTITUTE, FLORENCE ROBERT SCHUMAN CENTRE FOR ADVANCED STUDIES. Airports or Parks? the impact of fiscal competition on the composition of public expenditure HANNES WINNER. EUI Working Paper RSCAS No. 2004/03 BADIA FIESOLANA, SAN DOMENICO DI FIESOLE (FI).
(5) All rights reserved. No part of this publication may be reproduced, distributed or utilised in any form or by any means, electronic, mechanical, or otherwise, without the prior permission in writing from the Robert Schuman Centre for Advanced Studies. Download and print of the electronic edition for teaching or research non commercial use is permitted on fair use grounds—one readable copy per machine and one printed copy per page. Each copy should include the notice of copyright. Permission for quotation should be addressed directly to the author(s). See contact details at end of text. Source should be acknowledged. ISSN 1028-3625. © 2004 Hannes Winner Printed in Italy in June 2004 European University Institute Badia Fiesolana I – 50016 San Domenico di Fiesole (FI) Italy http://www.iue.it/RSCAS/publications/.
(6) Robert Schuman Centre for Advanced Studies European Forum The European Forum was set up by the High Council of the EUI in 1992 with the mission of bringing together at the Institute for a given academic year a group of experts, under the supervision of annual scientific director(s), for researching a specific topic primarily of a comparative and interdisciplinary nature. This Working Paper has been written in the context of the 2002-2003 European Forum programme on “Europe after globalisation: International regulatory competition and cooperation in an enlarging European Union” directed by Professor Claus-Dieter Ehlermann with Professor Gian Domenico Majone and Professor Claudio Radaelli as co-directors. The Forum examined three major themes, that is, ‘Explaining international regulatory competition’, ‘risk regulation in comparative perspective’, and ‘multi-level governance and regulation: the choice of governance level’. The European Forum Fellows’ projects covered several policy areas, such as financial regulation, the regulation of the public utilities, health and safety regulation, foodstuff regulation, international taxation, international trade, the interplay between labour market regulation and product regulation, company law, and competition policy. For further information: http://www.iue.it/RSCAS/Research/EuropeanForum/Index.shtml.
(7) Abstract This paper investigates whether fiscal competition affects the structure of public spending, where theory predicts a shift from redistributive public expenditure to public inputs. We set up a panel data model which accounts for the endogeneity of fiscal competition. Using data for 20 OECD countries and the time period 1970 to 1997, we find a significant impact of fiscal competition on the composition of public expenditure. This, in turn, is in line with recent theoretical work, and in particular with Keen and Marchand (1997). JEL classification: H2; H4; H7; C33. Keywords Fiscal competition; public expenditure; panel data econometrics.
(8)
(9) 1. Introduction. Fiscal competition forces governments to lower taxes on mobile bases and to provide public goods at inefficiently low levels. This fundamental result of theoretical work on tax competition dates back to Zodrow and Mieszkowski (1986) and Wilson (1986) (see, e.g., Wilson, 1999, for a comprehensive overview of subsequent contributions). With respect to public goods, Keen and Marchand (1997, henceforth ’KM’), have extended this analysis focusing on the composition of public expenditure. Accordingly, to attract international investors, governments tend to increase public inputs that directly affect the productivity of mobile capital (for instance, infrastructure or human capital investments). In contrast, expenditure items intended to benefit immobile residents, notably for social security and welfare, are underprovided. Consequently, fiscal competition between countries may induce a systematic shift from public goods to public inputs: ”Crudely put, ... fiscal competition leads to too many business centres and airports but not enough parks or libraries” (KM, p. 35). Despite of its sound theoretical foundation and apart from anecdotal evidence (subsidies for firm location may provide a familiar example), a systematic empirical analysis on the impact of fiscal competition on the structure of public spending is not available so far. Some authors, in a slightly different notion, have pointed on the nexus between ’globalization’ and the various dimensions of the welfare state. For instance, Rodrik (1998) has found that trade openness (i.e., imports plus exports to GDP) is positively associated with all components of public expenditure. He concluded: "Societies seem to demand (and receive) an expanded government role as the price for accepting larger doses of external risk." (Rodrik, 1998, p. 998). In other words, economic integration increases the risk of losing income which, in turn, raises the demand for publicly provided goods. However, trade openness is a rather vague measure of fiscal competition, and therefore Rodrik’s approach is less suited to analyze its structural effect on public activity. This paper analyzes the empirical relationship between fiscal competition and the pattern of public expenditure. In particular, we assess the predic-. EUI-WP RSCAS No. 2004/03 © 2004 Hannes Winner. 1.
(10) Hannes Winner. tions of KM utilizing a data set of 20 OECD countries and the time period 1970 to 1997. We extend the prior empirical research in several directions. First, we disaggregate total government expenditure into components that are attributable to public goods and public inputs and estimate the impact of fiscal competition on each of these categories, with the specification based on the theory of public sector growth. Second, since fiscal competition (and, from a country’s perspective, its outcome, i.e. tax revenue) is by definition connected with public expenditure via the government’s budget constraint, we treat fiscal competition as endogenous in our empirical analysis. This demands for an instrumental variable (IV or 2SLS) approach, where the instruments reflect the most important determinants of tax competition as motivated by the theoretical literature. Third, we provide a tax-oriented measure of fiscal competition based on the calculation of average effective capital tax burdens. We demonstrate that our specification is robust against alternative tax burden measures. The remaining proceeds as follows. Section 2 describes the basic intuition behind KM’s findings. Section 3 motivates our econometric model and discusses the most important issues of estimation. Section 4 presents the empirical results and some robustness checks. Finally, Section 5 concludes.. 2. Theoretical Background. KM adopt the theoretical framework of Zodrow and Mieszkowski (1986) with a large number of identical and independent jurisdictions using their fiscal instruments strategically to attract mobile factors. The world capital stock is fixed and perfectly mobile across countries. Fully competitive firms produce a homogeneous output using capital and immobile factors (labour, land). The household sector is given by a representative consumer, who supplies the production factors and is immobile across countries. Governments provide public goods for consumers or firms. Finally, governments are benevolent and finance a fixed amount of public expenditure by source based taxes on capital, labour and pure profits (i.e., land rents). In this setting, a reduction of capital tax rates is (by assumption) asso-. 2. EUI-WP RSCAS No. 2004/03 © 2004 Hannes Winner.
(11) Airports or Parks? the impact of fiscal competition on the composition of public expenditure. ciated with an immediate inflow of capital and therefore an increase of the domestic capital tax base. In contrast, other regions are faced with capital outflows and shrinking (capital) tax revenues. Since the government’s objective is to maximize the welfare of its residents, it fails to account for these ’fiscal externalities’ (see Wildasin, 1989), and therefore to reduce the capital tax rate is the dominant strategy in this ’tax game’. In the (Nash-) equilibrium capital taxes rates are driven down, and — to maintain a balanced budget — governments tend to decrease the provision of public goods, i.e. public expenditure (see Zodrow and Mieszkowski, 1986; Hoyt, 1991, for similar results). If governments try to attract capital using public inputs rather than capital taxes it can be shown that public goods are overprovided in the equilibrium (see Fuest, 1995; Bayindir-Upmann, 1998). KM have extended these studies by analyzing simultaneously the setting of tax rates and the provision of public goods. Thereby, they focus on the mix between two types of public spending, given a specific level of total public expenditure: (i) public goods that enter only the utility function of (immobile) households, notably public consumption items (e.g. benefits for unemployed, disabled or ’aged’ persons), and (ii) public inputs that enter the production function, such as infrastructure or educational services. KM use of a broad definition of public inputs: Public inputs are not ”... simply the provision of private goods targeted to particular firms but, more widely, the provision of inputs with a real element of publicness: not a feeder road to a new port, for example, but a national highway network.” (KM, p. 34). Further, some expenditure items have both a productive and consumptive component (see KM: footnote 3). This becomes important in the empirical assessment of KM and is therefore also addressed here (for details see below). Considering these two types of public expenditure, KM have proved a ’compositional inefficiency’: ”[W]ithin the total of public spending, too much is spent on public inputs and too little on items that directly benefit consumers.” (KM, p. 46). Intuitively, governments try to attract mobile capital not only by reducing capital tax rates but also by providing additional public inputs. On the other hand, public goods are bounded to immobile factors, and therefore governments are able to lower public goods provision without. EUI-WP RSCAS No. 2004/03 © 2004 Hannes Winner. 3.
(12) Hannes Winner. running at risk of firm or workforce de-location, i.e. revenue losses.1 Further, a unilateral change of the expenditure structure from public goods to public inputs creates a capital inflow and (by assumption) a corresponding capital outflow from other countries. This, in turn, induces three types of externalities on other countries: (i) a decrease of tax revenue from mobile capital (which is in line with Zodrow and Mieszkowski, 1986);2 (ii) falling rents, which lowers the revenue of land taxes; and (iii) a decline of (gross and net) wage rates and labour supply with corresponding revenue losses from both labour and land taxation. KM demonstrate that under certain assumptions each of these externalities is negative. Hence, the compositional effect is associated with a welfare loss in other countries.3. 3. The Empirical Model. We test KM’s finding of a compositional effect by regressing subgroups of total public expenditure on a variable of fiscal competition. To isolate the impact of fiscal competition, we follow the related empirical literature and control for determinants that are typically used to explain public expenditure growth (see below). Public expenditure: We decompose total government spending according to its main functional categories (’divisions’) as defined by the Systems of National Accounts (SNA93).4 We rely on five divisions: (i) (General) economic services (ECSERV) and (ii) a subdivision of it, transport and communication (TRANSP), (iii) Education (EDUC), (iv) Health (HEALTH), and (v) Social Security and Welfare (SOCIAL). The latter category includes, for instance, allowances for families and children and benefits for unemployed or old aged persons, but excludes public health expenditure. As exemplified by KM, (i) 1. In a somewhat different line of reasoning, there is a considerable body of theoretical literature that suggests a sound confirmation of KM´s result concerning social expenditure (see Cremer et al., 1997; for a comprehensive survey). 2 An important prerequisite for this externality is the presence of a positive capital tax rate before fiscal competition takes place. 3 Matsumoto (2000) has demonstrated that this result does not hold if residents are mobile. 4 We do not refer to the current COFOG definitions, since they apply data for a shorter time period (back to 1995). For details see IMF (2001), pp. 75.. 4. EUI-WP RSCAS No. 2004/03 © 2004 Hannes Winner.
(13) Airports or Parks? the impact of fiscal competition on the composition of public expenditure. and (ii) can be clearly assigned to public inputs and (v) to public goods. In contrast, education (iii) is not clearly attributable to one of the expenditure items, and similar holds for health expenditure (iv). If labour is completely immobile, as is assumed in the KM model, education and health increase the productivity of labour and are, in this sense, public inputs in production. However, if labour is mobile, education and (to a lesser extent) health can be consumed in one country with the human capital supplied elsewhere. In this case, both divisions are consumptive and should be better assigned to public goods. From the perspective of an international investor, it may be presumed that public health and education tend to improve a country’s locational attractiveness; for instance, multinational firms may locate their production activities where medical care, health prevention or rehabilitation facilities for employees are well established. On the other hand, a more healthy and well educated labour force is more expensive in terms of factor compensation, which may hamper international (inward) investment. Theoretically, we conclude that educational and health expenditure may have both productive and consumptive components and therefore the effect of tax competition on this expenditure items remains ambiguous.5 The remainder categories are excluded, e.g. public order (few observations), defense, housing and community amenities (few observations), culture and religion, or interest on debt. Fiscal Competition: Standard tax competition theory suggests that the international capital tax rate differential should be zero in the (Nash-) equilibrium. Accordingly, a country is forced to lower its capital tax rate when other countries adopt an undercutting strategy. From a country’s perspective, the higher the capital tax rate differential to a low tax country the higher is the pressure to engage in tax competition. We follow this line of reasoning and calculate τ it − τ min jt , (1) Θit = τ¯·t where τ it is the capital tax rate of country i at time t, τ min jt is the minimum 5 In the (empirical) growth literature both health and educational expenditure are treated as public inputs. See Devarajan et al. (1996) and Kneller et al. (1999).. EUI-WP RSCAS No. 2004/03 © 2004 Hannes Winner. 5.
(14) Hannes Winner. capital tax rate of all other j countries, and τ¯·t is the overall average tax rate. Following our above reasoning, the nominator in (1) informs about the pressure to lower capital tax rates. The denominator points to the overall movement of capital tax rates in the sample. For instance, descriptive studies have found that (effective) capital tax rates have declined since the late 70´s (see, e.g., Devereux et al., 2002; Slemrod, 2002). This evidence is usually seen as a faint sign for tax competition. Note that, from a country’s perspective, a high value of Θ indicates a higher pressure to lower its capital tax rates. To account for the argument that tax competition may be more pronounced in the European Union (EU), we calculate Θit for the 15 EU member countries and the rest of the world.6 For τ we apply effective capital tax rates. This accounts for the widely held belief that countries not only compete with statutory tax rates but also with ingredients of the tax base, such as depreciation allowances, tax credits, etc. In particular, we calculate average effective tax rates (AETR) as developed by Mendoza et al. (1994). The AETR on capital is defined as the ratio of the actual revenue of capital taxes (including corporate income taxes) and the relevant tax base, i.e. profits and capital gains of private and incorporated firms (see the Appendix B for further details).7 At this point, one might insist that the extent, to which countries are exposed to tax competition, is not equal for all economies. Empirically, this is accounted for by our IV-approach (i.e., treating fiscal competition as endogenous), where the choice of the instruments is motivated by tax competition theory (see below for econometric details). Specifically, we incorporate three fundamental insights of theoretical research: (i) Capital mo6. Alternatively, we relate a country’s tax rate (τ it ) to the minimum tax rate of its (geographical) neigbors. It turns out that our results are essentially unaffected by this re-parametrization. 7 There is a controversial discussion about the ’suitable’ measure of effective tax burden (see Fullerton, 1984; recently Devereux et al., 2002). We have two remarks on this: (i) Empirical research has shown that these measures yield different tax levels but come to similar results with respect to their country ratings (recently Devereux et al., 2002; and Slemrod, 2001, for corporate taxes). (ii) Empirically, we account for the possibility of measurement errors by the IV specification; it turns out that alternative measures come to similar conclusions with respect to our relationship of interest. We will come back to this issue below.. 6. EUI-WP RSCAS No. 2004/03 © 2004 Hannes Winner.
(15) Airports or Parks? the impact of fiscal competition on the composition of public expenditure. bility (M) is an obvious candidate for an instrument, since ”... the comparison between tax competition and its absence is determined by whether capital is mobile across regions” (Wilson and Wildasin, 2002, p. 6). Following the related empirical research we measure capital mobility by the correlation between national investment and the national saving rate (see Feldstein and Horioka, 1980). To obtain time-series-cross-sections data for the saving-investment-correlation we use the current account (CA) equation, i.e. CA ≡ Y − (C P + I + C G ) ≡ S − I, and define capital mobility as the absolute difference between saving and investment related to output, i.e. ´ ³ |S−I| , where S is national saving, I is national investment, Y is Mit = Y it. GDP, and C P (C G ) is private (government) consumption (see Winner, 2003, for a detailed discussion). (ii) Country size (L) accounts for the distinction between small and large open economies: The former have no influence on the world interest rate and, therefore, are faced with a fully elastic capital tax base. Thus, countries have incentives to lower their capital tax rates as they directly gain via additional capital inflows. Since other countries follow this strategy, tax competition yields a ’race to the bottom’ (see Gordon, 1986; Razin and Sadka, 1991). Large countries, in contrast, are assumed to affect the world interest rate by their tax policy, which is accompanied by a less elastic capital tax base. This, in turn, allows them to levy higher taxes even on mobile capital. Consequently, if small and large open economies compete for mobile tax bases, smaller countries tend to set lower capital tax rates than larger ones (e.g. Bucovetsky and Wilson, 1991; Wilson, 1991). L is measured by the relative population size of a country.8 (iii) Recent theoretical research suggests that tax competition may have different consequences depending on the geographical location of countries (see, Andersson and Forslid, 1999; Haufler and Wooton, 1999, 2001; Ludema and Wooton, 2000; Kind et al., 2000; Baldwin and Krugman, 2003). Intuitively, transport cost may outweigh international tax rate differentials. Consequently, countries that are located close to market centres have more pressure to set lower tax rates. Further, economic integration, and to a lesser extent fiscal competition, entails a re8. We prefer this measure over a GDP based one since it is more consistent with tax competition theory that distinguishes the size of a country by its population size. Further, GDP is an important control variable in our study (see below). Empirically, given a correlation coefficient of 0.95, it makes not a real difference which size measure is used.. EUI-WP RSCAS No. 2004/03 © 2004 Hannes Winner. 7.
(16) Hannes Winner. duction of transportation cost and forces peripheral countries to keep capital tax rates low. This line of reasoning is also accounted for in our empirical study using distance from the partner countries as a proxy for transport cost (e.g. Baldwin, 1994).9 Other controls: Although there is no single and unified attested theory of public expenditure growth, we include three determinants that are widely accepted in the literature (see, e.g., Gemmell, 1993; and Tanzi and Schuknecht, 2000, for comprehensive reviews): First, GDP exhibits the state of economic development and to some extent captures ’Wagner’s Law’ of increasing government activity, stressing the growing importance of public activity in times of social and economic prosperity (see, Holsey and Borcherding, 1997, for an overview). This literature predicts that GDP is positively associated with social security and educational expenditure, and negatively with economic services (see below for further discussion). With respect to (public) health expenditure, theory does not provide a definitive answer on this relationship (see, e.g., Blomqvist and Carter, 1997; Gerdtham and Jönnson, 2000). Second, we consider demographic factors to account for scale economies in the provision of public goods. In this respect, Borcherding (1985) has shown that the age structure rather than the size of population is decisive for the level of public expenditure. Thus, we include the dependency ratio, defined as the ratio of younger (less than 15) plus older people (above 64) to the working-age population (from 15 to 64). Standard economic reasoning suggests that consumptive public goods (e.g. expenditure on social security or retirement programs) are relatively more requested in later stages of life, i.e. by older people; younger generations, in contrast, have a higher demand for public inputs (e.g. educational services). The effect of dependency would then be positive for public goods and negative for public inputs. Third, the urbanization rate is the share of population living in urban areas, and points to the importance of agglomeration effects for most public expenditure items, notably for social security and health expenditure (see Gemmell, 9. We adopt a remoteness variable R, defined as the population weighted greater circle S Njt dij j distance from the world’s most important markets, i.e. Rit = S Njt , where Njt denotes j the population of country j at time t, and dij is the outer circle distance between country i and j (see Egger, 2000, for further details).. 8. EUI-WP RSCAS No. 2004/03 © 2004 Hannes Winner.
(17) Airports or Parks? the impact of fiscal competition on the composition of public expenditure. 1993; Gerdtham and Jönnson, 2000). Basically, a negative sign indicates some economies of scale in providing public goods/inputs to more densely populated areas (see Oates 1985). Other determinants typically used to explain government growth, notably institutional ones (e.g. the influence of interest groups and bureaucrats, or the extent and structure of a country’s federalism; see Holsey and Borcherding, 1997), are not yet considered here as they are usually time-invariant and, therefore, accounted for by the country specific effects (see below). Specification: We estimate the impact of fiscal competition on the structure of public expenditure in a fixed effects framework (see Baltagi, 2001, for further details). To isolate this effect, we control for the most important determinants of government expenditure as outlined before: Ghit = β 1 Θit + β 2 Yit + β 3 Dit + β 4 Uit + αi + uit ,. (2). where Ghit denotes government expenditure to GDP for country i in year t and the division h (i.e., SOCIAL, HEALTH, EDUC, ECSERV and TRANSP, respectively). Θ is our tax competition variable as discussed above. Y is GDP (in terms of 1995 US$), D is the dependency ratio, and U is the urbanization rate. G, Θ, Y, D and U are denoted in logarithms. αi represents (unobserved) individual effects that do not vary over time, for instance political determinants or a country’s degree of centralization. uit is the classical remainder error term. Estimation: Since Θ is treated as endogenous in (2) we apply a fixedeffects IV estimation (or FE2SLS) procedure (for details see Baltagi, 2001, b of the reduced form (first-stage) fixedpp. 112), where the fitted values Θ effects regression, Θit = δ 1 Mit + δ 2 Lit + δ 3 Rit + δ 4 Yit + δ 5 Dit + δ 6 Uit + αi +. it ,. (3). are inserted for Θ in the second-stage regression (2). The standard errors are calculated from the FE2SLS residuals (for details see Wooldridge, 2002, pp.. EUI-WP RSCAS No. 2004/03 © 2004 Hannes Winner. 9.
(18) Hannes Winner. 83). M, L, and R are the instruments (i.e., strictly exogenous variables) denoting capital mobility, country size, and remoteness (transport cost). Again, all variables are in logarithms. A crucial point in IV estimation is the choice of the instruments, which in our context is motivated by tax competition theory. Empirically, instruments (i) should be relevant, i.e. correlated with the endogenous regressor, and (ii) should be uncorrelated (i.e., orthogonal) with the error term uit . We test (i) with a standard F-test on the significance of the (excluded) instruments in the first-stage regression (2), and (ii) with the Wu-Hausman F -test for endogeneity (see Davidson and MacKinnon, 1993). A remaining problem is heteroskedasdicity. If the error term is heteroskedastic, the standard errors of IV estimation are inconsistent and the diagnostic tests for endogeneity are invalid. We test the presence of heteroskedasticity with a modified Breusch-Pagan test as developed by Pagan and Hall (1983). In the presence of heteroskedasticity we apply a (standard) GMM estimator.10 It should be emphasized that GMM is efficient even in the presence of heteroskedasticity (of unknown form). Note that the IV estimates are neither biased nor inconsistent. Therefore, we only find small differences between the GMM and IV parameter estimates. In the context of GMM, we test whether the instruments are (jointly) uncorrelated with the error term using the J-statistic of Hansen (1982). A rejection of the J-test indicates that the instruments (jointly) are not satisfying the orthogonality condition. 0 0 −1 0 b The GMM estimator is given by β X ZW Z 0 y, where X are GMM = (X ZW Z X) the regressors in (2) (including the endogenous regressor Θ), Z are the instruments in (3) (including the control variables and the fixed effects), and W is a weighting matrix. As usual, the optimal weighting matrix is given by the inverse of the covariance matrix of the moment conditions Q = n1 E(Z 0 uu0 Z) = n1 E(Z 0 ΩZ), where n is the number of observations (see Hansen, 1982; Wooldridge, 2002, for details). The consistent estimator b b is a block diagonal matrix with typical element Σ b k , where b = 1 (Z 0 ΩZ). Ω of Q is Q n 0 b bk u bk ; u bk is a row vector with length T (with T = 1, 2, ..., t), and is obtained Σk ≡ u by using the IV residuals. This gives the feasible efficient (two-step) GMM estimator 0 −1 0 b Z X)−1 X 0 ZQ−1 Z 0 y (see Hayahsi 2000, pp. 212; and Wooldridge β EGMM = (X ZQ 2002, p. 193, for GMM in the panel data context). 10. 10. EUI-WP RSCAS No. 2004/03 © 2004 Hannes Winner.
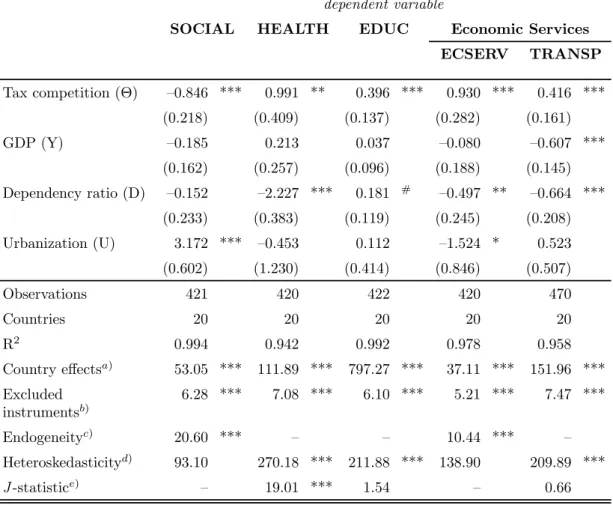
(19) Airports or Parks? the impact of fiscal competition on the composition of public expenditure. 4. Estimation Results. The data set is unbalanced, where the length of the time series varies considerably across countries.11 In sum, we come up with about 470 observations (see the Appendix A for descriptive statistics). Before discussing our main findings we briefly take a look on the impact of fiscal competition on total public expenditure. The estimation result for an outlier corrected sample (see below) is (fixed effects are not reported; s.e. in parentheses). Git = 12.919 — 0.420Θit — 0.366Yit — 1.272Dit + 1.712Uit (2.855) (0.124) (0.097) (0.150) (0.326). N = 450, F(19,426)= 137.70, F(3,424)=6.81, F (1, 425)=9.88, R2 = 0.998. Most important, the coefficient on Θ is significantly negative, which confirms the findings of Zodrow and Mieszkowski (1986), i.e. a negative relationship between fiscal competition and total public expenditure. The control variables are significant, and the sign of the parameters are in line with previous results (see, e.g., Gemmell, 1993). The F-Test for the inclusion of the instruments (in the first-stage regression) (F=6.81) suggests that the choice of the instruments is valid. Further, the Wu-Hausman F -statistic equals 9.88, which let us clearly reject the null that OLS on (2) is consistent. This, in turn, justifies our IV approach. The results for the compositional effect of fiscal competition are reported in Table 1. The model fit is well, and the F-Test on the excluded instruments suggests that the choice of the instruments (capital mobility, country size and transport cost) is valid. Further, the Wu-Hausman F -statistic for endogeneity is significant, which makes our FE2SLS procedure a reasonable 11. The sample includes Australia, Austria, Belgium, Canada, Denmark, Finland, France, Germany, Greece, Ireland, Italy, Iceland, Luxembourg, the Netherlands, Norway, Spain, Sweden, Switzerland, UK and USA. Japan, New Zealand and Portugal are dropped due to missing or too few observations on all expenditure items. The average time period per cross-section is about 23.. EUI-WP RSCAS No. 2004/03 © 2004 Hannes Winner. 11.
(20) Hannes Winner. Table 1: Estimation Results dependent variable SOCIAL. Tax competition (Θ). —0.563 **. HEALTH. 1.845 ***. 0.073. 0.381. (0.163). (0.456). TRANSP. 0.668 **. 0.708 ***. —0.102. —0.503 ***. (0.144). (0.186). (0.180). 0.252. —0.185. —0.852 ***. (0.645). (0.207). (0.268). (0.259). —1.588. —0.598. —0.661. —0.250. (0.603). (1.691). (0.534). (0.689). (0.668). 469. 468. 470. 468. 470. 20. 20. 20. 20. 20. 0.992. 0.785. 0.974. 0.970. 0.897. 51.87 ***. 45.10 ***. 294.29 ***. 28.83 ***. 70.46 ***. Excluded instrumentsb). 5.59 ***. 5.59 ***. 5.68 ***. 5.66 ***. 5.68 ***. Endogeneityc). 9.47 ***. 11.45 ***. 4.79 **. 8.70 ***. 8.70 ***. 0.213 (0.230). Urbanization (U) Observations Countries 2. R. Country effects. a). Heteroskedasticityd). 2.671 ***. 126.50. —3.031 ***. 161.09. (0.201). ECSERV. (0.252). Dependency ratio (D). (0.633). 0.536 ***. Economic Services. (0.260). GDP (Y). (0.226). EDUC. 0.238 *. 162.85. 155.29. 155.09. Notes: IV-estimates; country effects not reported. a) F(19,445) in SOCIAL, F(19,446) in EDUC and TRANSP, F(19,444) in HEALTH and ECSERV. b) F(3,443) in SOCIAL, F(3,444) in EDUC and TRANSP, F(3,442) in HEALTH and ECSERV. c) Wu-Hausman F -statistic (H0 : regressor is exogenous (i.e., OLS is consistent and efficient)); F(1,444) in SOCIAL, F(1,445) in EDUC and TRANSP, F(1,443) in HEALTH and ECSERV. d) Pagan and Hall (1983) test for heteroskedasticity (H0 : no heteroskedasticity); χ2 (159) in all models. *** significant at 1%, ** significant at 5%, * significant at 10% (two-sided).. choice. Finally, the Pagan-Hall statistic (last line of Table 1) does not reject the assumption of a homoskedastic error term, which indicates that the standard errors are consistent and the specification tests are valid. In general, we are able to confirm KM’s hypothesis of a compositional effect. This is shown in the first row of Table 1: Fiscal competition exhibits a significant negative impact on public goods, i.e. expenditure for social secur-. 12. EUI-WP RSCAS No. 2004/03 © 2004 Hannes Winner.
(21) Airports or Parks? the impact of fiscal competition on the composition of public expenditure. ity and welfare (SOCIAL), and a positive one for the remaining expenditure items. For general economic services we find a significant positive impact of fiscal competition. Note that this item includes a wide variety of public spending categories, covering expenditure items that benefit mobile (e.g. roads, transport and communication) as well as immobile factors (such as agriculture, forestry, fishing or mining). Thus, to clarify our main argument we estimate equation (2) for a sub-division of economic services, transport and communication (TRANSP), which in the spirit of KM should be clearly attributable to public inputs. The results of this regression indicate that fiscal competition has a significant and positive impact on this expenditure item (see Table 1). The coefficients on educational and health expenditure are positive, which — in line with KM — suggests that both expenditure items are public inputs. In the case of health expenditure, however, the parameter estimates of the control variables are not clearly in line with the existing evidence from health economics, especially for the dependency ratio. Empirical studies suggest a positive income elasticity (in some cases exceeding one) for GDP, and — compared to our Table 1 — a much lower impact of dependency (see, e.g., Gerdtham and Jönnson, 2000). The reason for this divergence might be that health related studies typically include health-specific variables, such as the number of physicians, cost-related factors (e.g., the number of hospital beds), or the technical progress in the health sector.12 In sum, even though the coefficient of tax competition is positive (as predicted) and significant, the fit for health expenditure is left in doubt. GDP is insignificant for social security, health and (general) economic services.13 In line with the empirical research on public sector growth, we 12. Further, these studies refer to the total (public and private) health expenditure. The estimates range from 0.1 to 1.3 for GDP, from —0.1 to 0.2 for the dependency ratio and from —0.2 to 0.3 for the urbanization rate (see Gerdtham and Jönnson, 2000, p. 28, Table 3). 13 The correlation coefficient between real GDP and (population based) country size is around 0.5, which may cause collinearity in the first-stage regression. This, in turn, might explain the insignificance of the GDP parameter in the second-stage regression. However, adopting nominal GDP instead (the correlation coefficient here is —0.1), does not change the parameter estimates in Table 1 except for GDP, for which we obtain slightly lower estimates and significance in all regressions.. EUI-WP RSCAS No. 2004/03 © 2004 Hannes Winner. 13.
(22) Hannes Winner. find a significantly negative effect on economic services (i.e., TRANSP). A common explanation is that public investment is relatively high at low stages of development but decreases thereafter. As GDP increases private investment substitutes the public provision of economic services (telecommunication networks may serve as a familiar example). This, in turn, reduces the government share on total investment (see Gemmell, 1993, p. 107). In the case of consumptive public goods (e.g. welfare benefits) governments tend to expand expenditure with increasing income. Thus, if national income increases we would observe a change in the structure of public spending from public inputs to public goods, and this is exactly what we find. The dependency ratio is positively related to public goods and negatively to public inputs, as expected. Apart from economic services, we find a similar pattern for the urbanization rate, although the coefficients are significant only in one out of five cases. A striking feature of Table 1 is the relatively large coefficient on the urbanization rate. However, most of the total variation (97.3%) comes from the cross-country (between) variation rather than the time (within) variation, and this makes our point estimates quite reasonable. Robustness: We undertake several robustness checks. First, we examine the sensitivity of our results with respect to single outliers. Specifically, we exclude all observations with a remainder error in the upper or lower end 5 percentile range (in sum, about 45 observations or about 10% of the sample). The results are displayed in Table 2. The model fit has slightly improved throughout, especially for health expenditure. Now we find heteroskedasticity in three cases (for HEALTH, EDUC and TRANSP), and therefore we report the GMM estimates for these expenditure items (the corresponding J-statistic, which indicates whether the overidentiying restrictions are valid, is reported in the last line). From a substantive perspective, we obtain almost identical results as in Table 1. The elasticity of tax competition is around 0.85 (and negative) for public goods and ranges from 0.4 (EDUC and TRANSP) to 1.0 (HEALTH) for public inputs. Note the significance of the J-statistic in the health regression, which indicates that the overidentifying restrictions are not valid in this case. This, again, let us conclude that we should interpret these results cautiously.. 14. EUI-WP RSCAS No. 2004/03 © 2004 Hannes Winner.
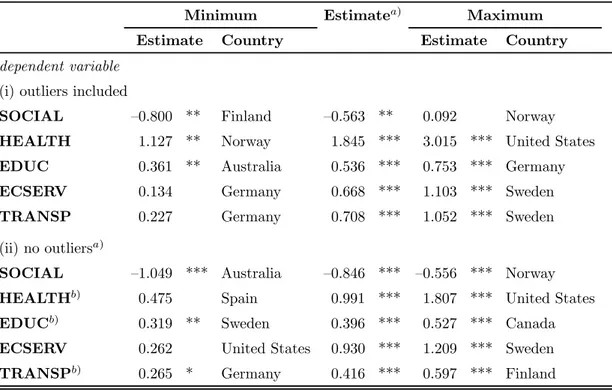
(23) Airports or Parks? the impact of fiscal competition on the composition of public expenditure. Table 2: Outlier Analysis dependent variable SOCIAL. HEALTH. EDUC. Economic Services ECSERV. Tax competition (Θ) GDP (Y) Dependency ratio (D) Urbanization (U) Observations Countries 2. R. a). —0.846 ***. 0.991 **. 0.396 ***. 0.930 ***. TRANSP 0.416 ***. (0.218). (0.409). (0.137). (0.282). (0.161). —0.185. 0.213. 0.037. —0.080. —0.607 ***. (0.162). (0.257). (0.096). (0.188). (0.145). —0.497 **. —0.664 ***. (0.245). (0.208). —0.152. —2.227 ***. (0.233). (0.383). (0.119). —0.453. 0.112. (0.602). (1.230). (0.414). (0.846). (0.507). 421. 420. 422. 420. 470. 20. 20. 20. 20. 20. 0.994. 0.942. 0.992. 0.978. 0.958. 3.172 ***. 0.181. #. —1.524 *. 0.523. 53.05 ***. 111.89 ***. 797.27 ***. 37.11 ***. 151.96 ***. Excluded instrumentsb). 6.28 ***. 7.08 ***. 6.10 ***. 5.21 ***. 7.47 ***. Endogeneityc). 20.60 ***. Heteroskedasticityd). Country effects. e). J -statistic. —. —. 93.10. 270.18 ***. 211.88 ***. —. 19.01 ***. 1.54. 10.44 *** 138.90 —. — 209.89 *** 0.66. Notes: IV and GMM estimates; country effects not reported; observations with errors within the 95% and the 5% percentile are excluded. a) F(19,397) in SOCIAL, F(19,398) in EDUC and TRANSP, F(19,396) in HEALTH and ECSERV. b) F(3,395) in SOCIAL, F(3,396) in EDUC and TRANSP, F(3,394) in HEALTH and ECSERV. c) Wu-Hausman F -statistic (H0 : regressor is exogenous (i.e., OLS is consistent and efficient)); F(1,396) in SOCIAL, F(1,395) in ECSERV. d) Pagan and Hall (1983) test for heteroskedasticity (H0 : no herteroskedasticity); χ2 (159) in all models. e) Hansen (1982) J-test for overidentifying restrictions; χ2 (2) in all models. *** significant at 1%, ** significant at 5%, * significant at 10%, # significant at 15% (two-sided).. Second, we apply a jackknife analysis (see Efron and Tibshirani, 1993) on equation (2) to identify the most influential countries with respect to maximum changes in the coefficients of our tax competition variable. As is shown in Table 3, the minimum values are driven by the exclusion of Aus-. EUI-WP RSCAS No. 2004/03 © 2004 Hannes Winner. 15.
(24) Hannes Winner. tralia, Finland, Germany and Norway, whereas the maximum values are due to Germany, Norway, Sweden and the United States. The lower part of Table 3 reports the Jackknife-results for the outlier corrected sample. In general, it differs from the previous results by exerting slightly lower differences between the minimum and maximum values. Now, the minimum (maximum) values are driven by the exclusion of Australia, Germany, Spain, Sweden and the United States (Canada, Finland, Norway, Sweden and the United States). Most important, nearly none of the coefficients change its sign and loses its significance in both samples and the point estimates lie in the middle of the extreme bounds. Thus, our specification seems to be fairly robust against single cross-sectional outliers. Table 3: Jackknife Analysis Estimatea). Minimum Estimate. Country. Maximum Estimate. Country. 0.092. Norway. dependent variable (i) outliers included SOCIAL. —0.800 **. Finland. —0.563 **. HEALTH. 1.127 **. Norway. 1.845 ***. 3.015 *** United States. EDUC. 0.361 **. Australia. 0.536 ***. 0.753 *** Germany. ECSERV. 0.134. Germany. 0.668 ***. 1.103 *** Sweden. TRANSP. 0.227. Germany. 0.708 ***. 1.052 *** Sweden. (ii) no outliersa) —1.049 *** Australia. SOCIAL b). —0.846 *** —0.556 *** Norway. HEALTH. 0.475. Spain. 0.991 ***. 1.807 *** United States. EDUCb). 0.319 **. Sweden. 0.396 ***. 0.527 *** Canada. 0.262. United States. 0.930 ***. 1.209 *** Sweden. 0.265 *. Germany. 0.416 ***. 0.597 *** Finland. ECSERV b). TRANSP. Notes: Control variables and country effects not reported. *** significant at 1%, ** significant at 5%, * significant at 10% (two-sided). a) observations with errors within the 95% and the 5% percentile are excluded. b) GMM-estimates.. Finally, one might insist that our findings are driven by the AETR-based definition of tax burden τ in (1). Therefore, we re-estimate our model using. 16. EUI-WP RSCAS No. 2004/03 © 2004 Hannes Winner.
(25) Airports or Parks? the impact of fiscal competition on the composition of public expenditure. statutory corporate tax rates (CTR) rather than AETR, where the analysis points to the outlier-corrected estimates reported in Table 2. For reasons of comparison we rely on the same sample for both variables (20 countries and the time period 1980 to 1997, i.e. about 300 observations), and this changes the parameter estimates of Table 2 slightly. The results are presented in Table 4. Since the (efficient) GMM estimator may have poor small sample properties (see, e.g., Hayashi 2000, p. 215) we only report the IV-estimates here. First, our AETR based estimates are close to that reported in Table 2 and are supportive for the prediction of KM. It should be noted, however, that the sample size is much lower now, and therefore the parameter estimates may be less reliable (the average time period per country amounts to about 15). Most strikingly, there are only minor differences between the two measures of τ , even though we are left with a loss in significance. Given the correlation coefficient between both variables of 0.09 this result is quite remarkable (the correlation coefficient between the corresponding Θ’s is —0.02). We only observe a significant change in the sign of the parameter estimate in the case of educational expenditure. Re-estimating with a much smaller country sample, but now including effective marginal (EMTR) and average (EATR) tax rates on corporate profits, leaves this conclusion almost unaffected. This is shown in the lower part of Table 4.14 Recall, that the sample size is rather small (the average time period is 10 years), and therefore the point estimates may be less reliable as before. However, the similarity of the estimates points to our main argument: The IV specification is more or less robust with respect to the choice of the measurement of tax burden underlying the fiscal competition variable.15 Again, with respect to KM’s compositional effect we generally find a positive impact of fiscal competition on social security and 14. The data are published in Devereux et al. (2002), covering 16 countries (13 EU member states excluding Denmark and Luxembourg plus Canada, Japan and the United States) and the time period 1982 to 2001. EMTR are based on the calculation of a firm’s cost of capital for a hypothetical investment project (see King and Fullerton, 1984). EATR are the respective average tax rates on a firm’s total profits revealing the tax burden on economic rents (e.g. Devereux and Griffith, 1999). They represent an alternative to Mendoza et al. (1994) for measuring average tax burdens. The latter are usually referred to as ’implicit tax rates’. 15 The similar parameter estimates for EATR and EMTR are less surprising given a correlation coefficient of 0.88. The correlation coefficient between AETR and EATR (EMTR) amounts to —0.07 (—0.15), between CTR and EATR (EMTR) to 0.09 (—0.06).. EUI-WP RSCAS No. 2004/03 © 2004 Hannes Winner. 17.
(26) Hannes Winner. welfare expenditure and a negative one on expenditure for education, health and economic services (ECSERV and TRANSP). Table 4: Alternative definitions of τ (tax burden) dependent variable SOCIAL. HEALTH. EDUC. Economic Services ECSERV. TRANSP. (i) 20 countries, 1980-1997 Tax burden measure AETR CTR Observations. —0.720 *** 1.918 *** 0.046 305. 0.369 ***. 0.412 *. 0.412. —0.192 *** —0.096. 0.637 * —0.099. 305. 305. 305. 305. 5.103. 0.214. —0.034. 2.402. (ii) 16 countries, 1982-1997 Tax burden measure AETR. —0.842 **. CTR. —0.317 *** 0.903 ***. 0.229 ***. 0.378 **. 0.311 **. EATR. —0.362 *** 0.931 ***. 0.301 ***. 0.466 ***. 0.353 ***. EMTR. —0.253 *** 0.670 ***. 0.215 ***. 0.413 ***. 0.187 ***. Observations. 151. 142. 152. 143. 138. Notes: IV estimates; observations with errors within the 95% and the 5% percentile are excluded; control variables and country effects not reported. *** significant at 1%, ** significant at 5%, * significant at 10%. AETR ... Average effective tax rate (implicit capital tax ratio); CTR ... Statutory corporate tax rate; EATR ... Effective average tax rate on corporate profits; EMTR ... Effective marginal tax rate on corporate profits.. The estimation results from Table 4 suggest that it does not make a real difference which tax burden measure is used to analyze the impact of fiscal competition on the structure of public expenditure. The rationale for this finding is that the definition of the tax base, which is the main distinction between effective and statutory tax rates, is usually highly persistent and time invariant from a statistical point of view. Demeaning effective tax rates in the fixed-effects first-stage regression wipes out this information from the sample. Further, if the (theory-guided) instruments for tax competition are. 18. EUI-WP RSCAS No. 2004/03 © 2004 Hannes Winner.
(27) Airports or Parks? the impact of fiscal competition on the composition of public expenditure. valid, the attenuation bias due to measurement errors, i.e. the inappropriate choice of tax burden variables, should not appear. As this is apparently the case in our study (compare the test-statistics of the Wu-Hausman F -statistic and the Hansen J-statistic in Table 1 and 2) we conclude that the estimation results are rather insensitive with respect to the choice of the tax burden variable underlying our definition of fiscal competition. This again, is an attractive feature of our IV specification. Summing up, our results suggest that fiscal competition is (i) positively related to public inputs, and in particular on economic services (transport and communication) and education, and (ii) negatively associated with social security and welfare expenditure. These results clearly confirm the compositional effect of fiscal competition on public expenditure as stated by KM.. 5. Conclusions. This paper examines whether fiscal competition affects the composition of public expenditure. Theory suggests a shift from public goods to public inputs, where the former benefit immobile residents and the latter mobile production factors (see Keen and Marchand, 1997). Utilizing data for 20 OECD countries and the time period 1970 to 1997 we give supportive evidence for this prediction. In particular, we find a decline of expenditure for social security and welfare, and an increase on expenditure for education and economic services (especially for transport and communication). For public health expenditure we find a positive relationship, as expected, but the overall fit let us conclude to interpret this result cautiously. Empirically, we treat tax competition as endogenous and apply an instrumental variable approach. An important feature of this framework is that we observe more or less the same results irrespective of the measurement of capital tax burden. With respect to public spending on social security and welfare, our finding is at odds with existing evidence of a positive relationship between ’globalization’ and this expenditure item (see, e.g., Rodrik, 1998, with further reference). Fiscal competition may be seen as an important outcome of ’globalization’ and from this perspective it is surprising that our finding does. EUI-WP RSCAS No. 2004/03 © 2004 Hannes Winner. 19.
(28) Hannes Winner. not fit the prior research. We have two explanations for this: Empirically, the controversial results may be driven by divergent empirical specifications. In our context, we explicitly take account for the endogeneity of fiscal competition. As this has not been applied previously, we suspect that the above mentioned studies obtain biased estimates. From a substantive perspective, fiscal competition may in fact induce a downward pressure on government expenditure, especially for social security items, but this effect may be simply outweighed by other aspects of ’globalization’ not considered here. For instance, trade liberalization might induce a downward pressure on domestic wages and employment, especially for low-skilled workers (see, e.g., Wood, 1995). If governments try to absorb these effects by raising expenditure on social programmes, such as unemployment benefits or training subsidies, we would observe an increase of public expenditure that may overcompensate the negative impact of tax competition. In any case, giving a definitive answer needs to analyze explicitly the interaction between fiscal competition and other aspects of ’globalization’. We leave this task for future research.. Acknowledgements I am grateful to Peter Egger, Andreas Haufler, Michael Pfaffermayr, Gerald Pruckner, Rupert Sausgruber and participants in seminars at Innsbruck and the European University Institute, especially Claudio Radaelli and Giovanni Pica, for helpful comments and suggestions.. Hannes Winner, University of Innsbruck (Austria) and Robert Schuman Centre for Advanced Studies, European University Institute [email protected]. 20. EUI-WP RSCAS No. 2004/03 © 2004 Hannes Winner.
(29) Airports or Parks? the impact of fiscal competition on the composition of public expenditure. References [1] Andersson, F. and R. Forslid (1999), "Tax Competition and Economic Geography", CEPR Discussion Paper No. 2220, London [2] Baldwin, R. E. (1994), Towards an Integrated Europe, London: Centre of Economic Policy Research [3] Baldwin, R. E. and P. R. Krugman (2003), "Agglomeration, Integration and Tax Harmonization", European Economic Review, forthcoming [4] Baltagi, B.H.(2001), The Econometrics of Panel Data, 2nd ed., Chichester: John Wiley & Sons [5] Bayindir-Upmann, T. (1998), "Two Games of Interjursidictional Competition when Local Governments Provide Industrial Public Goods", International Tax and Public Finance 5, 471-487 [6] Blomqvist, Å.G. and R.A.L. Carter (1997), "Is Health Care Really a Luxury?", Journal of Health Economics 16, 207-229 [7] Borcherding, T.E. (1985), "The Causes of Government Expenditure Growth: A Survey of US Evidence", Journal of Public Economics 28, 359-382 [8] Bucovetsky, S. and J.D. Wilson (1991), "Tax Competition with Two Tax Instruments", Regional Science and Urban Economics 21, 333-350 [9] Cremer, H., V. Forgeaud, M. Leite-Monteiro, M. Marchand and P. Pestieau (1997), ”Mobility and Redistribution: A Survey”, Public Finance/Finances Publiques 51, 325-352 [10] Davidson, R. and J.G. MacKinnon (1993), Estimation and Inference in Econometrics, New York: Oxford University Press [11] Devarajan, S., V. Swaroop and H.-F. Zou (1996), "The Composition of Public Expenditure and Economic Growth", Journal of Monetary Economics 37, 313-344 [12] Devereux, M.P. and R. Griffith (1999), "The Taxation of Discrete Investment Choice", IFS Working Paper No. 98/16, London: Institute for Fiscal Studies [13] Devereux, M.P., R. Griffith and A. Klemm (2002), "Corporate Income Tax Reforms and International Tax Competition", Economic Policy 35, 450-495 [14] Efron, B. and R.J. Tibshirani (1993), An Introduction to the Bootstrap, New York: Chapman & Hall. EUI-WP RSCAS No. 2004/03 © 2004 Hannes Winner. 21.
(30) Hannes Winner. [15] Egger, P. (2000), "A Note on the Proper Econometric Specification of the Gravity Equation", Economics Letters 66, 25-31 [16] Feldstein, M. and C. Horioka (1980), ”Domestic Saving and International Capital Flows”, The Economic Journal 90, 314-329 [17] Fuest, C.(1995), "Interjurisdictional Competition and Public Expenditure: Is Tax Coordination Counterproductive?", Finanzarchiv 52, 478496 [18] Fullerton, D. (1984), "Which Effective Tax Rate", National Tax Journal 37, 23-41 [19] Gemmell, N. (1993), The Growth of the Public Sector. Theories and International Evidence, Aldershot: Edward Elgar [20] Gerdtham, U.-G. and B. Jönsson (2001), "International Comparisons of Health Expenditure: Theory, Data and Econometric Analysis", in A. Culyer und J.P. Newhouse (eds.), Handbook of Health Economics, Vol. 1, Amsterdam et al.: Elsevier Science Publishers, 11-53 [21] Gordon, R.H. (1986), ”Taxation of Investment and Savings in the World Economy", American Economic Review 76, 1086-1102 [22] Hansen, L. (1982), "Large Sample Properties of Generalized Method of Moments Estimators", Econometrica 50, 1029-1054 [23] Haufler, A. and I. Wooton (1999), "Country Size and Tax Competition For Foreign Direct Investment", Journal of Public Economics 71, 121139 [24] Haufler, A. and I. Wooton (2001), "Regional Tax Coordination and Foreign Direct Investment", CEPR Discussion Paper No. 3063, London [25] Hayashi, F.,2000, Econometrics, Princeton and Oxford: Princeton University Press [26] Holsey, C. and T. Borcherding (1997), "Why Does Government’s Share of National Income Grow? An Assessment of the Recent Literature on the U.S. Experience", in D. Mueller (ed.), Perspectives on Public Choice, Cambridge: Cambridge University Press, 562-589 [27] Hoyt, W.H. (1991), "Property Taxation, Nash Equilibrium, and Market Power", Journal of Urban Economics 30, 123-131 [28] IMF, 2001, Government Financial Statistics Manual, Washington DC: International Monetary Fund [29] Keen, M. and M. Marchand (1997), "Fiscal Competition and the Pattern of Public Spending", Journal of Public Economics 66, 33-53. 22. EUI-WP RSCAS No. 2004/03 © 2004 Hannes Winner.
(31) Airports or Parks? the impact of fiscal competition on the composition of public expenditure. [30] Kind, H.J., K.H. Midelfart Knarvik and G. Schjelderup (2000), "Competing for Capital in a ’Lumpy’ World", Journal of Public Economics 78, 253-274 [31] King, M.A. and D. Fullerton (1984), The Taxation of Income from Capital, Chicago et al.: MIT Press [32] Kneller, R., M. Bleaney and N. Gemmell (1999), Fiscal Policy and Growth: Evidence from OECD Countries, Journal of Public Economcis 74, 171-190 [33] Ludema, R.D. and I. Wooton (2000), "Economic Geography and the Fiscal Effects of Regional Integration", Journal of International Economics 52, 331-357 [34] Matsumoto, M. (2000), "A Note on the Composition of Public Expenditure under Capital Tax Competition", International Tax and Public Finance 7, 691-697 [35] Mendoza, E.G., A. Razin and L.L. Tesar (1994), "Effective Tax Rates in Macroeconomics: Cross Country Estimates of Tax Rates on Factor Income and Consumption", Journal of Monetary Economics 34, 297-323 [36] Oates, W.E. (1985), "Searching for Leviathan: An Empirical Analysis", American Economic Review 75, 748-V757 [37] Pagan, A.R. and D. Hall (1983), "Diagnostic Tests as Residual Analysis", Econometric Reviews 2, 159-218 [38] Razin, A. and E. Sadka (1991), "International Tax Competition and Gains from Tax Harmonization", Economics Letters 37, 69-76 [39] Rodrik, D. (1998), "Why Do More Open Economies Have Bigger Governments?", Journal Political Economy 106, 997-1032 [40] Slemrod, J. (2001), "Are Corporate Tax Rates, Or Countries, Converging?", Paper presented at the OTPR/IFS conference ’World Tax Competition’, May 24-25 2001, London, UK [41] Tanzi, V. and L. Schuknecht (2000), Public Spending in the 20th Century. A Global Perspective, Cambridge: Cambridge University Press [42] Volkerink, B. and J. de Haan (2001), Tax Ratios: A critical survey, OECD Tax Policy Studies No. 5, Paris [43] Wildasin, D.E. (1989), "Interjurisdictional Capital Mobility: Fiscal Externality and a Corrective Subsidy", Journal of Urban Economics 25, 193-212 [44] Wilson, J.D. (1986), "A Theory of Interregional Tax Competition", Journal of Urban Economics 19, 296-315. EUI-WP RSCAS No. 2004/03 © 2004 Hannes Winner. 23.
(32) Hannes Winner. [45] Wilson, J.D. (1991), "Tax Competition with Interregional Differences in Factor Endowments", Regional Science and Urban Economics 21, 423452 [46] Wilson, J.D. (1999), "Theories of Tax Competition", National Tax Journal 52, 269-304 [47] Wilson, J.D. and D.E. Wildasin (2002), "Tax Competition: Bane or Boon?", Journal of Public Economics, forthcoming [48] Winner, H. (2003), Has Tax Competition Emerged in OECD Countries? Evidence from Panel Data, mimeo [49] Wood, A. (1995), "How Trade Hurt Unskilled Workers", Journal of Economic Perspectives 9, 57-80 [50] Wooldridge, J.M. (2002), Econometric Analysis of Cross Section and Panel Data, Cambridge, MA: MIT Press [51] Zodrow, G.R. and P. Mieszkowski (1986), "Pigou, Tiebout, Property Taxation and the Underprovision of Local Public Goods", Journal of Urban Economics 19, 356—370. 24. EUI-WP RSCAS No. 2004/03 © 2004 Hannes Winner.
(33) Airports or Parks? the impact of fiscal competition on the composition of public expenditure. Appendix A) Variable. List of Variables and Summary Statistics Description. dependent variable: G (all in % of GDP) EDUC expenditure on education HEALTH health expenditure ECSERV expenditure on economic services TRANSP expenditure on transport and communication SOCIAL expenditure on social security and welfare independent variables Θ Tax competition variable: (log (Θit · 100), see (1)) D Dependency ratio (log %) Y GDP at constant prices (log 1995 US$) U Urbanization rate (log %) additional variables, used in the first-stage regression ³ ´ |I−S| M (log) Capital mobility: GDP · 100 ³ ´ it it L (log) Country size: PPOP · 100 OP t. R. Remoteness (log Distance). additional variables, used for calculation AETR Average effective tax rate for capital (τ it ), in % I Gross domestic investment (gross fixed capital formation), LCU S Gross domestic savings (S = GDP − C − G), LCU P private consumption, LCU C G C government consumption, LCU POP population additional variables, used for robustness checks CTR Statutory corporate tax rate, in % EMTR Effective marginal tax rate on business profits, in % EATR Effective average tax rate on business profits, in %. EUI-WP RSCAS No. 2004/03 © 2004 Hannes Winner. 25. obs. mean. s.d.. 484 482 482 471 483. 2.89 3.24 4.31 1.85 12.69. 1.82 2.20 2.12 1.22 4.99. 560. 4.09. 0.84. 588 588 588. 3.97 26.01 4.27. 0.11 1.59 0.23. 588. 0.59. 1.19. 588. 3.58. 1.60. 587. 8.39. 0.18. 560 560. 29.15 —. 14.78 —. 560. —. —. 560 560 560. — — —. — — —. 410 240. 38.42 25.77. 9.22 10.04. 240. 34.91. 11.08.
(34) Hannes Winner. B). Calculation of AETR on Capital. We follow Mendoza et al. (1994) and the modifications of Volkerink and de Haan (2001) and calculate the AETR on capital applying the following formula:. CAP =. (1 − Φ) · 1100 + 1200 + 4000 + 5125 + 5212 + 6100 , OS − 3000. where Φ is the fraction of personal income taxes attributable to labor income. Data are taken from the OECD Revenue Statistics and the OECD National Accounts (as not stated otherwise, see below). Φ comes from Revenue Statistics if income tax revenue is reported with respect to its labor and capital components; otherwise, we use the approximation recommended by Volkerink and de Haan (2000):. Φ∗ =. CoE , OSP U E + CoE. where the correlation coefficient between Φ and Φ∗ amounts to about 0.9. The codes used in the formula correspond to the OECD-classification in the OECD Revenue Statistics: 1100 1200 3000 4000 5125 5212 6100. Taxes on income, profits, and capital gains of individuals Corporate taxes on income, profits, and capital gains Taxes on payroll and workforce Taxes on property Taxes on investment goods Motor vehicle duties, not paid by households Other taxes solely paid by business. OS denotes the total operating surplus of the economy, OSP U E is the operating surplus of private unincorporated enterprises, and CoE is the compensation (i.e., gross wages and salaries) of employees.. C). Data Sources. Government expenditure (EDUC, HEALTH, ECSERV, TRANSP, SOCIAL): IMF, Government Finance Statistics Yearbook, International Monetary Fund: Washington D.C., various years (downloaded form the database of the Austrian Institute of Economic Research (WIFO), Vienna. Missing data: New Zealand (all series); Austria (1995-97), Belgium (1989-97), Canada (1970, 1972-73), Finland (1970-71), France (1970-74, 1994-97), Germany (1997), Greece (1970-71, 1982-90), Ireland (1970-81), Italy (1970-72, 1976-77, 1989-97), Iceland (1970-71), Japan (1970-90, 1994-97), Luxembourg (1996-97), Netherlands (1970-73) Norway (197071, 1978-79) Portugal (1970-73, 1976-77, 1989-97), United Kingdom (1970-71), United States (1970-71). 1100, 1200, 3000, 4000, 5125, 5212, 6100: OECD, Revenue Statistics 1965-1999, Electronic Edition on Microcomputer Diskettes, Paris: Organisation for Economic Co-operation and Development 2000. Missing data: All revenue categories for Iceland (1971-74, 1976-79); 1100 Portugal (1970-88); 1200 for Portugal (1970-88).. 26. EUI-WP RSCAS No. 2004/03 © 2004 Hannes Winner.
(35) Airports or Parks? the impact of fiscal competition on the composition of public expenditure. OS, OSPUE, CoE: OECD, National Accounts of OECD Countries, Volume II: Detailed Tables, Paris: Organisation for Economic Co-operation and Development, various years (partly downloaded from the Economic Database of the Austrian Institute of Economic Research (WIFO)). National data sources (consistent with the OECD National Accounts): OSP U E: Austria: Statistik Austria, Statistisches Jahrbuch für die Republik Österreich, Wien: Statistik Austria, various years (1994: 217, 2000: 270); Germany: Statistisches Bundesamt, Statistisches Jahrbuch für die Bundesrepublik Deutschland, Wiesbaden: Statistisches Bundesamt, various years (1989: 557, 1994: 698, 2000: 648). Missing data: OSP U E for Australia (1997), Belgium (1970-69), Canada (full period), Denmark (full period), Finland (1997), Greece (full period), Ireland (full period), Italy (1970-78, 1997), Iceland (1970-79, 1997), Luxembourg (full period), the Netherlands (1970-76, 1997), Norway (full period), New Zealand (full period), Portugal (1970-85, 1996-97), Spain (full period), Sweden (1970-69, 1997), Switzerland (1970-89, 1997) and United Kingdom (1997). Corporate Tax Rate (CTR): OTPR, World Tax Database, University of Michigan: Office of Tax Policy Research 2002 [http://wtdb.org/] EMTR, EATR: Devereux et al., 2002 [http://www.ifs.org.uk/corptaxindex.shtml] D, GDP$, U: World Bank, World development indicators on CD-ROM, Washington D.C.: The World Bank 2001. Missing data on GDP$ for Germany (1970-89) are replaced by real GDP-data from Statistisches Bundesamt, Statistisches Jahrbuch für die Bundesrepublik Deutschland, Wiesbaden: Statistisches Bundesamt 2000, 634-635 (at 1991 DM prices). M, L: own calculations. R: own calculations based on Egger (2000). C P , C G , GDP, I: IMF, International Financial Statistics, Washington D.C.: International Monetary Fund 2001 (downloaded from the WIFO Economic Database). POP: World Bank, World development indicators on CD-ROM, Washington D.C.: The World Bank 2001.. EUI-WP RSCAS No. 2004/03 © 2004 Hannes Winner. 27.
(36)
Figura


Documenti correlati
In this section we fix some notations and we recall some known facts about the solutions of the obstacle problem, their blow-up limits, the decomposition of the free boundary in
Circa l’esistenza di questo obbligo, gravante sui notai casentinesi, si trova traccia in alcuni rari, ma signi- ficativi, documenti tardomedievali: una provvisione dei riformatori
The reason stems from the fact that while in the present case the electric current is spin dependent only, thanks to the presence of spin-dependent distribution functions in the
For example, some authors investigated [2] packet forwarding performance achievable in vir- tual machines using different technologies to implement the virtual NICs and to connect
In the Mediterranean area, semi-extensive mixed farming sys- tems characterise the inland landscape and guarantee the mainte- nance of several agroecosystem services. Rationed
For each Italian province, data regarding the number of farms that move animals for slaughter and data of animal population census (expressed as the total number of animals in
Long-term effects of continuous subcutaneous infusion versus daily subcutaneous injections of growth hormone (GH) on the insulin-like growth factor system, insulin sensitivity,
Compilations of prayers, psalms, icons, and monastic offices are rendered palatable by being disguised as history, and are especially successful when sold under the umbrella of
