ALMA MATER STUDIORUM
UNIVERSITA' DI BOLOGNA
SCUOLA DI SCIENZE
Corso di laurea magistrale in BIOLOGIA MARINA
Possible effects of gold mining on coral reef health
Tesi di laurea in
RICERCA SCIENTIFICA SUBAQUEA
Relatore Presentata da
Prof. Massimo Ponti Greta Zampa
Correlatori
Dott.ssa Eva Turicchia
Prof. Markus T. Lasut
1
“Knowing is the key to caring, and with caring there is hope that people will be motivated to take positive actions. They might not care even if they know, but they can’t care if they are unaware”
3
Abstract
Indonesia, being the core of the Coral Triangle, is supposed to hosts the most healthy and diverse coral reefs on the Planet Earth. However, the combination of global and local stressors has led to a decline in coral reef communities around the world. Anthropic activities of particular interest in North Sulawesi are industrial and artisanal gold mining (ASGMs). Industrial mining activities generally used the alkaline cyanidation method while ASGMs still employ mercury amalgamation to extract gold from ores. Heavy metal contamination is one of the important environmental problems today. The extraction and processing of gold produces mine tailings that contain heavy metals, which may be dispersed in the catchment basin due to rain and flooding events and could alter the natural defences of the corals and favour the onset of diseases. The objective of this study was to assess the possible impacts of gold mines in North Sulawesi on coral reef health by comparing prevalence of coral diseases and aggressive species interactions between putatively affected and control sites. As putatively impacted sites, coral reefs downstream to four mining sites were selected: one long-time and one recently established ASGM, a modern industrial mine and a new site in preparation.
Among the 21 possible diseases and other signs of compromised health investigated, gastropod corallivory, aggressive overgrowth, skeletal deformations caused by pyrgomatid barnacle and bleaching, were significantly more abundant at some sites affected by mining activities, compared to controls. A significant increasing of coral bleaching appeared as a result of the pollution generated by ASGMs, which release mercury in the aquatic environment. Detected alterations indicate that long term mining activities can affect the health of coral reefs, especially if precautions are not paid for the release of heavy metals into the environment. Mining in the area is expected to increase due to the large availability of resources, but well environment-based policies are needed to ensure that this development does not compromise biodiversity and marine resources.
5
Table of contents
1. Introduction ... 7
1.1 Aims of the study ... 12
2. Material and methods ... 13
2.1 Study area ... 13
2.1.1 Totok Bay (TB), long term ASGMs ... 16
2.1.2 Talawaan River (TW), recently ASGMs ... 17
2.1.3 Pantai Surabaya (PS), recent industrial gold mining site ... 18
2.1.4 Coral Eye House Reef (HR), mining site in preparation ... 19
2.1.5 The control sites ... 20
2.2 Pollution status of the investigated sites ... 22
2.3 Sampling Activities ... 23
2.4 Data analysis ... 26
3. Results ... 27
3.1 Gastropod corallivory (GC) ... 29
3.2 Aggressive overgrowth (AgO) ... 32
3.3 Galls caused by cryptochirid crabs (GA) ... 37
3.4 Bleaching (BL) ... 42
3.5 Other diseases and signs of compromised health ... 45
4. Discussion ... 47
7
1. INTRODUCTION
The building framework of coral reefs is provided by scleractinian corals (hard coral) and other bioconstructors organisms that offer shelter and protection to various marine taxa supporting a complex trophic network (Sebens, 1994). Coral reefs harbor thousands of species (Fisher et al., 2015; Reaka-Kudla, 1997), provide food and livelihoods for millions of people including shoreline protection, livelihoods from ecotourism, fisheries production, and a living synthesis engine of biomedical and industrially valuable compound (Adger, 2005; Bryan and Langston, 1992; Burke et al., 2011). The value of these goods and services varies globally but they were estimated at over 350,000 US$/ha/yr (2007 price level) for all reefs, globally (Groot et al., 2012).
Unfortunately, coral reefs worldwide are in crisis (Hughes et al., 2017). Over the last few decades, global stressors related to climate change have been recognised as a significant threat to coral reef ecosystems (Heron et al., 2017). The combination of global and local stressors has resulted in declines in reef communities worldwide (Burke et al., 2011). Natural and anthropogenic stressors include a decline in water quality, overexploitation of resources and global climate change. These factors are the leading causes of the onset of mass coral bleaching and signs of compromised health of corals (Ban et al., 2014; Carpenter et al., 2008; Thompson et al., 2014).
The World Health Organization has defined coastal pollution as a phenomenon driven by human activities which results in such deleterious effects as harm to living resources and marine life (Vikas and Dwarakish, 2015). Coral reefs are considered to be one of the most vulnerable and pollution-sensitive ecosystems, and due to multiple anthropogenic and environmental stressors, these ecosystems have undergone a large decline in recent years (Reopanichkul et al., 2009).
Approximately 19% of coral reefs have been effectively lost, an additional 15% are under the imminent risk of collapse due to human pressure within the next 10 -20 years, and an additional 20% are under a longer-term threat of collapse (Wilkinson, 2004).
8
Threats faced by the reefs in Nord Sulawesi, Indonesia, include destructive fishing activities (e.g., blast fishing and poison fishing) (DeVantier and Turak, 2004) and pollution from artisanal and industrial gold mining. These mining expanded dramatically around the world beginning in the 1970s, including widespread activity in North Sulawesi since the early 1980s (Aspinall and Eng, 2001; De Lacerda and Salomons, 2012; Limbong et al., 2003).
The extraction of gold from its ores is carried out through two main possible processes that characterise industrial and artisanal gold mines. Industrial mines generally used the alkaline cyanidation method. In this process, the gold-bearing ore is crushed and subsequently oxidised and dissolved in an alkaline cyanide solution (Acheampong et al., 2010). In this reaction the dissolution of gold takes place. Some industrial gold mines use a management technique called Submarine Waste Disposal (Blanchette et al., 2001; Ellis et al., 1995; Jones and Ellis, 1995). For instance, in the Buyat-Ratototok mining district (Indonesia), after the treatment, the tailings are pumped a few kilometres from the work site, mixed with sea water and deposited via a pipe 900 m from the shore at 82 m depth (Edinger et al., 2007). Artisanal and Small-scale Gold Mines (ASGMs) still employ mercury (Hg) amalgamation to extract gold from ores (Edinger, 2012) and this method in North Sulawesi was described by Bose-O’Reilly et al., 2010. In this case, the mineral is crushed by hand or through a jaw crusher. The fragments are milled in ball mills, together with lavic rocks and liquid Hg. Mercury and gold form amalgam that is melted inside the ball mill area to vaporise the Hg and thus obtain the gold. Mercury vapours are dispersed in the atmosphere, inhaled by miners and deposited on plants and ground.
ASGMs, which are often illegal although tolerated, are a major anthropic source for emission and release of mercury in the environment worldwide (Cordy et al., 2011; González-Merizalde et al., 2016; Odumo et al., 2014; Oke and Vermeulen, 2017; Velásquez-López et al., 2010).
The extraction and processing of gold involve the contamination of soil and water with heavy metals (such as Cu, As, Sb, Zn, Pb, Hg) and cyanide at high concentrations, which in turn can mobilize other metals, especially arsenic (Acheampong et al., 2010).
9
Heavy metal contamination is one of the important environmental problems today (Fu and Wang, 2011). It has been shown that heavy metals (such as lead, copper and arsenic) are toxic to aquatic flora and fauna even in relatively low concentrations (Mohan and Pittman Jr, 2007), while mercury contribute to marine pollution, posing potential risks to marine ecosystems due to its toxic properties and its capability of bioaccumulation and biomagnification in ecosystems (Gao and Chen, 2012). After the discovery of Minamata disease, caused by the release of methylmercury in Minamata Bay (Japan) from a chemical factory, several studies on the toxicity deriving from mercury and on the transfer of toxicity in the food web have been carried out (Ekino et al., 2007; Guerra et al., 2009; Harada, 1995; Wen-Xiong Wang, 2002).
In several districts of the North Sulawesi there are important gold deposits and heavy metal contamination associated with gold mining is one of the principal environmental concern in this region (Edinger et al., 2007). Here, it has been estimated that around 200 tonnes of mercury are used annually for mining operations (Kambey et al., 2001), and this has raised environmental concerns. It is estimated that about 50% of the Hg used in the amalgamation is released into rivers as metallic Hg, and an additional 5% to 10% of the Hg is discharged into the environment during the recovery of gold from Hg amalgam.
Further estimates have concluded that about 1.32 kg of Hg is discharged every 1 kg of gold production (De Lacerda and Salomons, 2012; Pfeiffer and de Lacerda, 1988).
Corals respond in different ways at the increase in concentrations of heavy metals: inhibition of coral fertilization and reduced reproductive success (Reichelt-Brushett and Harrison, 1999, 2005; Reichelt-(Reichelt-Brushett and Michalek-Wagner, 2005); decreased settlement and survival of coral larvae (Goh, 1991; Reichelt-Brushett and Harrison, 2000); changes in the population and growth of zooxanthellae (Kayser, 1976); changes in the rate of photosynthesis which resulted in a decrease in coral calcification and growth rates during the juvenile polyp stage (Falkowski et al., 1993; Ferrier-Pagès et al., 2001; Harland and Brown, 1989); increased coral bleaching (Sabdono, 2009) and enhanced coral mortality and lowered live corals (Mitchelmore et al., 2007; Sabdono, 2009).
10
Corals are holobionts, multi-partite symbiotic organisms consisting of the animal and the associated internal and external microbiota (Rohwer et al., 2002; Rosenberg et al., 2007). Members of the holobiont are bacteria, archaea, viruses, fungi and endosymbic algae that provide mutual benefits (Olson et al., 2009; Ritchie, 2006; Rohwer et al., 2002). Changes or functional disturbances of one of these partners can compromise the health of the whole animal.
During periods of prolonged environmental stress, corals become vulnerable, and it has been hypothesised that some bacteria benefit from this destabilisation and coral commensal microbes (Ritchie, 2006). Disease onset in corals depends on complex interactions between the associated partners that influence the fitness of the collective holobiont and the resistance of the disease outbreak. External stress factors that affect corals trigger physiological and biochemical responses in the animal and cause changes in the associated microbial communities, functional imbalances that can lead to the onset of diseases (Bourne et al., 2009; Lesser, 2004). Climate change-driven stress, such as increasing water temperature, can have a strong impact on the coral holobiont, disrupting the balance of various host-symbiont relationships. In this case, the microbial communities of the holobiont change and can become pathogenic (Bourne et al., 2009; Rosenberg et al., 2007) causing diseases (Ocampo et al., 2015; Palmer and Traylor-Knowles, 2012; Pinzon et al., 2015; Weiss et al., 2013). Furthermore, disease susceptibility has also been linked to high sedimentation rates, water turbidity and eutrophication (Bruckner and Bruckner, 1997; Bruno et al., 2003; Fabricius, 2005; Haapkylä et al., 2011; Pollock et al., 2014; Voss and Richardson, 2006a, 2006b; Zaneveld et al., 2016). In addition to the loss of coral tissue, disease can cause significant changes in reproduction rates, growth rates, community structure, species diversity and abundance of reef-associated organisms (Hughes, 1994; Kim and Harvell, 2004). Diseases have been identified as a major contributor to the decline in corals worldwide (Weil et al., 2006).
While an unprecedented increase in coral disease has been well-documented in the Caribbean over the last decade (Weil, 2004), and some scientists argue that climate warming has driven part of the increase in damaging outbreaks. Much less is known about the status of disease throughout the Indo-Pacific (Harvell et al., 2007).
11
About 85.707 km2 of 14% of total corals in the world extending all the way in the Indonesian seas (Tomascik, 1997).
The health of the coral reef depends on the presence of diseases, the human pressure and contamination level in marine organisms and their habitats.
Baseline coral health surveys are an essential first step in identifying areas of concern where management and mitigation strategies need to be implemented.
12
1.1
Aims of the study
The objective of this study was to evaluate the possible impacts of gold mines in North Sulawesi on coral reef health. The extraction and processing of gold produces mine tailings that contain heavy metals, which may be dispersed in the catchment basin due to rain and flooding events.
Coral reef health status at each of 4 putatively impacted sites, downstream to watersheds hosting differend gold mines (one long-time and one recently established ASGM, a modern industrial mine and a new site in preparation), was compared to 4 control sites. The state of alteration of coral reef health has been assessed by considering 21 possible diseases and other signs of compromised health according to the guidelines of Raymundo et al. (2008).
13
2. MATERIAL AND METHODS
2.1. Study area
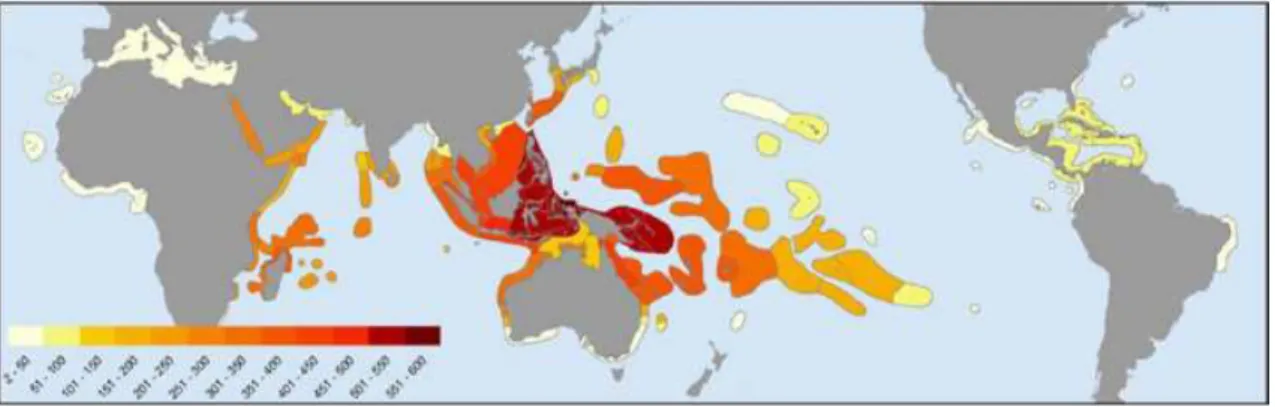
The higher marine biodiversity on the planet is located within the ‘Coral Triangle’ (Roberts, 2002). In this area there are more than 600 species of zooxanthellate corals, representing 76% of the total coral species in the world (Fig. 2.1) (Veron et al., 2009).
Fig. 2.1 Global biodiversity of zooxanthellate corals. Colours indicate total species richness of the world’s 141 coral biogeographic ‘ecoregions’ (image from Veron et al. 2009).
As described by Veron et al. (2009), the species diversity of the coral triangle does not have a single explanation. Plate tectonics has created the biogeographical model and extreme heterogeneity of the habitat. Many environmental parameters, especially ocean currents and temperature, have caused dispersion patterns formed sequences of attenuation away from the equator leaving the coral triangle with the region’s highest biodiversity. This high level of biodiversity may be explained by evolutionary patterns and the genetic outcomes of environmental drivers.
There are many human disturbances that can threaten this biodiversity in the coral triangle, so continuous monitoring of coral reefs is needed.
The study sites were selected in the North Sulawesi (Indonesia) based on their distance from possible source of pollution due to mines (Fig. 2.2; Table 2.1).
14
Therefore, four impact sites were selected as closest as possible to the mouth of the streams or rivers flowing through mining areas (Fig. 2.2; Table 2.1).
Impact sites were selected thanks to watershed analysis carried out using a Geographic Information System (GIS) (Tamburini, 2018). This analysis helped to identify the mouths of streams or rivers flowing through mining areas. An algorithm of GRASS 7 (r. watershed - Watershed basin analysis program) in QGIS 2.18 (Quantum GIS Development Team 2017) was performed using Digital Elevation Model (DEM) data (horizontal resolution of 90 m at the equator) by Shuttle Radar Topography Mission (SRTM 4.1; http://www.cgiar-csi.org/data/srtm-90m-digital-elevation-database-v4-1) to obtain the watersheds (Tamburini, 2018).
Fig. 2.2 Map of the study area and sampling sites (WGS84):
Active gold mines: Totok Bay (TB), Talawaan river (TW), Pantai Surabaya (PS); Mining in preparation: Coral Eye House Reef (HR); Control sites: Batu Belah (BB), Batu Nona (BN), Talisei Island (TA) and Tasik Ria Resort (TR).
15 Si te la be l St u d y s ite Sit e t yp e G old e xt ra ct io n m et h od La tit u d e ( °N ) Lo n gi tu d e ( °E ) TB To to k B ay A cti ve g old m in e H g a m alg am 0.8 85 82 12 4.7 25 96 TW Ta la w aa n R iv er A cti ve g old m in e H g a m alg am 1.6 17 35 12 4.8 67 64 PS Pa nt ai Su ra ba ya A cti ve g old m in e Cy an id ati on 1.6 67 27 12 5.1 06 01 H R Co ra l E ye H ou se R ee f M in in g s ite in p re pa ra tio n -1.7 51 13 12 5.1 32 79 B B B atu B ela h Co nt ro l -1.7 72 45 12 5.1 82 95 B N B atu N on a Co nt ro l -1.3 47 30 12 5.0 81 38 TA Ta lis ei Co nt ro l -1.8 55 45 12 5.0 90 99 TR Ta sik R ia R es or t Co nt ro l -1.4 12 39 12 4.7 05 72 G eo gr ap h ic c oo rd in at e W G S8 4 Ta bl e 2 .1 S am p lin g s ite s. G eo gr ap h ic al co or d in at es a re re fe rr ed to W G S8 4 d at u m .
16
2.1.1 Totok Bay (TB), long term ASGMs
Fig. 2.3 Watershed basin at Totok Bay (TB). The acronym ASGMs refers to the Artisanal and Small-Scale Gold Mining (image from Ercadi, 2018).
Totok bay (TB) is a large bay in the Southeast Minahasa Regency that is protected from wave action by the Ratatotok Peninsula. The main city overlooking the bay is Rototok, adjacent to the mouth of the Totok river (Edinger et al., 2008).
Totok Bay receives water from the Ratatotok catchment area through the Totok River (TR) (Fig. 2.3), which is a completely different catchment area from that of Buyat River. Mining activity in Buyat-Ratototok district started in the early 1920s, but early to mid-1980s saw a rapid intensification of extraction (Turner et al., 1994).
Artisanal gold mining continues at a low level in both the Totok and Kotabunan watersheds (Aspinall and Eng, 2001).
In 1989, about 8,000 local artisan miners were stopped by the government, but illegal activities continue today (Blackwood and Edinger, 2007; Lasut et al., 2009; Limbong et al., 2003; Turner et al., 1994).
The mangroves are found along the perimeter of the coast and the reef is located both inside and outside the bay. The site (TB) was about 2.50 km from the mouth of the river and the sea bottom was covered with hard coral colonies.
17
2.1.2 Talawaan River (TW), recently ASGMs
Fig. 2.4 Watershed basin at Talawaan River (TW). The acronym ASGMs refers to the Artisanal and Small-Scale Gold Mining (image from Ercadi, 2018).
The Talawan River is in the Dimembe sub-district in the North Sulawesi province and flows in front of the Siladen Island (Bunaken National Park) (Fig. 2.4). Its extension is about 15 km and the nearest village from the mouth of the river is Talawaan.
In 1997, a gold mining concession was granted to the Aurora Mining Co. of Australia and an artisanal small-scale gold mine was established in the Dimembe sub-district of North Sulawesi province, in the north-east of Manado City. Over the years this mine has expanded to include thousands of miners.
There are many threats to the province due to pollution from Hg in Talawaan Watershed that continue to this day (Martens, 2000).
Talawaan impact site (TW) was located 500 m south of the Talawaan River mouth and the reef extended over a steep slope after a mangrove forest.
18
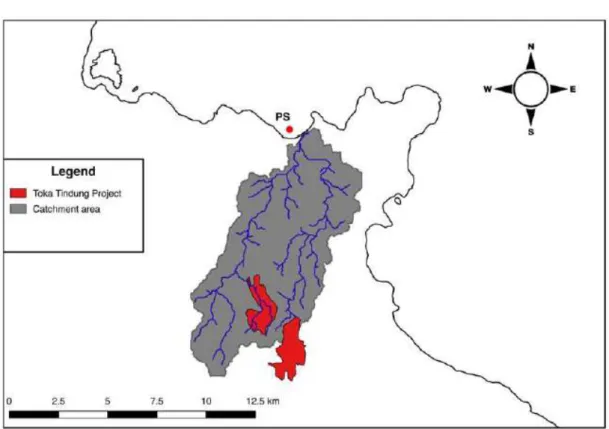
2.1.3 Pantai Surabaya (PS), recent industrial gold mining site
Fig. 2.5 Watershed basin at Pantai Surabaya (PS). Toka Tindung Project refers to the industrial gold mine (image from Ercadi, 2018).
The Toka Tindung mine owned by PT Archi Indonesia is located about 35 km north-east of Manado City in rolling foothills above the coast at elevation 200 m above sea level.
Gold and silver mining began in 2010 and use cyanide for extraction of gold (http://www.archimining.com/en/operations). Therefore, is the only industrial mine taken into consideration in this study.
In the mine area, in the northern tip of North Minahasa Regency, flows a river that collects the wastewater and flows into the bay of Pantai Surabaya (Fig. 2.5).
The site (PS) was characterized by volcanic sand and solitary spots of corals and was chosen 500 m from the mouth of the river.
19
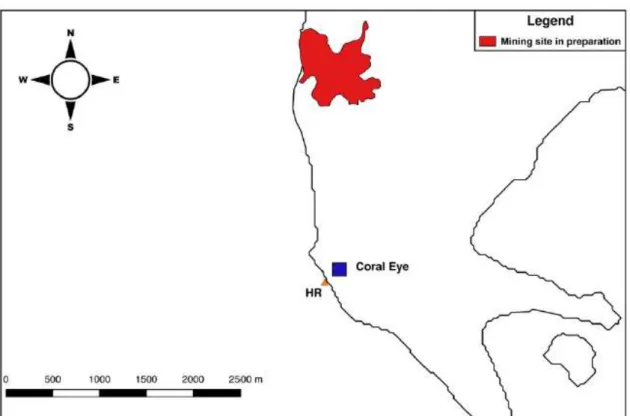
2.1.4 Coral Eye House Reef (HR), mining site in preparation
Fig. 2.6 Industrial mining site in preparation on Bangka Island (Coral Eye House Reef; HR) (image from Ercadi, 2018).
The Bangka Island is located in North Sulawesi. In 2008, local authorities granted a mining company a concession for the use of the mine located on the south-west coast of the island (Fig. 2.6). A few years after the excavation operations and the construction of the structures on the coast, the Supreme Court of Jakarta nullified the permit leaving the mine in deadlock.
The Coral Eye House Reef Site (HR) was in front of the Coral Eye resort, located in the south-west of the island, a few kilometres south of the mining area.
20
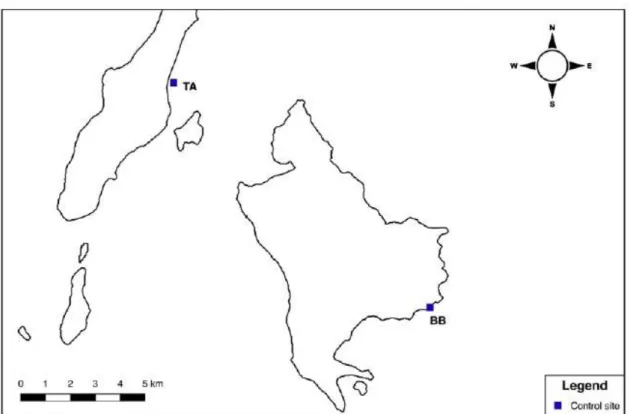
2.1.5 The control sites
The four control sites were randomly selected at least 10 km away from mining activities and away from river mouths that could lead to sludge from mines.
Fig. 2.7 Control sites in Bangka Island (Batu Belah; BB) and in Talisei Island (TA) (image from Ercadi, 2018).
Batu Belah (BB)
The sampling site is situated on the east coast of Bangka Island (Fig. 2.7). The fringing reefs is located on an irregular volcanic coast and a flat slope. The coast is often hit by strong waves and currents. The nearest inhabited area is the Mimpi Indah resort which is about 2 km from the sampling point.
Talisei (TA)
The Talisei Island is located north-west of Bangka Island (Fig. 2.7). Samplings were carried out between the fringing reef of the north-eastern coast of Talisei and the northern reefs of Kinabohutang Island. Even here there was a flat slope, the bottom was sandy with non-uniform corals spots. The nearest village is about a kilometer away.
21
Fig. 2.8 Batu Nona control site (BN) and Tasik Ria Resort control site (TR) (image from Ercadi, 2018).
Batu Nona (BN)
The Batu Nona site is located on the southeastern coast of North Sulawesi (Fig. 2.8) The coast is characterized by mangroves and a fringing reef with a very high crest and very shallow flat. Sampling was carried out about 300 m from the coast to reach the depth required by the protocol.
Tasik Ria Resort (TR)
The Tasik Ria Resort is located on the west coast of North Sulawesi about 17km south of Manado city (Fig. 2.8). Sampling was carried out in the reef close to the jetty of the Tasik Ria resort. The coast is characterized by mangroves and the bottom is mostly flat and sandy and the reef extends only in the surface area.
22
2.2. Pollution status of the investigated sites
The study of Ercadi (2018) highlighted the contamination of trace elements from the activities of gold extraction in the same sites studied in this work thanks to the analysis of a target species of the ascidian, Polycarpa aurata (Quoy and Gaimard, 1834). The body without tunic (CI) of Polycarpa resulted be better storage tissue rather than tunic, analysed as well.
In Artisanal and Small-scale Gold Mines (ASGMs) mean concentrations of Hg was significantly higher at both at Totok Bay (TB) and Talawaan River (TW) impact sites than in control sites. The CI tissues concentration of Hg was 3.35 µg g-1 and 1.63 µg g-1 respectively in TB and TW impact sites.
That showed the enrichment regarding Hg due to the activity of ASGMs.
In TB site a significantly higher concentration of Cu and Cr was also found than at control sites.
Fig. 2.9 Mercury (Hg), Copper (Cu) and Chromium (Cr) mean (±SE) concentration in
dry weight mg kg-1 in body without tunic was reported (from Ercadi, 2018).
Significant levels: * P<0.05, ** P<0.01; *** P<0.001.
In wastewater of the Pantai Surabaya (PS) site, downstream to an industrial mine, there has been no contamination of trace metals.
While, in the mine in preparation, at the site of Coral Eye House Reef (HR), all the trace metals were uniform with that of the control site.
23
2.3. Sampling Activities
Benthic assemblages, coral diseases and other signs of compromised health around North Sulawesi (Indonesia) and Bangka Island were investigated at 8 selected sites (4 impact sites and 4 control sites) at three depths, where it was possible: 3, 6 and 9 m (Below the Mean Lower Low Water (MLLW)). These depths respectively correspond to the reef flat, reef crest and slope (i.e., front reef), which are standard subzones in coral reef monitoring studies (e.g., Hill and Wilkinson, 2004; Hoeksema, 2012).
In the impacted site of Pantai Surabaya (PS) and the control site Tasik Ria Resort (TR), it was possible to investigate only the 3 m depth, due to a not well-developed reef. The survey was performed between June and August 2018.
Tidal levels were calculated using the Windows Tide prediction software, WXTide (www.wxtide32.com), using the subordinate station of Manado and Lembeh Strait. At each site and depth, five belt transects (10 x 2 m) were placed randomly along reef contours (Beeden et al., 2008; Ponti et al., 2016). A gap of at least 5 m was left between each transect. Overall, 100 belt transects were analysed, covering a total area of 2.000 m2.
Only scleractinian coral colonies with diameters greater than 20 cm were identified at the genus level in all transects.
For each transect, the number of colonies and the presence of a possible sign of disease for each colony have been marked.
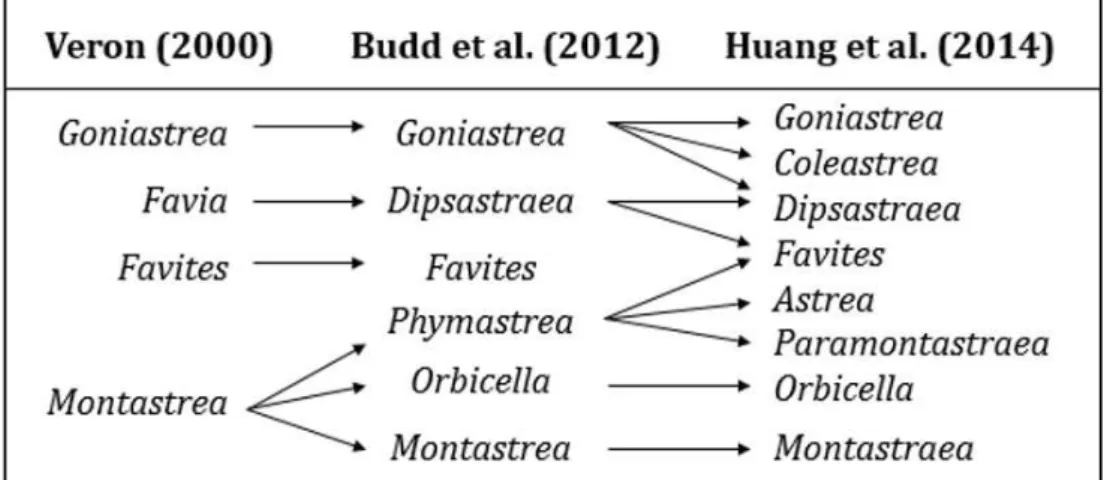
The scleractinian taxonomy was based mainly on Veron (2000), with some exceptions taking in consideration of the recent reclassification of certain coral species.
According to Wallace et al. (2012), the genus Acropora and the genus Isopora were separated. The genus Favia has always contained Indo-Pacific and Atlantic species, but according to Budd et al. (2012), the Indo-Pacific species have been reclassified to the Dipsastraea genus (Fig. 2.9).
Even if the new classification of the genus Goniastrea provided for the subdivision of some species among the genera Goniastrea, Coelastrea, Dipsastrea (Fig. 2.9), it refers to the taxonomy of Veron (2000).
24
Furthermore, it has been used the functional Phymastrea group to indicate the genus Montastrea of Veron (2000), which later Budd et al. (2012) has divided into three genera: Phymastrea (more recently reassigned to Astrea, Paramontastraea and Favites; Huang et al., 2014), Orbicella and Montastrea (Fig. 2.9).
It has been considered the functional group "Fungia" to indicate some recently elevated subgenres at the genus level (i.e. Danafungia, Verrillofungia and Pleuractis, see Gittenberger et al., 2011).
Fig. 2.10 Comparisons amongst recent classifications of reef corals (Veron, 2000; Budd et al. 2012; Huang et al. 2014).
Every sign of coral disease or other compromised health signs has been identified and assigned to one of the 21 categories defined according to the identification guides of Beeden et al. (2008) and Raymundo et al. (2008) (Table 2.2). A sign of health alteration was added with the acronym UGA (Unidentified Growth Anomalies) and represents abnormal growth forms of the coral structure.
25 D is ea se o r c om pr om is ed h ea lth ca te go ry A cr on ym U nid en tif ie d N I Fis h b ite s FB Cr ow n- of-th or ns st ar fis h ( Ac an th as te r p la nc i) CO TS G as tro po d c or all iv or y ( e.g ., D ru pe lla s p.) G C SD B la ck b an d d ise as e B B D Sk ele ta l e ro din g b an d SE B B ro w n b an d B rB U lce ra tiv e w hit e s po t U W S W hit e s yn dr om e W S A tra m en to us n ec ro sis A tN B le ac hin g B L Fo ca l b le ac hin g FB L N on -fo ca l b le ac hin g ( e.g ., p atc he s, s tri pe s) N FB L Pig m en ta tio n re sp on se PR Tr em ato dia sis TR G A B A U G A A gO R W S A co elo m or ph fla tw or m in fe sta tio n ( e.g ., W am in oa sp .) Co lo ur ed b an d d ise as e Tis su e d isc olo ur ati on Co m pr om ise d h ea lth Co m ple te ly h ea lth y c olo ny U nid en tif ie d g ro w th an om ali es W hit e N ot w hit e G all s c au se d b y c ry pt oc hir id cr ab s Sk ele ta l d efo rm ati on s c au se d b y p yr go m ati d b ar na cle s A gg re ss iv e o ve rg ro w th (e .g., co ra l-k illi ng sp on ge s T er pio s h os hin ot a an d C ha lin ula n em at ife ra ) Sy m pt om Pr ed ati on o r o th er st re ss S ed im en t d am ag e N o b an d Tis su e l os s T ab le 2 .2 C or al d is ea se s a n d o th er si gn s o f c om p ro m is ed h ea lth a cc or d in g t o t h e g u id eli n es a n d a cr on ym s o f B ee d en e t a l. (2 0 08 ) a n d R ay m u n d o e t a l. ( 20 0 8 ).
26
2.4. Data Analysis
In the present study, the abundance of each coral category and signs of compromised health found were expressed for each transect.
A disease prevalence value is calculated for each area-sample unit. Disease prevalence is the proportion of diseased colonies to the total population of the same genus (Raymundo et al., 2008):
Prevalence (P) = (# diseased colonies/ total # of colonies of the same genus) x 100
All mean values are reported with standard errors (±SE).
Differences in the abundance of coral diseases between the impacted sites and control sites were tested by multivariate permutational analysis of variance (PERMANOVA) (Anderson and Robinson, 2001).
The factors were: impact (Im; 2 levels, fixed), depth (De;3 levels, fixed) and site nested in impact (Si (Im); 8 levels, random).
Being univariate, the tests were based on Euclidean distances calculated on unprocessed data (Anderson and Robinson, 2001).
When less than 999 unique values in the permutation distribution were available, asymptotical Monte Carlo P-values was used instead of permutational P-values. The differences were accepted as significant when Monte Carlo P-values or permutational P-values were < 0.05.
In the PERMANOVA, when the term Si(Im) was not significant (P > 0.25) the Site factor was eliminated.
When the interaction between impact and depth (Im × De) was significant were investigated by post-hoc pair-wise tests.
PERMANOVA analysis was done using PRIMER 6 with PERMANOVA+ add-on package (Anderson et al., 2008).
27
3. RESULTS
The aim of this study was to assess whether gold mines in North Sulawesi, Indonesia, could have an effect on coral reefs health. This possible impact was assessed based on the presence of diseases in scleractinia corals.
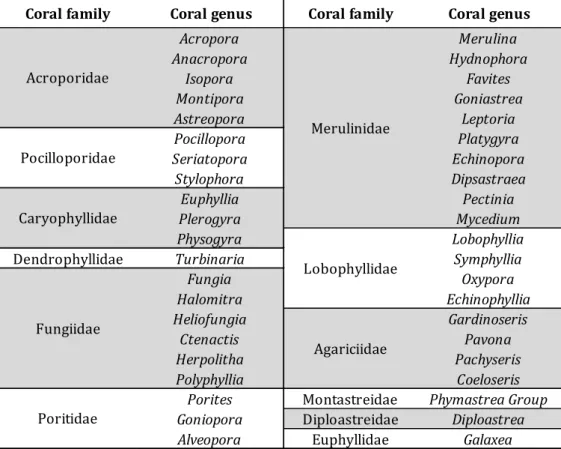
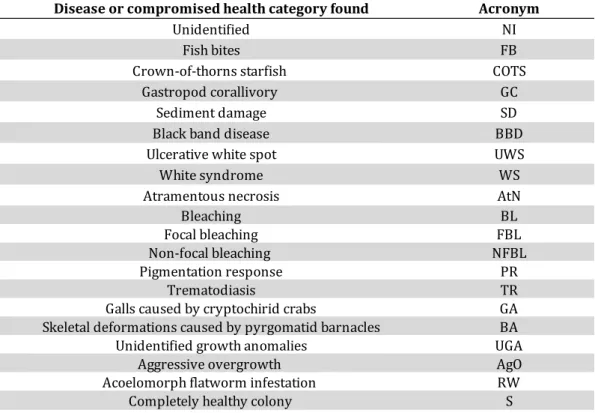
A total of 42 genera of scleractinian coral have been found (Table 3.1) and 19 different types of coral disease and other signs of compromised health were recorded on a total of 21 searched for (Table 3.2).
Table 3.1 Scleractinia genera found in this study
Considering all transects (n=100) performed at 8 sites and 3 depths per site (but 1 depth at TR and PS) , the total number of scleractinan colonies found was 2483. The largest number of colonies was found for Fungia (411 colonies), followed by Porites (315 colonies), Dipsasraea (124 colonies), Acropora (109 colonies) and Seriatopora (106 colonies).
The most abundant genera were Fungia (mean aboundance 4.11 ± 0.45 colonies transect-1), Porites (mean aboundance 3.17 ± 0.15 colonies transect-1), Dipsastraea
Coral family Coral genus Coral family Coral genus
Acropora Merulina Anacropora Hydnophora Isopora Favites Montipora Goniastrea Astreopora Leptoria Pocillopora Platygyra Seriatopora Echinopora Stylophora Dipsastraea Euphyllia Pectinia Plerogyra Mycedium Physogyra Lobophyllia Dendrophyllidae Turbinaria Symphyllia
Fungia Oxypora Halomitra Echinophyllia Heliofungia Gardinoseris Ctenactis Pavona Herpolitha Pachyseris Polyphyllia Coeloseris
Porites Montastreidae Phymastrea Group Goniopora Diploastreidae Diploastrea Alveopora Euphyllidae Galaxea Fungiidae Poritidae Acroporidae Pocilloporidae Caryophyllidae Lobophyllidae Merulinidae Agariciidae
28
(mean aboundance 1.24 ± 0.14 colonies transect-1), Acropora (mean aboundance 1.09 ± 0.12 colonies transect-1) and Seriatopora (mean aboundance 1.06 ± 0.20 colonies transect-1) (Fig. 3.1).
On overall, 40 genera of hard corals showed signs of compromised health, while in Heliofungia and Oulophyllia was present only the unidentified alteration status (NI).
Table 3.2 The 19 category of disease or compromised health found in this study. The completely healthy colony is added to the table.
Disease or compromised health category found Acronym
Unidentified NI
Fish bites FB
Crown-of-thorns starfish COTS
Gastropod corallivory GC
Sediment damage SD
Black band disease BBD
Ulcerative white spot UWS
White syndrome WS
Atramentous necrosis AtN
Bleaching BL
Focal bleaching FBL
Non-focal bleaching NFBL
Pigmentation response PR
Trematodiasis TR
Galls caused by cryptochirid crabs GA Skeletal deformations caused by pyrgomatid barnacles BA
Unidentified growth anomalies UGA
Aggressive overgrowth AgO
Acoelomorph flatworm infestation RW
29
Fig. 3.1 Mean abundance (±SE) of the most abundant scleractinian genera.
Only four disease were significant higher at impact sites compared to control sites: gastropod corallivory (GC), bleaching (BL), aggressive overgrowth (AgO) and galls caused by cryptochirid crabs (GA) (Fig 3.23).
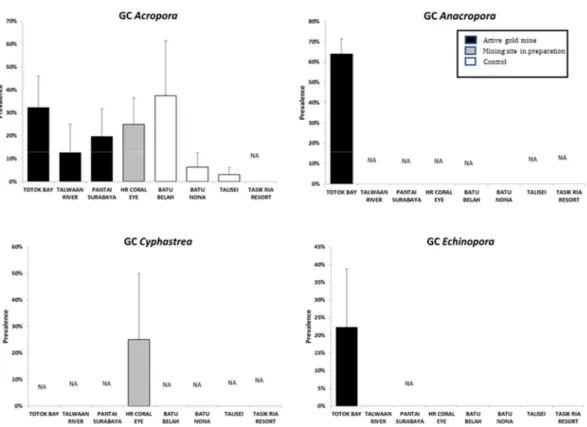
3.1. Gastropod corallivory (GC)
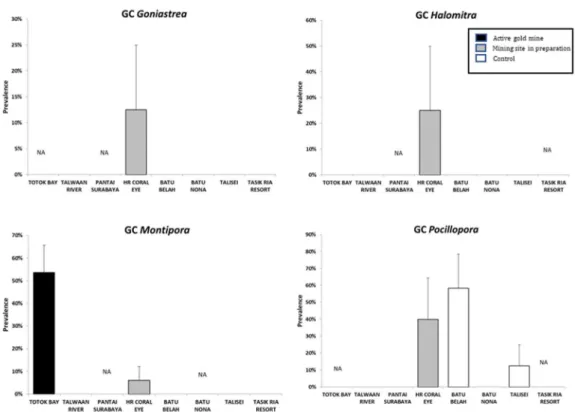
Gastropod corallivory (GC) was significantly more prevalent at Totok Bay (TB; Table 3.3) and Coral Eye House Reef (HR; Table 3.4) than at control sites.
The presence of GC at TB was found in the following coral genera (Fig. 3.3-3.5): Acropora (prevalence 32.2 ± 13.7%), Anacropora (63.9 ± 7.5%), Echinopora (22.2 ± 16.5%), Montipora (53.6 ± 12.0%), Pavona (20.0 ± 20.0%), Porites (44.6 ± 10.2%), Seriatopora (1.2 ± 1.2%), Turbinaria (100 ± 0.0%).
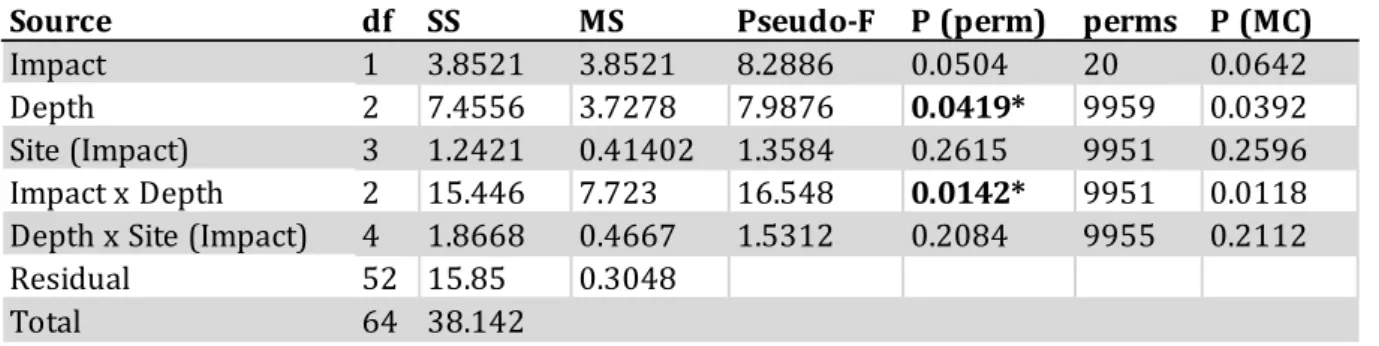
Prevalence of GC at 9 m depth was significant higher at HR (pair-wise test: P<0.01; Fig. 3.2). The presence of GC at HR was found in the following coral genera (Fig. 3.3-3.5): Acropora (25.0 ± 11.5%), Cyphastrea (25.0 ± 25.0%), Goniastrea (12.5 ± 12.5%), Halomitra (25.0 ± 25.0%), Montipora (6.1 ± 6.1%), Pocillopora (40.0 ± 24.5%), Porites (22.4 ± 10.0%), Seriatopora (10.3 ± 7.3%).
30
Fig. 3.2 Prevalence of gastopod corallivory (GC) at the three depths (3 m, 6 m, 9 m) at each sampling sites. TB: Totok Bay; TW: Talawaan River; PS: Pantai Surabaya; HR: Coral Eye House Reef; BB: Batu Belah; BN: Batu Nona; TA: Talisei; TR: Tasik Ria Resort. Significant levels: * P<0.05, ** P<0.01; *** P<0.001.
Fig. 3.3 Prevalence of GC in Acropora, Anacropora, Cyphastrea and Echinopora in the sampling site.
31
Fig. 3.4 Prevalence of GC in Goniastrea, Halomitra, Montipora and Pocillopora in the sampling site.
Fig. 3.5 Prevalence of GC in Pavona, Porites, Seriatopora and Turbinaria in the sampling site.
32
Table 3.3 PERMANOVA test on the prevalence of GC at Totok Bay (TB) according to the factors Impact, Depth, and Site nested in Impact. Significant levels were indicated by the following symbols: * = P < 0.05; ** = P < 0.01; *** = P < 0.001.
Table 3.4 PERMANOVA test on the prevalence of GC at Coral Eye House Reef (HR) according to the factors Impact, Depth, and Site nested in Impact. Significant levels were indicated by the following symbols: * = P < 0.05; ** = P < 0.01; *** = P < 0.001.
3.2. Aggressive overgrowth (AgO)
Aggressive overgrowth (AgO) was significantly more prevalent at Totok Bay (TB; Table 3.5) and Coral Eye House reef (HR; Table 3.6) than at control sites.
The presence of AgO at TB was found in the following coral genera (Fig. 3.7-3.11): Acropora (prevalence 12.0 ± 6.4%), Anacropora (50.7 ± 5.6%), Montipora (34.5 ± 12.3%), Pachyseris (15.0 ± 10.7%), Pavona (50.0 ± 22.4%), Porites (56.9 ± 7.7%), Seriatopora (43.5 ± 8.2%), Turbinaria (66.7 ± 33.3%).
Prevalence of AgO was significant higher at HR compared to control site at 3 m wise test: P <0.05;), at 6 m wise test: P <0.01;) and at 9 m depth (pair-wise test: P<0.001;) (Fig 3.6). The presence of BL at HR was found in the following coral genera (Fig. 3.7-3.11): Acropora (19.4 ± 9.4%), Astreopora (25.0 ± 16.4%), Cyphastrea (75.0 ± 25.0%), Dipsastraea (4.1 ± 2.7%), Echinophyllia (25 ± 25%), Favites (20.0 ± 20.0%), Galaxea (35.0 ± 15.0%), Lobophyllia (28.6 ± 18.4%), Montipora (44.7 ± 12.8%), Mycedium (14.3 ± 14.3%), Pectinia (6.3 ± 6.3%), Porites (52.5 ± 12.1%), Seriatopora (36.1 ± 16.2%), Stylophora (46.4 ± 17.6%), Symphyllia
Source df SS MS Pseudo-F P (perm) perms P (MC)
Impact 1 34.4 34.4 73308 0.1033 20 0.0038 **
Depth 2 0.78419 0.39209 0.84015 0.512 9957 0.4947
Site (Impact) 3 1.2421 0.41402 1.7616 0.1714 9958 0.164
Impact x Depth 2 4.4055 2.2028 4.7199 0.0875 9966 0.0887
Depth x Site (Impact) 4 1.8668 0.4667 1.9857 0.1104 9957 0.1127
Residual 52 12.221 0.23502
Total 64 53.903
Source df SS MS Pseudo-F P (perm) perms P (MC)
Impact 1 3.8521 3.8521 8.2886 0.0504 20 0.0642
Depth 2 7.4556 3.7278 7.9876 0.0419* 9959 0.0392
Site (Impact) 3 1.2421 0.41402 1.3584 0.2615 9951 0.2596
Impact x Depth 2 15.446 7.723 16.548 0.0142* 9951 0.0118
Depth x Site (Impact) 4 1.8668 0.4667 1.5312 0.2084 9955 0.2112
Residual 52 15.85 0.3048
33
(27.8 ± 18.1%). In particular at 3 m AgO has been found in Dipsastraea, Echinophyllia, Galaxea, Montipora, Porites, Stylophora and Symphyllia, at 6 m in Acropora, Astreopora, Cyphastrea, Favites, Lobophyllia, Montipora, Pectinia, Porites, Seriatopora, Stylophora and Symphyllia and at 9 m AgO was found in Acropora, Astreopora, Cyphastrea, Galaxea, Montipora, Mycedium, Porites, Seriatopora, Stylophora and Symphyllia
Fig. 3.6 Prevalence of aggressive overgrowth (AgO) at the three depths (3 m, 6 m, 9 m) at each sampling sites. TB: Totok Bay; TW: Talawaan River; PS: Pantai Surabaya; HR: Coral Eye House Reef; BB: Batu Belah; BN: Batu Nona; TA: Talisei; TR: Tasik Ria Resort. Significant levels: * P<0.05, ** P<0.01; *** P<0.001.
34
Fig. 3.7 Prevalence of AgO in Acropora, Anacropora, Astreopora and Cyphastrea in the sampling site.
Fig. 3.8 Prevalence of AgO in Dipsastraea, Echinophyllia, Favites and Galaxea in the sampling site.
35
Fig. 3.9 Prevalence of AgO in Lobophyllia, Montipora, Mycedium and Pachyseris in the sampling site.
Fig. 3.10 Prevalence of AgO in Pavona, Pectinia, Porites and Seriatopora in the sampling site.
36
Fig. 3.11 Prevalence of AgO in Stylophora, Symphyllia and Turbinaria in the sampling site.
Table 3.5 PERMANOVA test on the prevalence of AgO at Totok Bay (TB) according to the factors Impact, Depth, and Site nested in Impact. Significant levels were indicated by the following symbols: * = P < 0.05; ** = P < 0.01; *** = P < 0.001.
Table 3.6 PERMANOVA test on the prevalence of AgO at Coral Eye House Reef (HR) according to the factors Impact, Depth, and their interaction (Impact x Depth). Significant levels were indicated by the following symbols: * = P < 0.05; ** = P < 0.01;
*** = P < 0.001.
Source df SS MS Pseudo-F P (perm) perms P (MC)
Impact 1 19.728 19.728 26.81 0.0496* 20 0.0125
Depth 2 4.3792 2.1896 2.2074 0.2188 9956 0.2229
Site (Impact) 3 1.9516 0.65053 1.5106 0.2204 9947 0.2246
Impact x Depth 2 11.188 5.594 5.6394 0.065 9965 0.0709
Depth x Site (Impact) 4 3.9678 0.99194 2.3034 0.0704 9950 0.0683
Residual 52 22.393 0.43064
Total 64 64.858
Source df SS MS Pseudo-F P (perm) perms P (MC)
Impact 1 31.316 31.316 60.367 0.0001*** 9811 0.0001
Depth 2 0.81254 0.40627 0.78315 0.4652 9939 0.4508
Impact x Depth 2 6.0687 3.0344 5.8492 0.0035** 9941 0.0052
Residual 59 30.607 0.51876
37
3.3. Galls caused by cryptochirid crabs (GA)
Galls caused by cryptochirid crabs (GA) was significantly more prevalent at Talawaan River (TW; Table 3.7), at Coral Eye House reef (HR; Table 3.8) and Pantai Surabaya (PS; Table 3.9) than at control sites.
The presence of GA at TW was found in the following coral genera (Fig 3.13-3.17): Astreopora (prevalence 25.0 ± 25.0%), Coeloseris (4.2 ± 4.2%), Dipsastraea (9.6 ± 5.6%), Echinopora (28.6 ± 18.4%), Favites (2.1 ± 2.1%), Goniastrea (7.3 ± 4.3%), Hydnophora (28.6 ± 18.4%), Leptoria (20.0 ± 20.0%), Montipora (100.0%, only one colony found), Platygyra (5.1 ± 5.1%), Pocillopora (33.3 ± 33.3%), Porites (30.4 ± 11.6%), Stylophora (14.3 ± 14.3%), Symphyllia (14.3 ± 14.3%).
Prevalence of GA was significant higher at HR at 6 m (pair-wise test: P<0.05;) and at 9 m depth (pair-wise test: P<0.001;) (Fig. 3.12). The presence of GA at HR was found in the following coral genera (Fig 3.15-3.17): Montipora (4.5 ± 4.5%), Porites (9.5 ± 7.4%), Seriatopora (96.4 ± 8.1%), Stylophora (50.0 ± 15.4%). The coral genera found with GA at these depths in HR site were: at 6 m in Porites, Seriatopora and Stylophora, at 9 m depth in Montipora, Seriatopora and Stylophora.
The presence of GA at PS was found in the following coral genera (Fig. 3.15-3.17): Pachyseris (50.0%, only two colonies in one transect were found), Pocillopora (100.0% ± only one colony found), Seriatopora (56.3 ± 21.3%), Stylophora (87.5 ± 12.5%).
38
Fig. 3.12 Prevalence of galls caused by cryptochirid crabs (GA) at the three depths (3 m, 6 m, 9 m) at each sampling sites. TB: Totok Bay; TW: Talawaan River; PS: Pantai Surabaya; HR: Coral Eye House Reef; BB: Batu Belah; BN: Batu Nona; TA: Talisei; TR: Tasik Ria Resort. Significant levels: * P<0.05, ** P<0.01; *** P<0.001.
39
Fig. 3.14 Prevalence of GA in Dipsastraea, Echinopora, Favites and Goniastrea in the sampling site.
Fig. 3.15 Prevalence of GA in Hydnophora, Leptoria, Montipora and Pachyseris in the sampling site.
40
Fig. 3.16 Prevalence of GA in Platygyra, Pocillopora, Porites and Seriatopora in the sampling site.
41
Table 3.7 PERMANOVA test on the prevalence of GA at Talawaan River (TW) according to the factors Impact, Depth, and their interaction (Impact x Depth). Significant levels were indicated by the following symbols: * = P < 0.05; ** = P < 0.01; *** = P < 0.001.
Table 3.8 PERMANOVA test on the prevalence of GA at Coral Eye House Reef (HR) according to the factors Impact, Depth, and their interaction (Impact x Depth). Significant levels were indicated by the following symbols: * = P < 0.05; ** = P < 0.01; *** = P < 0.001.
Table 3.9 PERMANOVA test on the prevalence of GA at Pantai Surabaya (PS) according to the factors Impact, Depth, and their interaction (Impact x Depth). Significant levels were indicated by the following symbols: * = P < 0.05; ** = P < 0.01;
*** = P < 0.001.
Source df SS MS Pseudo-F P (perm) perms P (MC)
Impact 1 14.901 14.901 33.202 0.0001*** 9832 0.0001
Depth 2 2.5576 1.2788 2.8495 0.063 9953 0.0638
Impact x Depth 2 2.8203 1.4102 3.1421 0.0577 9956 0.0498
Residual 59 26.479 0.44879
Total 64 45.089
Source df SS MS Pseudo-F P (perm) perms P (MC)
Impact 1 3.5136 3.5136 16.317 0.0003** 9817 0.0003
Depth 2 2.1494 1.0747 4.9909 0.0115* 9953 0.0094
Impact x Depth 2 1.4217 0.71086 3.3012 0.0444* 9953 0.0405
Residual 59 12.705 0.21533
Total 64 18.767
Source df SS MS Pseudo-F P (perm) perms P (MC)
Impact 1 5.5898 5.5898 25.243 0.0002*** 9828 0.0001
Depth 2 0.35191 0.17595 0.79458 0.4599 9943 0.4545
Impact x Depth 0 0 No test
Residual 51 11.294 0.22144
42
3.4. Bleaching (BL)
Bleaching (BL) was significantly more prevalent at Totok Bay (TB; Table 3.10) and Talawaan River (TW; Table 3.11) than at control sites.
Prevalence of BL was significant higher at all depths at TB compared to control site: 3m (pair-wise test: P<0.001), 6 m (pair-wise test: P<0.001) and at 9 m depth (pair-wise test: P<0.01;) (Fig. 3.18). The presence of BL at TB was found in the following coral genera (Fig 3.19-3.21): Anacropora (prevalence 5.0 ± 5.0%), Fungia (5.3 ± 2.7%), Seriatopora (3.5 ± 10.1%). In particular at 3 m BL has been found in Fungia and Seriatopora, at 6 m BL was found in Anacropora, Fungia and Seriatopora and at 9 m in Fungia and Seriatopora.
Prevalence of BL was significant higher at TW at 3 m (pair-wise test: P <0.05) and at 9 m depth (pair-wise test: P <0.01;) (Fig. 3.18). The presence of BL at TW was found in the following coral genera (Fig 3.19-3.21): Ctenactis (3.7 ± 4.0%), Dipsastraea (3.8 ± 3.8%), Fungia (5.2 ± 3.1%), Goniastrea (3.8 ± 4.0%), Herpolitha (7.1 ± 7.1%), Lobophyllia (1.3 ± 1.3%), Merulina (3.6 ± 4.1%), Platygyra (3.1 ± 3.1%). The genus found with BL at three depths at TW were: at 3 m in Lobophyllia and Platygyra and at 9 m in Ctenactis, Dipsatraea, Fungia, Goniastrea and Merulina.
43
Fig. 3.18 Prevalence of bleaching (BL) at the three depths (3 m, 6 m, 9 m) at each sampling sites. TB: Totok Bay; TW: Talawaan River; PS: Pantai Surabaya; HR: Coral Eye House Reef; BB: Batu Belah; BN: Batu Nona; TA: Talisei; TR: Tasik Ria Resort. Significant levels: * P<0.05, ** P<0.01; *** P<0.001.
Fig. 3.19 Prevalence of BL in Anacropora, Ctenactis, Dipsastrea and Fungia in the sampling site.
44
Fig. 3.20 Prevalence of BL in Goniastrea, Herpolitha, Lobophyllia and Merulina in the sampling site.
45
Table 3.10 PERMANOVA test on the prevalence of BL at Totok Bay (TB) according to the factors Impact, Depth, and their interaction (Impact x Depth). Significant levels were indicated by the following symbols: * = P < 0.05; ** = P < 0.01; *** = P < 0.001.
Table 3.11 PERMANOVA test on the prevalence of BL at Talawaan River (TW) according to the factors Impact, Depth, and their interaction (Impact x Depth). Significant levels were indicated by the following symbols: * = P < 0.05; ** = P < 0.01; *** = P < 0.001.
3.5. Other diseases and signs of compromised health
Skeletal eroding band (SEB) and brown band (BrB) were not found on any of the reefs surveyed. Both black band disease (BBD) and atramentous necrosis (AtN) were found only in Totok bay, the most impacted site. The BBD (Fig 3.22a) was only found on two colonies of Montipora and one colony of Pachyseris. Similarly, AtN (Fig 3.22b) was found only on two colonies of Seriatopora and two colonies of Turbinaria.
Particularly interesting are crown of thorns starfish (COTS) and trematodiasis (TR) that were found only in a control site, Talisei (TA). COTS was found in one colony of Acropora and one colony of Physogyra, while TR was found only in one colony of Porites.
Source df SS MS Pseudo-F P (perm) perms P (MC)
Impact 1 1.4983 1.4983 61.92 0.0001*** 9851 0.0001
Depth 2 0.43577 0.21789 9.0046 0.0004*** 9956 0.0006
Impact x Depth 2 0.30931 0.15466 6.3915 0.005** 9950 0.0033
Residual 59 1.4276 0.0242
Total 64 3.444
Source df SS MS Pseudo-F P (perm) perms P (MC)
Impact 1 0.53384 0.53384 20.88 0.0003*** 9858 0.0001
Depth 2 0.18642 9.32E-02 3.6457 0.0361* 9954 0.0319
Impact x Depth 2 0.21171 0.10586 4.1403 0.0279* 9950 0.0229
Residual 59 1.5084 2.56E-02
46
Fig. 3.22 Black band disease (BBD; A) in Montipora and atramentous necrosis (AtN; B) in Montipora.
Fig. 3.23 Gastropod corallivory (GC; A), bleaching (BL; B), aggressive overgrowth (AgO; C) and galls caused by cryptochirid crabs (GA; D) were significant at impact sites compared to control sites.
47
4. Discussion
Monitoring for coral reef health, human pressures and levels of contamination in marine organisms and their habitats is necessary to understand the possible effects of human activities on marine biodiversity. Some studies have been carried out on possible marine pollution downstream to mining in North Sulawesi (Caras and Pasternak, 2009; Edinger et al., 2007; Ercadi, 2018; Lasut et al., 2010; Shepherd et al., 2018; Tamburini, 2018). However, the present study represents the first assessment of the possible impact of mining activities on the health of coral reefs in this region.
Two types of mining activities have been considered: industrial gold mine (Pantai Surabaya site), which use cyanide-based process for gold extraction, and the artisanal and small-scale gold mines ASGMs (Totok Bay e Talawaan River sites), which still use mercury amalgam to extract gold from ores. Moreover, another putatively impacted site was chosen in Bangka Island (Coral Eye House Reef Site), an industrial mining site in preparation where the extraction works have never been started thanks to protests by the local hinabitants. As control, four sites were randomly chosen at least 10 km from any possible direct mining pollution.
Overall, four signs of compromised coral health were significantly more abundant at sites affected by mines, compared to control sites. Gastropod corallivory, aggressive overgrowth and skeletal deformations caused by pyrgomatid barnacle may witness the increase susceptibility of corals from the aggression of other organisms at some affected areas, while an increasing of bleaching occurrence appeared as a result of the pollution generated by ASGMs.
Some gastropods are important predators of corals and can compromise their health (Bessey et al., 2018; Nicolet et al., 2013; Raymundo et al., 2008). A high density of corallivorous activities have the potential to devastate vast areas of coral reefs (Shafir et al., 2008; Turner, 1994), but they can also be an important vehicle of diseases (Dalton and Godwin, 2006; Nicolet et al., 2013, 2018; Raymundo et al., 2008; Williams and Miller, 2005). The two most widespread genera of coral predators in the Indo-Pacific region are Drupella and Coralliophilia (Raymundo et al., 2008).
48
In this study, gastropod corallivory (GC) was significantly higher at Totok Bay (TB) and at Coral Eye House Reef (HR) compared to control sites. An higher abundance of GC at Coral Eye compared to other sites in the Gangga-Bangka archipelago was also find in a previous study, conducted five years before (Ponti et al., 2016). An experimental study showed that Acropora valida stressed by low temperatures is more susceptible to attack from Drupellarugosa (Tsang and Ang, 2015). Although there is no experimental evidence of an increase in Drupella abundance due to pollution, the results of this and previous studies suggest that stressed corals, albeit for different reasons, may be more susceptible to this predator. These gastropods prefer the acroporids (Cumming, 1999; Moerland et al., 2016; Schoepf et al., 2010; Turner, 1994), but they have been found in different genera and different morphologies of corals at TB and HR (e.g. Acropora, Anacropora, Montipora, Echinopora, Pavona, Porites, Seriatopora, Turbinaria, Cyphastrea, Goniastrea, Halomitra, Pocillopora).
Aggressive overgrowth (AgO) of live coral tissue by algae and sponges lead to the death of the coral tissue (Raymundo et al., 2008; Wild et al., 2014). Several studies have confirmed that algae contacts are harmful to corals, especially when filamentous algae are involved (Wild et al., 2014) but also when sponges are involved (Elliott et al., 2016a, 2016b; Turicchia et al., 2018). The overgrowth of sponges on corals has been seen to evolve into outbreaks due to pollution stress (Rützler and Muzik, 1993), iron enrichment in water (Schils, 2012) and the decrease of the predators of sponges, sponge-eating fishes (Pawlik, 1998). When there is a strong increase in the presence of benthic algae (Andrefouet and Guzman, 2005; Hughes, 1994), a shift may also occur from scleractinian corals to other invertebrates (Bak et al., 1996; Maliao et al., 2008) or octocorals. Some studies have shown that the increase of algal cover is often positively correlated whith coral diseases (Goreau et al., 1998; Harvell et al., 1999, 2004; Hayes and Goreau, 1998).
Aggressive overgrowth was significantly higher at Totok Bay and at Coral Eye House Reef. Metals like copper, zinc, iron, molybdenum and vanadium are essential in trace amounts for macroalgae (Bothe, 2011; Moenne et al., 2016; Theil and Raymond, 1994). Mining or dredging for the construction of mines releases various metals present in the volcanic rocks. This may explain the highest algae growth on
49
live corals downstream mining sites. However, the algae and sponges overgrowth can also occur when there is a lack of predators that reduce their growth (Nyström and Folke, 2001). Therefore, it is necessary to carry out further correlation studies between algae-spongy overgrowth, associated predators and metals-nutrients in seawater.
Another important result was the higher prevalence of galls caused by cryptochirid crab (GA) on corals. A significantly higher prevalence of GA was found at Totok Bay, Coral Eye House Reef and Pantai Surabaya. Interestingly, the prevalence of GA at the most polluted site (TB) was not significantly different from the control sites. Cryptochirid crabs are obligate symbionts who occupy the skeleton of scleractinian coral forming a gall or a pit in their host’s tissue (Wei et al., 2013). Coral acts as a protection and food source for these crabs. However, by feeding on coral tissues and by require coral to spend energy for the abnormal growth of the skeleton to create the galls (Simon-Blecher and Achituv, 1997; Terrana et al., 2016), the symbiotic crabs may have a negative effect on the coral host by reducing its growth rate (Simon-Blecher et al., 1999) (Nogueira et al., 2014). In addition to having a direct effect on the host, the symbionts can transmit pathogenic microbial communities and diseases (Pratte and Richardson, 2016; Shelyakin et al., 2018).
In Ponti et al., 2016 a high abundance of galls caused by cryptochirid crab was seen at two sites related to human disturbances: Sipi, the location of the under-preparation metal mine, and at Pearl Garden,the site of an old pearl farm.
The results of this study and of Ponti et al., 2016 suggest a possible increase of GA in relation to anthropogenic disturbances.
Bleaching prevalence resulted higher at Totok Bay and Talawaan River sites compared to control sites. The coral bleaching is a stress response that causes the loss of the symbiotic algae (Symbiodinium) and/or their photosynthetic pigments with the result that the white skeleton of calcium carbonate becomes visible through the transparent tissue (Coles and Brown, 2003). In some studies, it has been highlighted that the presence of high concentrations of heavy metals can also induce the loss of Symbiodinium, degradation of photosynthetic pigments (Harland and Brown, 1989) or alteration of physiological responses (Bielmyer-Fraser et al., 2018). At Totok Bay the prevalence of bleaching had a different intensity at three
50
depths: higher at 3 m and 6 m than to 9 m, while at Talawaan River the bleaching was significantly higher at 3 and 9 m. Difference among depths may results from the interactions of a range of factors, including different solar radiation (Brown and Dunne, 2015), temperature (Brown and Dunne, 2016) and pollutants (Kwok et al., 2016; Van Oppen and Lough, 2018).
In conclusion, this study shows that corals affected by mining activities are generally more vulnerable and susceptible to the aggression of other organisms such as algae, gastropods and crabs. Moreover, the increase in coral bleaching in the worst conditions, i.e. at the two most polluted sites (Totok Bay and Talawaan River), albeit affected by different mining processes and since different time, may reveals alterations on the symbiotic association in the coral holobiont communities.
In agreement with Ponti et al. (2016), the corals in the study area were generally in good condition, however some alterations in sites affected by mining indicate that these activities, if carried out without adequate precautions in limiting pollution, in the long term can alter local coral reefs health.
51
Acknowledgments
I would like to give a special thanks to all staff of the Coral Eye, Marco Segre, Ilaria Reggi, Marco Perin and Anna Clerici and to the crew for hosting me and giving me the opportunity to do this thesis in an incredible place, for all the support and help I needed during the time I spent in Indonesia. I thank Professor Markus T. Lasut of Sam Ratulangi University (Manado) for for the help with all the administrative difficulties and for agreeing to follow my work. I would also like to thanks Professor Massimo Ponti, the project developer, and Eva Turicchia for the great help they have given me, not only during the organization of fieldwork, but also during the writing of thesis. Thanks to the precious help of Gianfranco Rossi for his help in taxonomic recognition of corals.
I would like to thank Riccardo Virgili for his support at the most difficult moments and for all the transects he helped me to do, without wich I could never have done all this work.
A special thanks to all the wonderful people I met all along these years that have made me discover and share the Marine World. A special thanks to TM for sharing our passions and all the "Disagio" in these two years.
Finally I thank my family, with a special thanks to Vanna, for the determination that taught me to have and Ketty for being the sister I never had.
This thesis was funded by a scholarship provided by Alma Mater Studiorum and by Coral Eye that hosted me for three months. …by the way the world is flat
“Even if you never have the chance to see or touch the ocean, the ocean touches you with every breath you take, every drop of water you drink, every bite you consume.
Everyone, everywhere is inextricably connected to and utterly dependent upon the existence of the sea”
53
REFERENCES
Acheampong, M.A., Meulepas, R.J.W., and Lens, P.N.L. (2010). Removal of heavy metals and cyanide from gold mine wastewater. J. Chem. Technol. Biotechnol. 85, 590–613.
Adger, W.N. (2005). Social-ecological resilience to coastal disasters. Science 309, 1036–1039.
Anderson, M.J., and Robinson, J. (2001). Permutation tests for linear models. Aust. N. Z. J. Stat. 43, 75–88.
Anderson, M., Gorley, R.N., and Clarke, R.K. (2008). Permanova+ for Primer: Guide to Software and Statisticl Methods (Primer-E Limited).
Andrefouet, S., and Guzman, H.M. (2005). Coral reef distribution, status and geomorphology–biodiversity relationship in Kuna Yala (San Blas) archipelago, Caribbean Panama. Coral Reefs 24, 31–42.
Aspinall, C., and Eng, P. (2001). Small-scale mining in Indonesia. Int. Inst. Environ. Dev. Min. Miner. Sustain. Dev. Rep. 30.
Bak, R.P.M., Lambrechts, D.Y.M., Joenje, M., Nieuwland, G., and Van Veghel, M.L.J. (1996). Long-term changes on coral reefs in booming populations of a competitive colonial ascidian. Mar. Ecol. Prog. Ser. 133, 303–306.
Ban, S.S., Graham, N.A.J., and Connolly, S.R. (2014). Evidence for multiple stressor interactions and effects on coral reefs. Glob. Change Biol. 20, 681–697.
Beeden, R., Willis, B.L., Raymundo, L.J., Page, C.A., and Weil, E. (2008). Underwater cards for assessing coral health on Indo-Pacific reefs. Coral Reef Target. Res. Capacity Build. Manag. Program Currie Commun. Melb. 22.
Bessey, C., Babcock, R.C., Thomson, D.P., and Haywood, M.D.E. (2018). Outbreak densities of the coral predator Drupella in relation to in situ Acropora growth rates on Ningaloo Reef, Western Australia. Coral Reefs 37, 985–993.
Bielmyer-Fraser, G.K., Patel, P., Capo, T., and Grosell, M. (2018). Physiological responses of corals to ocean acidification and copper exposure. Mar. Pollut. Bull. 133, 781–790.
Blackwood, G.M., and Edinger, E.N. (2007). Mineralogy and trace element relative solubility patterns of shallow marine sediments affected by submarine tailings disposal and artisanal gold mining, Buyat-Ratototok district, North Sulawesi, Indonesia. Environ. Geol. 52, 803–818.
Blanchette, M.C., Hynes, T.P., Kwong, Y.T.J., Anderson, M.R., Veinott, G., Payne, J.F., Stirling, C., and Sylvester, P.J. (2001). A chemical and ecotoxicological assessment of the impact of marine tailings disposal. In Tailings and Mine Waste, pp. 323–331.
54
Bose-O’Reilly, S., Drasch, G., Beinhoff, C., Rodrigues-Filho, S., Roider, G., Lettmeier, B., Maydl, A., Maydl, S., and Siebert, U. (2010). Health assessment of artisanal gold miners in Indonesia. Sci. Total Environ. 408, 713–725.
Bothe, H. (2011). Plants in heavy metal soils. In Detoxification of Heavy Metals, (Springer), pp. 35–57.
Bourne, D.G., Garren, M., Work, T.M., Rosenberg, E., Smith, G.W., and Harvell, C.D. (2009). Microbial disease and the coral holobiont. Trends Microbiol. 17, 554–562. Brown, B.E., and Dunne, R.P. (2015). Coral bleaching. Dis. Coral 266–283.
Brown, B.E., and Dunne, R.P. (2016). Coral Bleaching: the roles of sea temperature and solar radiation. Cheryl M Woodley Craig Andrew W Bruc Ner James W Porter Sylvia B Galloway Eds 266–283.
Bruckner, A.W., and Bruckner, R.J. (1997). Outbreak of coral disease in Puerto Rico. Coral Reefs 16, 260–260.
Bruno, J.F., Petes, L.E., Drew Harvell, C., and Hettinger, A. (2003). Nutrient enrichment can increase the severity of coral diseases. Ecol. Lett. 6, 1056–1061. Bryan, G.W., and Langston, W.J. (1992). Bioavailability, accumulation and effects of heavy metals in sediments with special reference to United Kingdom estuaries: a review. Environ. Pollut. 76, 89–131.
Budd, A.F., Fukami, H., Smith, N.D., and Knowlton, N. (2012). Taxonomic classification of the reef coral family Mussidae (Cnidaria: Anthozoa: Scleractinia). Zool. J. Linn. Soc. 166, 465–529.
Burke, L., Reytar, K., Spalding, M., and Perry, A. (2011). Reefs at risk revisited. Caras, T., and Pasternak, Z. (2009). Long-term environmental impact of coral mining at the Wakatobi marine park, Indonesia. Ocean Coast. Manag. 52, 539–544. Carpenter, K.E., Abrar, M., Aeby, G., Aronson, R.B., Banks, S., Bruckner, A., Chiriboga, A., Cortes, J., Delbeek, J.C., DeVantier, L., et al. (2008). One-third of reef-building corals face elevated extinction risk from climate change and local impacts. Science 321, 560–563.
Coles, S.L., and Brown, B.E. (2003). Coral bleaching—capacity for acclimatization and adaptation.
Cordy, P., Veiga, M.M., Salih, I., Al-Saadi, S., Console, S., Garcia, O., Mesa, L.A., Velásquez-López, P.C., and Roeser, M. (2011). Mercury contamination from artisanal gold mining in Antioquia, Colombia: The world’s highest per capita mercury pollution. Sci. Total Environ. 410–411, 154–160.
Cumming, R.L. (1999). Predation on reef-building corals: multiscale variation in the density of three corallivorous gastropods, Drupella spp. Coral Reefs 18, 147– 157.
55
Dalton, S.J., and Godwin, S. (2006). Progressive coral tissue mortality following predation by a corallivorous nudibranch (Phestilla sp.). Coral Reefs 25, 529–529. De Lacerda, L.D., and Salomons, W. (2012). Mercury from gold and silver mining: a chemical time bomb? (Springer Science & Business Media).
DeVantier, L., and Turak, E. (2004). Managing marine tourism in Bunaken National Park and adjacent waters, North Sulawesi, Indonesia. Proj. Rep. Nat. Resour. Manag. III Program’s Areas Agric. Team Jkt. Op Mal Use Resour. Biodivers. Qual. Proper Spa Al Des.
Edinger, E. (2012). Gold Mining and Submarine Tailings Disposal: Review and Case Study. Oceanography 25, 184–199.
Edinger, E.N., Siregar, P.R., and Blackwood, G.M. (2007). Heavy metal concentrations in shallow marine sediments affected by submarine tailings disposal and artisanal gold mining, Buyat-Ratototok district, North Sulawesi, Indonesia. Environ. Geol. 52, 701–714.
Edinger, E.N., Azmy, K., Diegor, W., and Siregar, P.R. (2008). Heavy metal contamination from gold mining recorded in Porites lobata skeletons, Buyat-Ratototok district, North Sulawesi, Indonesia. Mar. Pollut. Bull. 56, 1553–1569. Ekino, S., Susa, M., Ninomiya, T., Imamura, K., and Kitamura, T. (2007). Minamata disease revisited: An update on the acute and chronic manifestations of methyl mercury poisoning. J. Neurol. Sci. 262, 131–144.
Elliott, J., Patterson, M., Summers, N., Miternique, C., Montocchio, E., and Vitry, E. (2016a). How does the proliferation of the coral-killing sponge Terpios hoshinota affect benthic community structure on coral reefs? Coral Reefs 35, 1083–1095. Elliott, J., Patterson, M., Vitry, E., Summers, N., and Miternique, C. (2016b). Morphological plasticity allows coral to actively overgrow the aggressive sponge Terpios hoshinota (Mauritius, Southwestern Indian Ocean). Mar. Biodivers. 46, 489–493.
Ellis, D.V., Poling, G.W., and Baer, R.L. (1995). Submarine tailings disposal (STD) for mines: An introduction. Mar. Georesources Geotechnol. 13, 3–18.
Ercadi, R. (2018). Impact of gold mining activities on Polycarpa aurata in the North Sulawesi, Indonesia. (Thesis in Marine Biology at the University of Bologna).
Fabricius, K.E. (2005). Effects of terrestrial runoff on the ecology of corals and coral reefs: review and synthesis. Mar. Pollut. Bull. 50, 125–146.
Falkowski, P.G., Dubinsky, Z., Muscatine, L., and McCloskey, L. (1993). Population control in symbiotic corals. BioScience 43, 606–611.
Ferrier-Pagès, C., Schoelzke, V., Jaubert, J., Muscatine, L., and Hoegh-Guldberg, O. (2001). Response of a scleractinian coral, Stylophora pistillata, to iron and nitrate enrichment. J. Exp. Mar. Biol. Ecol. 259, 249–261.