168
E
levated blood pressure (BP) is a well-established risk
fac-tor for cardiovascular events, and lowering elevated BP
has been demonstrated to reduce risk.
1,2However, post hoc
analyses of randomized controlled trials
3,4and observational
studies
5,6have shown that—in hypertensive patients with
coro-nary artery disease (CAD)—the relationship between BP and
cardiovascular events is J-shaped, particularly for diastolic BP,
with an increased risk of cardiovascular events (except stroke)
among patients with diastolic BP <70 mm Hg.
The increased cardiovascular risk observed at low diastolic
BP may be a direct consequence of altered myocardial
perfu-sion.
6–8However, a causal link between low diastolic BP and
cardiovascular events has not been demonstrated in randomized
controlled trials. Rather, such trials have shown no benefit
9,10or
a decreased risk
11in the lowest BP groups, although it should
be borne in mind that the mean BP in the lowest BP subgroup
was never below the inflection point of the J-curve when
con-sidering office BP levels, either measured or extrapolated.
12,13Abstract—Observational studies have shown a J-shaped relationship between diastolic blood pressure (BP) and cardiovascular
events in hypertensive patients with coronary artery disease. We investigated whether the increased risk associated with
low diastolic BP reflects elevated pulse pressure (PP). In 22 672 hypertensive patients with coronary artery disease
from the CLARIFY registry (Prospective Observational Longitudinal Registry of Patients With Stable Coronary Artery
Disease), followed for a median of 5.0 years, BP was measured annually and averaged. The relationships between PP
and diastolic BP, alone or combined, and the primary composite outcome (cardiovascular death or myocardial infarction)
were analyzed using multivariable Cox proportional hazards models. Adjusted hazard ratios for the primary outcome
were 1.62 (95% confidence interval [CI], 1.40–1.87), 1.00 (ref), 1.07 (95% CI, 0.94–1.21), 1.54 (95% CI, 1.32–1.79), and
2.34 (95% CI, 1.95–2.81) for PP<45, 45 to 54 (reference), 55 to 64, 65 to 74, and ≥75 mm Hg, respectively, and 1.50 (95%
CI, 1.31–1.72), 1.00 (reference), and 1.58 (95% CI, 1.42–1.77) for diastolic BPs of <70, 70 to 79 (ref), and ≥80 mm Hg,
respectively. In a cross-classification analysis between diastolic BP and PP, the relationship between diastolic BP and the
primary outcome remained J-shaped when the analysis was restricted to patients with the lowest-risk PP (45–64 mm Hg),
with adjusted hazard ratios of 1.53 (95% CI, 1.27–1.83), 1.00 (ref), and 1.54 (95% CI, 1.34–1.75) in the <70, 70 to 79
(reference), and ≥80 mm Hg subgroups, respectively. The J-shaped relationship between diastolic BP and cardiovascular
events in hypertensive patients with coronary artery disease persists in patients within the lowest-risk PP range and is
therefore unlikely to be solely the consequence of an increased PP reflecting advanced vascular disease.
Clinical Trial Registration—URL:
http://www.clarify-registry.com
. Unique identifier: ISRCTN43070564.
(Hypertension. 2018;71:168-176. DOI: 10.1161/HYPERTENSIONAHA.117.10204.)
•
Online Data Supplement
Key Words: blood pressure
■coronary artery disease
■hypertension
■myocardial infarction
■
proportional hazards models
Received August 17, 2017; first decision August 29, 2017; revision accepted October 6, 2017.
From the Cardiology and Physiology Departments, Département Hospitalo-Universitaire FIRE, Assistance Publique-Hôpitaux de Paris, Hôpital Bichat and Paris Diderot University, Sorbonne Paris Cité, France (E.V.-P., P.G.S.); INSERM U1149, Centre de Recherche sur l’Inflammation, Paris, France (E.V.-P.); Robertson Centre for Biostatistics, University of Glasgow, United Kingdom (N.G., I.F.); Centro Cardiologico Universitario di Ferrara, University of Ferrara, and Maria Cecilia Hospital, GVM Care & Research, Cotignola (RA), Italy (R.F.); National Heart and Lung Institute, Imperial College, Institute of Cardiovascular Medicine and Science, Royal Brompton Hospital, London, United Kingdom (K.M.F., P.G.S.); Department of Medicine, Montreal Heart Institute, Université de Montreal, Canada (J.-C.T.); Medical University of Silesia, School of Medicine in Katowice, Department of Cardiology and Structural Heart Disease, Poland (M.T.); Emergency Cardiology Department, Institute of Cardiology, Kiev, Ukraine (A.P.); Brigham and Women’s Hospital Heart and Vascular Center, Harvard Medical School, Boston, MA (D.L.B.); and French Alliance for Cardiovascular Trials, an F-CRIN network, INSERM U1148, Laboratory for Vascular Translational Science, Paris, France (P.G.S.).
*A list of all CLARIFY Investigators is given in the online-only Data Supplement.
This article was sent to Marc L. De Buyzere, Guest Editor, for review by expert referees, editorial decision, and final disposition.
The online-only Data Supplement is available with this article at http://hyper.ahajournals.org/lookup/suppl/doi:10.1161/HYPERTENSIONAHA. 117.10204/-/DC1.
Correspondence to P. Gabriel Steg, Department of Cardiology, Hôpital Bichat, 46 Rue Henri Huchard, Paris 75018, France. E-mail [email protected]
Relationships Between Components of Blood Pressure and
Cardiovascular Events in Patients with Stable Coronary
Artery Disease and Hypertension
Emmanuelle Vidal-Petiot, Nicola Greenlaw, Ian Ford, Roberto Ferrari, Kim M. Fox,
Jean-Claude Tardif, Michal Tendera, Alexander Parkhomenko, Deepak L. Bhatt, P. Gabriel Steg;
for the CLARIFY Investigators*
© 2017 American Heart Association, Inc.
Hypertension is available at http://hyper.ahajournals.org DOI: 10.1161/HYPERTENSIONAHA.117.10204
Alternatively, the observed association may not be causal, but
rather reflect reverse causality, whereby low diastolic BP would
be an epiphenomenon of underlying poor health, itself leading
to increased morbidity and mortality.
14,15Although indirect
evi-dence argues against reverse causality being the sole or major
explanation for the J-curve,
5,14irrefutable evidence will require
future dedicated randomized interventional trials. Last, the
asso-ciation between low diastolic BP and cardiovascular events may
be an epiphenomenon of increased pulse pressure (PP), itself a
cardiovascular risk marker,
16–18which is associated with
dimin-ished diastolic BP in patients with stiffened large arteries. Among
2207 patients from a hypertension control program, Madhavan
et al
19reported a J-shaped relation of diastolic BP to
myocar-dial infarction that occurred only among patients with a PP>63
mm Hg. Similarly, Kannel et al
20showed—in 7798 subjects from
the Framingham study and offspring cohort—that the increased
risk observed at low diastolic BP was confined to patients with
increased systolic BP and, therefore, increased PP, whereas the
relationship between diastolic BP and outcome remained linear
among patients with systolic BP<140 mm Hg. More recently,
Franklin et al
21observed in 791 individual with a previous
cardio-vascular event from the Framingham study that a diastolic BP<70
mm Hg was associated with a greater risk than a diastolic BP of
70 to 79 mm Hg only in patients with PP≥68 mm Hg.
The purpose of this study was to explore whether the J-curve
observed for diastolic BP is restricted to patients with
concomi-tant high systolic BP or PP, or whether it persists for patients
with systolic BP and PP values within the lowest-risk range. We
assessed the relationship between PP or diastolic BP and
car-diovascular outcomes in a population of CAD patients treated
for hypertension from the CLARIFY registry (Prospective
Observational Longitudinal Registry of Patients With Stable
Coronary Artery Disease). We then performed
cross-classifica-tions to assess the relacross-classifica-tionship between diastolic BP and
out-comes, stratified by PP or systolic BP subgroup.
Methods
Details of the CLARIFY registry have been reported.5,22 Briefly, 32 703 outpatients with stable CAD were recruited in 45 countries between November 2009 and June 2010. Exclusion criteria were hospital admission for cardiovascular reasons in the past 3 months, planned revascularization, or any health condition compromising 5-year follow-up, including severe other cardiovascular diseases (eg, advanced heart failure, severe valve disease, or history of valve repair or replacement). Patients received standard clinical care; enrollment did not mandate any specific treatment or procedure.
Data were collected using standardized electronic case report forms at baseline and at every yearly visit for up to 5 years. At each yearly visit, symptoms, clinical examination, results of the main clinical and biological tests, treatment, and clinical outcomes were recorded; of-fice BP was measured in seated subjects after a rest of 5 minutes, using the same arm throughout the study, with no prespecified device.
This analysis was restricted to patients treated for hypertension (Figure S1 in the online-only Data Supplement), defined by treated hypertension on the baseline form and the use of at least 1 antihypertensive drug.
The study was performed in accordance with the Declaration of Helsinki. Local ethical approval was obtained in all countries. All patients gave written informed consent. This study is registered with clarify-registry.com, number ISRCTN43070564.
BP Subgroups
PP was calculated as the difference between systolic BP and diastolic BP. Mean arterial pressure was calculated as diastolic BP+1/3 PP.
Analyses were performed using the arithmetic mean of all BP values measured throughout follow-up, from the baseline visit to the visit before an event (the event depending on the outcome), or all available visits if no event occurred.
For the relationship between a single BP component and outcome, patients were categorized into 5 subgroups by 10-mm Hg increments, from <45 to ≥75 mm Hg for PP (with the 45–54-mm Hg subgroup as the reference), and from <60 to ≥90 mm Hg for diastolic BP (with the 70–79-mm Hg subgroup as the reference).
For cross-classification analyses, each BP component was divided in 3 subgroups, defined from the relationship with the primary outcome, using the thresholds below and above which event rates increased com-pared with the reference group: <70, 70 to 79 (reference), and ≥80 mm Hg for diastolic BP, <45, 45 to 64 (reference), and ≥65 mm Hg for PP, and <120, 120 to 139 (reference), and ≥140 mm Hg for systolic BP. For systolic BP, these thresholds were defined from the previously es-tablished relationship between systolic BP and cardiovascular events in this population.5 In the cross-classification analyses, patients were fur-ther categorized into 1 of 9 groups using the combination of the 3-level diastolic BP groupings and the 3-level PP or systolic BP groupings.
Study Outcomes
The primary outcome was the composite of cardiovascular death or myocardial infarction. Secondary outcomes included cardiovascular death, myocardial infarction, stroke, and hospitalization for heart fail-ure. For patients with multiple events, the time to the first applicable event was considered in each analysis.
Statistical Analyses
Baseline characteristics are summarized according to the average PP categories before a primary outcome. Continuous variables are pre-sented as mean±SD or medians (interquartile ranges), depending on the distribution of the data; categorical data are presented as numbers and percentages. Comparisons between the average PP categories were made using either 1-way ANOVA or the Kruskal–Wallis test for continuous data, depending on the distribution of the data, or the χ2 test for categorical data.
Cox proportional hazards models, both adjusted and unadjusted, were used to evaluate the relationship between BP categories (either for a single BP component or for combined BP components) and outcomes.
Covariates used for multivariable adjustment were selected a priori as potential confounders and included (model 1) age, sex, geographic region, smoking status, myocardial infarction, percutaneous coronary intervention, coronary artery bypass grafting, diabetes mellitus, low- and high-density lipoprotein cholesterol levels, body mass index, glo-merular filtration rate, peripheral artery disease, hospitalization for or symptoms of heart failure, left ventricular ejection fraction, ethnicity, stroke, transient ischemic attack, and baseline medications (aspirin, statins, angiotensin-converting enzyme inhibitors, angiotensin-re-ceptor blockers, β-blockers, calcium channel blockers, diuretics, and other antihypertensive medications).
Analyses performed on PP as a single BP component were also adjusted for mean arterial pressure in a separate model. Analyses per-formed on diastolic BP as a single BP component were also adjusted for PP in a separate model.
No imputation was performed for missing data. Covariates with a large amount of missing data were categorized, including a category for missing data to minimize the loss of data in the analysis.
The relationship between PP subgroups and all outcomes was further assessed after excluding patients with heart failure, as de-fined by previous hospitalization for heart failure, symptoms of heart failure (then excluded from covariates), or a left ventricular ejection fraction <45%.
The models were further adjusted by including an interaction term between diastolic BP category and PP category or systolic BP cat-egory to determine whether any observed relationship was consistent across PP and systolic BP subgroups, respectively.
In the event of significant interactions with diastolic BP, the re-lationship of diastolic BP and outcome was further examined in the relevant PP or systolic BP subgroups.
Statistical analyses were performed using SAS (version 9.3). A P value <0.05 was used to signify statistical significance using 2-sided testing with no correction for multiple comparisons.
Results
Baseline characteristics of the patients in the total population
(22 672 patients with CAD and hypertension) and by subgroups
of PP are reported in Table 1 and Table S1 (baseline
medica-tions). Mean age was 65.2±10.0 years, 17 019 (75.1%) were men,
and 7591 (33.5%) had diabetes mellitus. Mean systolic BP was
133.7±16.7 mm Hg, mean diastolic BP was 78.2±10.1 mm Hg,
and mean PP was 55.4±14.0 mm Hg. Compared with patients
with low PP, those with higher PP tended to be older, more likely
to be women, have diabetes mellitus, be nonsmokers, less likely
to have had a myocardial infarction or percutaneous coronary
intervention, had less symptoms of heart failure, and had a higher
prevalence of stroke. Baseline characteristics of the patients
by subgroups of systolic and diastolic BP have been reported.
5Pulse Pressure
After a median (interquartile range) follow-up of 5.0 (4.5–5.1)
years, the primary outcome had occurred in 1746 patients
(7.7%). Cardiovascular death occurred in 1209 patients (5.3%),
myocardial infarction (fatal/nonfatal) in 827 (3.6%), stroke
(fatal/nonfatal) in 526 (2.3%), and hospital admission for heart
failure in 1306 (5.8%). Event rates and adjusted hazard ratios
Table 1. Demographic and Baseline Characteristics of the Patients, for the Total Population and Each Average On-Treatment PP Subgroup Parameter n Total Population (n=22 672) Average PP Categories P Value <45 mm Hg (n=3088) 45–54 mm Hg (n=9013) 55–64 mm Hg (n=6907) 65–74 mm Hg (n=2611) ≥75 mm Hg (n=1053) Age, y 22 666 65.2±10.0 61.0±10.3 63.4±9.8 66.9±9.4 69.2±8.7 71.5±8.6 <0.0001 Male 22 672 17 019 (75.1) 2505 (81.1) 6974 (77.4) 5070 (73.4) 1826 (69.9) 644 (61.2) <0.0001 BMI, kg/m2 22 654 27.7 (25.2–30.9) 27.2 (24.7–30.1) 27.8 (25.4–30.9) 27.8 (25.1–31.1) 27.8 (25.2–31.2) 27.6 (24.8–30.8) <0.0001 Diabetes mellitus 22 670 7591 (33.5) 818 (26.5) 2750 (30.5) 2461 (35.6) 1089 (41.7) 473 (44.9) <0.0001 Smoking status 22 672 <0.0001 Current 2569 (11.3) 478 (15.5) 1100 (12.2) 683 (9.9) 234 (9.0) 74 (7.0) Former 10 158 (44.8) 1404 (45.5) 4104 (45.5) 3044 (44.1) 1131 (43.3) 475 (45.1) Never 9945 (43.9) 1206 (39.1) 3809 (42.3) 3180 (46.0) 1246 (47.7) 504 (47.9) PP, mm Hg 22 658 55.4±14.0 40.7±7.5 50.3±8.8 59.7±10.2 68.5±12.0 82.3±14.6 … SBP, mm Hg 22 659 133.7±16.7 118.6±11.8 129.3±12.8 137.8±14.2 145.9±16.0 158.1±18.4 … DBP, mm Hg 22 659 78.2±10.1 77.9±9.2 79.0±9.6 78.1±10.2 77.4±11.4 75.8±12.1 … Heart rate, bpm 22 660 68.5±10.6 68.7±10.4 68.6±10.4 68.6±10.7 68.0±11.5 67.0±11.1 <0.0001 Myocardial infarction 22 670 13 258 (58.5) 2081 (67.4) 5542 (61.5) 3785 (54.8) 1341 (51.4) 509 (48.3) <0.0001 PCI 22 670 12 962 (57.2) 1863 (60.3) 5182 (57.5) 3930 (56.9) 1441 (55.2) 546 (51.9) <0.0001 CABG 22 670 5691 (25.1) 695 (22.5) 2073 (23.0) 1804 (26.1) 770 (29.5) 349 (33.1) <0.0001 TIA 22 670 801 (3.5) 86 (2.8) 291 (3.2) 273 (4.0) 110 (4.2) 41 (3.9) 0.0047 Stroke 22 670 1089 (4.8) 132 (4.3) 415 (4.6) 341 (4.9) 132 (5.1) 69 (6.6) 0.035 Hospitalization for HF 22 670 1211 (5.3) 202 (6.5) 445 (4.9) 343 (5.0) 158 (6.1) 63 (6.0) 0.0019 LVEF, % 15 969 56.1±11.0 54.2±12.1 55.9±10.8 56.6±10.6 57.1±10.9 57.8±10.9 <0.0001 HbA1C, % 6173 6.9±1.8 6.7±1.4 6.8±1.7 6.9±1.4 7.0±1.5 7.4±4.2 <0.0001 Creatinine, µmol/L 17 165 88 (76–104) 88 (77–103) 88 (76–102) 88 (76–103) 88 (75–106) 90 (76–110) 0.0010 HDL-cholesterol, mmol/L 16 054 1.1 (1.0–1.4) 1.1 (0.9–1.3) 1.1 (1.0–1.3) 1.2 (1.0–1.4) 1.2 (1.0–1.4) 1.1 (1.0–1.4) <0.0001 LDL-cholesterol, mmol/L 15 257 2.4 (1.9–3.0) 2.3 (1.8–2.9) 2.4 (1.9–3.0) 2.4 (1.9–2.9) 2.3 (1.8–2.8) 2.4 (1.9–3.0) <0.0001 Fasting triglycerides, mmol/L 16 806 1.4 (1.0–2.0) 1.4 (1.0–2.0) 1.5 (1.1–2.0) 1.4 (1.0–1.9) 1.4 (1.0–2.0) 1.4 (1.0–1.9) 0.0018 Values are mean±SD, n (%), or median (IQR). BMI indicates body mass index; CABG, coronary artery bypass graft; DBP, diastolic blood pressure; HbA1c, hemoglobin A1c; HDL, high-density lipoprotein; HF, heart failure; IQR, interquartile range; LDL, low-density lipoprotein; LVEF, left ventricular ejection fraction; PCI, percutaneous coronary intervention; PP, pulse pressure; SBP, systolic blood pressure; and TIA, transient ischemic attack.(HRs) for PP subgroups are indicated in Table 2. The
relation-ship between average PP and crude and adjusted risk of the
pri-mary outcome followed a J-shaped curve. A similar J-shaped
relationship was found for cardiovascular death, myocardial
infarction, stroke, and hospitalization for heart failure (Table 2).
The increased risk for elevated PP was more pronounced for
myocardial infarction than for the other outcomes with
progres-sively increasing HRs as average PP increased. Similar results
were found after exclusion of patients with heart failure, except
for lost and attenuated associations of elevated PP with stroke
and hospitalization for heart failure, respectively (Table 2).
Diastolic BP
As demonstrated previously for cardiovascular death,
myocar-dial infarction, and hospitalization for heart failure, but not for
stroke,
5the relationship between average diastolic BP and the
primary composite outcome was J-shaped, even after multiple
adjustments for potential confounders. A similar J-shaped
pat-tern was seen after further adjusting for PP (Figure S2).
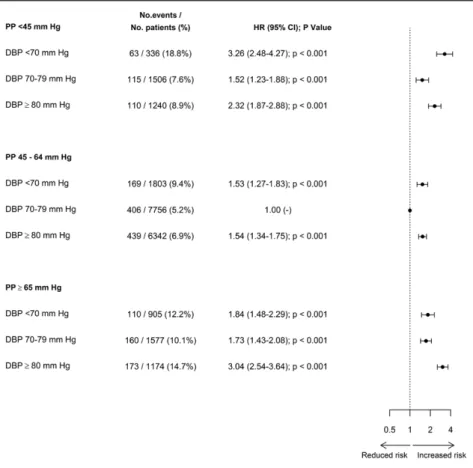
Diastolic BP Cross-Classified With PP
Diastolic BP, categorized in the 3 subgroups used for
cross-classifications, had similar relationships to cardiovascular
events as when categorized in 5 subgroups, namely J-shaped
for all end points but stroke (Table S2). Event rates and HRs for
the 9 BP subgroups defined by cross-classifications between
diastolic BP and PP are shown in the Figure 1 (primary
out-come) and Table 3 (secondary outcomes). The J-shaped
rela-tionship observed between diastolic BP and all end points but
stroke remained, with very similar patterns, in patients with a
PP within the lowest-risk range (45–64 mm Hg).
Interactions between PP categories and diastolic BP
catego-ries were significant for the primary outcome and
cardiovascu-lar death, but nonsignificant for myocardial infarction, stroke,
and hospitalization for heart failure (Table S3). Analyses by PP
subgroup in case of a significant interaction are shown in Table
S4. The significant interaction for the primary outcome and
cardiovascular death revealed a steeper J-curve, with an even
Table 2. Event Rates and Adjusted Hazard Ratios for PP SubgroupsParameter
HR (95% CI) for Average PP Subgroups
P Value <45 mm Hg
45–54
mm Hg 55–64 mm Hg 65–74 mm Hg ≥75 mm Hg Cardiovascular death or myocardial infarction (primary composite outcome)
Event rate, % 9.3 6.0 6.8 10.4 16.3 <0.0001 HR (model 1) 1.62 (1.40–1.87) 1.00 1.07 (0.94–1.21) 1.54 (1.32–1.79) 2.34 (1.95–2.81) <0.0001 HR (model 2) 1.62 (1.40–1.88) 1.00 1.07 (0.94–1.21) 1.54 (1.31–1.79) 2.33 (1.92–2.83) <0.0001 Excluding HF 1.63 (1.33–2.00) 1.00 0.99 (0.84–1.17) 1.38 (1.14–1.69) 2.15 (1.70–2.73) <0.0001 Cardiovascular death Event rate, % 7.0 4.0 4.6 7.4 11.7 <0.0001 HR (model 1) 1.80 (1.51–2.13) 1.00 1.02 (0.87–1.19) 1.48 (1.24–1.78) 2.20 (1.77–2.74) <0.0001 HR (model 2) 1.79 (1.50–2.13) 1.00 1.02 (0.87–1.19) 1.49 (1.24–1.80) 2.23 (1.77–2.80) <0.0001 Excluding HF 1.90 (1.48–2.44) 1.00 0.94 (0.77–1.16) 1.40 (1.10–1.79) 2.04 (1.52–2.73) <0.0001 Myocardial infarction Event rate, % 3.9 2.9 3.4 4.9 7.8 <0.0001 HR (model 1) 1.39 (1.12–1.73) 1.00 1.25 (1.04–1.50) 1.81 (1.45–2.25) 2.94 (2.25–3.83) <0.0001 HR (model 2) 1.42 (1.14–1.78) 1.00 1.23 (1.02–1.47) 1.74 (1.39–2.20) 2.79 (2.10–3.69) <0.0001 Excluding HF 1.41 (1.06–1.88) 1.00 1.18 (0.95–1.48) 1.55 (1.18–2.04) 2.32 (1.65–3.25) <0.0001 Stroke Event rate, % 2.1 1.9 2.2 3.3 4.4 <0.0001 HR (model 1) 1.26 (0.94–1.68) 1.00 1.06 (0.85–1.32) 1.56 (1.20–2.04) 1.98 (1.41–2.80) 0.0001 HR (model 2) 1.39 (1.04–1.86) 1.00 0.98 (0.78–1.23) 1.35 (1.03–1.79) 1.56 (1.09–2.25) 0.0044 Excluding HF 1.55 (1.09–2.21) 1.00 0.78 (0.59–1.03) 1.06 (0.76–1.49) 1.24 (0.81–1.91) 0.0032 Hospitalization for HF Event rate, % 7.7 5.3 5.4 6.5 8.6 <0.0001 HR (model 1) 1.47 (1.25–1.73) 1.00 1.17 (1.02–1.35) 1.40 (1.16–1.68) 2.08 (1.63–2.65) <0.0001 HR (model 2) 1.56 (1.32–1.83) 1.00 1.12 (0.97–1.29) 1.27 (1.05–1.54) 1.82 (1.41–2.35) <0.0001 Excluding HF 1.51 (1.11–2.06) 1.00 0.98 (0.78–1.25) 0.92 (0.66–1.29) 1.65 (1.13–2.41) 0.0019
Model 1, see Methods. Model 2, additional adjustment for mean arterial pressure. CI indicates confidence interval; HF, heart failure; HR, hazard ratio; and PP, pulse pressure.
greater risk associated with low diastolic BP (<70 mm Hg)
in patients with PP<45 mm Hg. Conversely, in patients with
PP≥65 mm Hg, there was no increase in the risk of
cardiovas-cular events in patients with diastolic BP<70 versus 70 to 79
mm Hg. The nonsignificant interaction for other end points
showed that the relationship between diastolic BP and
cardio-vascular events was consistent across PP subgroups. Mean BPs
in each subgroup are shown in Table S5.
Diastolic BP Cross-Classified With Systolic BP
Crude and adjusted HRs between BP subgroups, defined by
cross-classifications between diastolic BP and systolic BP
categories, are indicated in Figure 2 (primary end point) and
Table 3 (secondary end points). The J-shaped relationship
observed between diastolic BP and cardiovascular events
remained when restricting the analysis to patients with systolic
BP in the lowest-risk range of 120 to 139 mm Hg. Interaction
between diastolic BP and systolic BP was nonsignificant for
most end points (Table S3), hence the relationship between
diastolic BP and outcome was consistent across systolic BP
subgroups. In the case of hospitalization for heart failure,
there was a significant interaction between diastolic BP and
systolic BP (P=0.0199), and the risk associated with a low
diastolic BP increased as systolic BP increased (Table S4).
Mean BP values in each subgroup are indicated in Table S5.
Discussion
This large international study evaluated the cardiovascular
risk associated with single or combined components of BP
in 22 672 patients with CAD treated for hypertension to
deci-pher the underlying mechanisms of the J-shaped relationship
observed between diastolic BP and cardiovascular events
(except stroke) in this population. Even though elevated PP
was strongly associated with all cardiovascular end points, this
phenomenon did not account for the increased risk observed
at low diastolic BP. Indeed, the J-shaped relationship between
diastolic BP and cardiovascular outcomes (primary end point
and all secondary end points but stroke) persisted in patients
with PP or systolic BP in the lowest-risk range (45–64 and
120–139 mm Hg, respectively).
In this large population of patients with CAD treated for
hypertension and followed according to routine clinical
prac-tice, elevated PP was associated with an increased risk of
all outcomes, even after adjustment for multiple covariates,
including mean arterial pressure, confirming previous studies
conducted in various populations that have shown that PP is
an independent cardiovascular risk marker.
16–18PP is an
indi-cator of left ventricle ejection volume and velocity and
vis-coelastic properties of large arteries. Therefore, elevated PP
is correlated with vascular aging, both through a weakened
Windkessel effect and an increased pulse wave velocity, with
an earlier reflection wave increasing systolic BP and
reduc-ing diastolic BP. Furthermore, by definition, as PP increases
for a given mean arterial pressure, systolic BP—and thus the
afterload of the left ventricle—increases, and diastolic BP—
and thus myocardial perfusion—decreases, both factors also
potentially accounting for the increased risk associated with
high PP. However, whether reducing PP reduces
cardiovascu-lar risk has not yet been established, unlike the clear beneficial
effect of reducing elevated systolic BP.
1,23,24In addition to the increased risk associated with elevated
PP, we also found an increased risk associated with low PP
Figure 1. Forest plots of adjusted hazard ratios (HRs) for the primary outcome (cardiovascular death or myocardial infarction) for diastolic blood pressure (DBP) subgroups cross-classified with pulse pressure (PP) subgroups. Analyses are adjusted as defined for model 1. CI indicates confidence interval.
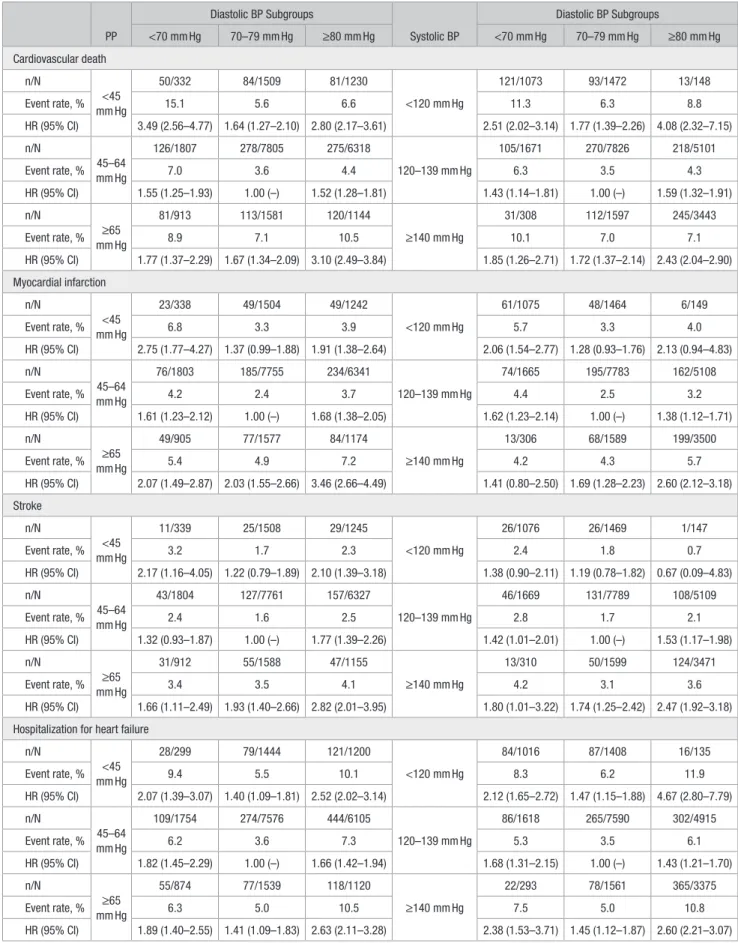
Table 3. Cross-Classifications Analysis: Event Rates and Adjusted Hazard Ratios for Secondary Outcomes PP Diastolic BP Subgroups Systolic BP Diastolic BP Subgroups <70 mm Hg 70–79 mm Hg ≥80 mm Hg <70 mm Hg 70–79 mm Hg ≥80 mm Hg Cardiovascular death n/N <45 mm Hg 50/332 84/1509 81/1230 <120 mm Hg 121/1073 93/1472 13/148 Event rate, % 15.1 5.6 6.6 11.3 6.3 8.8 HR (95% CI) 3.49 (2.56–4.77) 1.64 (1.27–2.10) 2.80 (2.17–3.61) 2.51 (2.02–3.14) 1.77 (1.39–2.26) 4.08 (2.32–7.15) n/N 45–64 mm Hg 126/1807 278/7805 275/6318 120–139 mm Hg 105/1671 270/7826 218/5101 Event rate, % 7.0 3.6 4.4 6.3 3.5 4.3 HR (95% CI) 1.55 (1.25–1.93) 1.00 (–) 1.52 (1.28–1.81) 1.43 (1.14–1.81) 1.00 (–) 1.59 (1.32–1.91) n/N ≥65 mm Hg 81/913 113/1581 120/1144 ≥140 mm Hg 31/308 112/1597 245/3443 Event rate, % 8.9 7.1 10.5 10.1 7.0 7.1 HR (95% CI) 1.77 (1.37–2.29) 1.67 (1.34–2.09) 3.10 (2.49–3.84) 1.85 (1.26–2.71) 1.72 (1.37–2.14) 2.43 (2.04–2.90) Myocardial infarction n/N <45 mm Hg 23/338 49/1504 49/1242 <120 mm Hg 61/1075 48/1464 6/149 Event rate, % 6.8 3.3 3.9 5.7 3.3 4.0 HR (95% CI) 2.75 (1.77–4.27) 1.37 (0.99–1.88) 1.91 (1.38–2.64) 2.06 (1.54–2.77) 1.28 (0.93–1.76) 2.13 (0.94–4.83) n/N 45–64 mm Hg 76/1803 185/7755 234/6341 120–139 mm Hg 74/1665 195/7783 162/5108 Event rate, % 4.2 2.4 3.7 4.4 2.5 3.2 HR (95% CI) 1.61 (1.23–2.12) 1.00 (–) 1.68 (1.38–2.05) 1.62 (1.23–2.14) 1.00 (–) 1.38 (1.12–1.71) n/N ≥65 mm Hg 49/905 77/1577 84/1174 ≥140 mm Hg 13/306 68/1589 199/3500 Event rate, % 5.4 4.9 7.2 4.2 4.3 5.7 HR (95% CI) 2.07 (1.49–2.87) 2.03 (1.55–2.66) 3.46 (2.66–4.49) 1.41 (0.80–2.50) 1.69 (1.28–2.23) 2.60 (2.12–3.18) Stroke n/N <45 mm Hg 11/339 25/1508 29/1245 <120 mm Hg 26/1076 26/1469 1/147 Event rate, % 3.2 1.7 2.3 2.4 1.8 0.7 HR (95% CI) 2.17 (1.16–4.05) 1.22 (0.79–1.89) 2.10 (1.39–3.18) 1.38 (0.90–2.11) 1.19 (0.78–1.82) 0.67 (0.09–4.83) n/N 45–64 mm Hg 43/1804 127/7761 157/6327 120–139 mm Hg 46/1669 131/7789 108/5109 Event rate, % 2.4 1.6 2.5 2.8 1.7 2.1 HR (95% CI) 1.32 (0.93–1.87) 1.00 (–) 1.77 (1.39–2.26) 1.42 (1.01–2.01) 1.00 (–) 1.53 (1.17–1.98) n/N ≥65 mm Hg 31/912 55/1588 47/1155 ≥140 mm Hg 13/310 50/1599 124/3471 Event rate, % 3.4 3.5 4.1 4.2 3.1 3.6 HR (95% CI) 1.66 (1.11–2.49) 1.93 (1.40–2.66) 2.82 (2.01–3.95) 1.80 (1.01–3.22) 1.74 (1.25–2.42) 2.47 (1.92–3.18) Hospitalization for heart failure
n/N <45 mm Hg 28/299 79/1444 121/1200 <120 mm Hg 84/1016 87/1408 16/135 Event rate, % 9.4 5.5 10.1 8.3 6.2 11.9 HR (95% CI) 2.07 (1.39–3.07) 1.40 (1.09–1.81) 2.52 (2.02–3.14) 2.12 (1.65–2.72) 1.47 (1.15–1.88) 4.67 (2.80–7.79) n/N 45–64 mm Hg 109/1754 274/7576 444/6105 120–139 mm Hg 86/1618 265/7590 302/4915 Event rate, % 6.2 3.6 7.3 5.3 3.5 6.1 HR (95% CI) 1.82 (1.45–2.29) 1.00 (–) 1.66 (1.42–1.94) 1.68 (1.31–2.15) 1.00 (–) 1.43 (1.21–1.70) n/N ≥65 mm Hg 55/874 77/1539 118/1120 ≥140 mm Hg 22/293 78/1561 365/3375 Event rate, % 6.3 5.0 10.5 7.5 5.0 10.8 HR (95% CI) 1.89 (1.40–2.55) 1.41 (1.09–1.83) 2.63 (2.11–3.28) 2.38 (1.53–3.71) 1.45 (1.12–1.87) 2.60 (2.21–3.07) Covariates at those indicated for model 1. BP indicates blood pressure; CI, confidence interval; HR, hazard ratio; N, number of patients; and PP, pulse pressure.
(<45 mm Hg). Such a J-shaped pattern for the link between
PP and the rate of cardiovascular events had not been shown
in all previous studies.
16,25However, in a post hoc analysis
of the INVEST trial,
18which included 22 576 CAD patients
with hypertension, the relationship between PP and
car-diovascular death and myocardial infarction was J-shaped,
with an increased risk below a nadir value of 54 mm Hg
(95% confidence interval, 42–60 mm Hg), in line with our
results. In addition, in one of the largest studies examining
the risk associated with PP, conducted in the REACH
reg-istry (45 087 high-risk subjects), we recently showed that
not only was elevated PP associated with multiple adverse
cardiovascular outcomes, but patients in the first quartile
of PP (<50 mm Hg) also displayed an increased risk of
car-diovascular death.
17Reverse causality, associated with low
stroke volume,
26may at least in part explain this
phenom-enon. However, patients with severe aortic stenosis were
excluded from the study, this association persisted after
mul-tiple adjustments for confounding factors and in a sensitivity
analysis excluding patients with heart failure. Alternatively,
the increased risk observed for low PP, which was highest in
the lower end of the BP spectrum, may be driven by the
pos-sibly additive risks of low diastolic BP (compromising
myo-cardial perfusion) combined with low mean arterial pressure
(compromising perfusion of all other organs). Because
the relationship between PP and the primary outcome was
J-shaped in our study population, we divided PP in 3
sub-groups for cross-classifications, the middle subgroup being
that associated with the lowest risk (45–65 mm Hg).
The increased risk associated with elevated PP has led
many authors to hypothesize that the J-shaped relation to
cardiovascular risk associated with diastolic BP largely
reflects increased PP, an indicator of advanced vascular
dis-ease and stiffened large arteries.
16,27–29However, our results
do not confirm previous studies, which had suggested that the
increased risk associated with low diastolic BP was restricted
to patients with increased PP
19,21or increased systolic BP.
20Importantly, these studies were conducted in much smaller
cohorts, and did not specifically include patients with CAD.
We showed that, even in patients within the lowest-risk range
of PP or systolic BP, the J-shaped relationship between
dia-stolic BP and cardiovascular events remained, which strongly
argues against increased PP being the sole explanation for
the increased risk observed at low diastolic BP. Similarly, the
J-curve relationship between diastolic BP and the primary
outcome persisted after adjustment for PP, as shown
previ-ously in 10 001 patients with CAD enrolled in the TNT trial
(Treating to New Targets).
4In line with our results, in a cohort
of 331 frail elderly patients, Protogerou et al
30had found that
a diastolic BP ≤60 mm Hg was associated with increased
mor-tality during a 2-year follow-up, independently of large artery
stiffness as measured by pulse wave analysis.
Not only was the J-shaped relationship between diastolic
BP and cardiovascular events not restricted to patients with
increased PP, it was actually attenuated as PP increased, at
least for the primary outcome and cardiovascular death, for
which the interaction between diastolic BP and PP was
sig-nificant. The increased risk observed at low values of diastolic
BP was highest when accompanied by a low PP, as discussed
above. Conversely, in patients with elevated PP (≥65 mm Hg),
the risk was higher than in patients with intermediate levels of
PP, but there was no further increase in the risk when diastolic
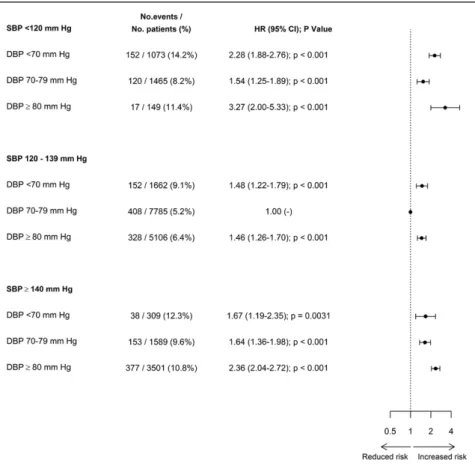
Figure 2. Forest plots of adjusted hazard ratios (HRs) for the primary outcome (cardiovascular death or myocardial infarction) for diastolic blood pressure (DBP) subgroups cross-classified with systolic blood pressure (SBP) subgroups. Analyses are adjusted as defined for model 1. CI indicates confidence interval.
BP was <70 mm Hg. A likely explanation for that is that in
this subgroup (PP≥65 mm Hg and diastolic BP<70 mm Hg),
although the lower diastolic BP is expected to be deleterious,
this may be compensated by the lower systolic BP
accom-panying these lower diastolic BP values (138 mm Hg in the
lowest diastolic BP subgroup versus 147 mm Hg in the
70–79-mm Hg subgroup), itself clearly beneficial.
The main limitation of our study is that it is an
observa-tional registry, and we cannot therefore draw conclusions on
whether associations between single or combined components
of BP and cardiovascular risk are causal or would be reversed
by interventions to diminish PP or increase low diastolic BP.
Our results suggest that low myocardial perfusion may be a
more likely explanation for the J-curve than increased vascular
aging associated with high PP and low diastolic BP, but do not
demonstrate that it is the sole or major mechanism, nor rule out
some reverse causality. Assumptions based on observational
studies are the basis for future randomized trials to define
optimal BP targets. Among other limitations of our study, our
results were obtained in hypertensive patients with stable CAD
free from other severe conditions, and cannot be extrapolated
to healthier hypertensive subjects, or to elderly frail patients.
Similarly, these data should not be extrapolated to
nonhyper-tensive patients with CAD, who are commonly treated with
BP-lowering drugs and in whom the potential deleterious
effects of low BP remain to be studied. Finally, the CLARIFY
registry reflects routine clinical practice, and although our
results may have wider external validity than randomized
tri-als, measurements of BP were less standardized and outcome
identification possibly less accurate than in randomized trials.
Perspectives
Even though elevated PP is associated with increased
cardio-vascular risk and is closely intertwined with decreased
dia-stolic pressure, it does not seem to be the major determinant
of the increased risk associated with low diastolic BP in this
large cohort of patients with CAD. A compromised
myocar-dial perfusion associated with low diastolic BP in patients
with CAD seems to be a more plausible explanation, although
reverse causation cannot be ruled out.
Our data, although observational, suggest caution when
lowering diastolic BP below 70 mm Hg, and even more so
60 mm Hg, in patients with CAD treated for hypertension.
However, only randomized trials will provide irrefutable
evi-dence for a causal link between low diastolic BP and adverse
cardiovascular events. BP target trials comparing levels of
achieved BP, especially levels of diastolic BP in patients
with CAD, are needed to define optimal BP targets in this
population.
Acknowledgments
Editorial support limited to editing, checking content and language, and formatting was provided by Jenny Lloyd and Sophie Rushton-Smith (MedLink Healthcare Communications Ltd) and was funded by Servier.
Sources of Funding
The CLARIFY registry (Prospective Observational Longitudinal Registry of Patients With Stable Coronary Artery Disease) was sup-ported by Servier.
Disclosures
E. Vidal-Petiot reports travel support from Servier. N. Greenlaw re-ports grants from Servier. I. Ford rere-ports grants and personal fees from Servier and Amgen. R. Ferrari reports receiving honorarium from Servier for steering committee membership consulting and speak-ing, support for travel to study meetings from Servier, personal fees from Boehringer-Ingelheim, Novartis, Merck Serono, and Irbtech, and he is a stockholder in Medical Trials Analysis. K.M. Fox reports personal fees and nonfinancial support from Servier and Broadview Ventures, personal fees from AstraZeneca, TaurX, and CellAegis and nonfinancial support from Armgo. He is Director of Heart Research Ltd and Vesalius Trials Ltd and a minimal stockholder of Armgo and CellAegis. J.-C. Tardif reports grants and personal fees from Amarin, AstraZeneca, Pfizer, Sanofi, and Servier, and grants personal fees and other (minor equity interest) from DalCor, grants from Esperion, Ionis, and Merck. In addition, J.-C. Tardif has a patent Pharmacogenomics-guided therapy with CETP (cholesterol ester transfer protein) inhibi-tion pending. M. Tendera reports personal fees from Servier, Bayer, Janssen Cilag, Kowa, and the Perfuse Study Group, and grants from EU Framework Program VII and from the Polish National Center for Research and Development. A. Parkhomenko reports grants and personal fees from Servier. D.L. Bhatt discloses the following relationships: Advisory Board: Cardax, Elsevier Practice Update Cardiology, Medscape Cardiology, Regado Biosciences; Board of Directors: Boston VA Research Institute, Society of Cardiovascular Patient Care; Chair: American Heart Association Quality Oversight Committee; Data Monitoring Committees: Cleveland Clinic, Duke Clinical Research Institute, Harvard Clinical Research Institute, Mayo Clinic, Mount Sinai School of Medicine, Population Health Research Institute; Honoraria: American College of Cardiology (Senior Associate Editor, Clinical Trials and News, ACC.org), Belvoir Publications (Editor in Chief, Harvard Heart Letter), Duke Clinical Research Institute (clinical trial steering committees), Harvard Clinical Research Institute (clinical trial steering commit-tee), HMP Communications (Editor in Chief, Journal of Invasive Cardiology), Journal of the American College of Cardiology (Guest Editor; Associate Editor), Population Health Research Institute (clinical trial steering committee), Slack Publications (Chief Medical Editor, Cardiology Today’s Intervention), Society of Cardiovascular Patient Care (Secretary/Treasurer), WebMD (Continuing Medical Education steering committees); Other: Clinical Cardiology (Deputy Editor), NCDR-ACTION Registry Steering Committee (Chair), Veterans Affairs CART Research and Publications Committee (Chair); Research Funding: Amarin, Amgen, AstraZeneca, Bristol-Myers Squibb, Chiesi, Eisai, Ethicon, Forest Laboratories, Ironwood, Ischemix, Lilly, Medtronic, Pfizer, Roche, Sanofi Aventis, The Medicines Company; Royalties: Elsevier (Editor, Cardiovascular Intervention: A Companion to Braunwald’s Heart Disease); Site Co-Investigator: Biotronik, Boston Scientific, St. Jude Medical (now Abbott); Trustee: American College of Cardiology; Unfunded Research: FlowCo, Merck, PLx Pharma, Takeda. P.G. Steg reports research grants from Merck, Sanofi, and Servier and speaking or con-sulting fees from Amarin, Amgen, AstraZeneca, Bayer, Boehringer-Ingelheim, Bristol-Myers-Squibb, Janssen, Lilly, Merck, Novartis, Pfizer, Regeneron, Sanofi, and Servier.
References
1. Ettehad D, Emdin CA, Kiran A, Anderson SG, Callender T, Emberson J, Chalmers J, Rodgers A, Rahimi K. Blood pressure lowering for prevention of cardiovascular disease and death: a systematic review and meta-analy-sis. Lancet. 2016;387:957–967. doi: 10.1016/S0140-6736(15)01225-8. 2. Mancia G, Fagard R, Narkiewicz K, et al; Task Force Members. 2013
ESH/ESC Guidelines for the management of arterial hypertension: the Task Force for the management of arterial hypertension of the European Society of Hypertension (ESH) and of the European Society of Cardiology (ESC). J Hypertens. 2013;31:1281–1357. doi: 10.1097/01. hjh.0000431740.32696.cc.
3. Messerli FH, Mancia G, Conti CR, Hewkin AC, Kupfer S, Champion A, Kolloch R, Benetos A, Pepine CJ. Dogma disputed: can aggressively low-ering blood pressure in hypertensive patients with coronary artery disease be dangerous? Ann Intern Med. 2006;144:884–893.
4. Bangalore S, Messerli FH, Wun CC, Zuckerman AL, DeMicco D, Kostis JB, LaRosa JC; Treating to New Targets Steering Committee and Investigators. J-curve revisited: an analysis of blood pressure and cardio-vascular events in the Treating to New Targets (TNT) Trial. Eur Heart J. 2010;31:2897–2908. doi: 10.1093/eurheartj/ehq328.
5. Vidal-Petiot E, Ford I, Greenlaw N, Ferrari R, Fox KM, Tardif JC, Tendera M, Tavazzi L, Bhatt DL, Steg PG; CLARIFY Investigators. Cardiovascular event rates and mortality according to achieved systolic and diastolic blood pressure in patients with stable coronary artery dis-ease: an international cohort study. Lancet. 2016;388:2142–2152. doi: 10.1016/S0140-6736(16)31326-5.
6. McEvoy JW, Chen Y, Rawlings A, Hoogeveen RC, Ballantyne CM, Blumenthal RS, Coresh J, Selvin E. Diastolic blood pressure, subclini-cal myocardial damage, and cardiac events: implications for blood pres-sure control. J Am Coll Cardiol. 2016;68:1713–1722. doi: 10.1016/j. jacc.2016.07.754.
7. Bhatt DL. Troponin and the J-curve of diastolic blood pressure: when lower is not better. J Am Coll Cardiol. 2016;68:1723–1726. doi: 10.1016/j. jacc.2016.08.007.
8. Rabkin SW, Shiekh IA, Wood DA. The impact of left ventricular mass on diastolic blood pressure targets for patients with coronary artery disease.
Am J Hypertens. 2016;29:1085–1093. doi: 10.1093/ajh/hpw044.
9. Cushman WC, Evans GW, Byington RP, et al; ACCORD Study Group. Effects of intensive blood-pressure control in type 2 diabetes mellitus. N
Engl J Med. 2010;362:1575–1585. doi: 10.1056/NEJMoa1001286.
10. Benavente OR, Coffey CS, Conwit R, Hart RG, McClure LA, Pearce LA, Pergola PE, Szychowski JM; SPS3 Study Group. Blood-pressure targets in patients with recent lacunar stroke: the SPS3 randomised trial. Lancet. 2013;382:507–515. doi: 10.1016/S0140-6736(13)60852-1.
11. Wright JT Jr, Williamson JD, Whelton PK, et al; SPRINT Research Group. A randomized trial of intensive versus standard blood-pressure control. N
Engl J Med. 2015;373:2103–2116. doi: 10.1056/NEJMoa1511939.
12. Kjeldsen SE, Lund-Johansen P, Nilsson PM, Mancia G. Unattended blood pressure measurements in the Systolic Blood Pressure Intervention Trial: implications for entry and achieved blood pressure values com-pared with other trials. Hypertension. 2016;67:808–812. doi: 10.1161/ HYPERTENSIONAHA.116.07257.
13. Kjeldsen SE, Mancia G. Unobserved automated office blood pressure measurement in the Systolic Blood Pressure Intervention Trial (SPRINT): systolic blood pressure treatment target remains below 140 mmHg. Eur
Heart J Cardiovasc Pharmacother. 2016;2:79–80. doi: 10.1093/ehjcvp/
pvw002.
14. Messerli FH, Panjrath GS. The J-curve between blood pressure and coro-nary artery disease or essential hypertension: exactly how essential? J Am
Coll Cardiol. 2009;54:1827–1834. doi: 10.1016/j.jacc.2009.05.073. 15. Ravindrarajah R, Hazra NC, Hamada S, Charlton J, Jackson SHD,
Dregan A, Gulliford MC. Systolic blood pressure trajectory, frailty, and all-cause mortality >80 years of age: cohort study using elec-tronic health records. Circulation. 2017;135:2357–2368. doi: 10.1161/ CIRCULATIONAHA.116.026687.
16. Blacher J, Staessen JA, Girerd X, Gasowski J, Thijs L, Liu L, Wang JG, Fagard RH, Safar ME. Pulse pressure not mean pressure determines cardiovascular risk in older hypertensive patients. Arch Intern Med. 2000;160:1085–1089.
17. Selvaraj S, Steg PG, Elbez Y, Sorbets E, Feldman LJ, Eagle KA, Ohman EM, Blacher J, Bhatt DL; REACH Registry Investigators. Pulse pressure
and risk for cardiovascular events in patients with atherothrombosis: from the REACH registry. J Am Coll Cardiol. 2016;67:392–403. doi: 10.1016/j. jacc.2015.10.084.
18. Bangalore S, Messerli FH, Franklin SS, Mancia G, Champion A, Pepine CJ. Pulse pressure and risk of cardiovascular outcomes in patients with hypertension and coronary artery disease: an INternational VErapamil SR-trandolapril STudy (INVEST) analysis. Eur Heart J. 2009;30:1395– 1401. doi: 10.1093/eurheartj/ehp109.
19. Madhavan S, Ooi WL, Cohen H, Alderman MH. Relation of pulse pres-sure and blood prespres-sure reduction to the incidence of myocardial infarc-tion. Hypertension. 1994;23:395–401.
20. Kannel WB, Wilson PW, Nam BH, D’Agostino RB, Li J. A likely expla-nation for the J-curve of blood pressure cardiovascular risk. Am J Cardiol. 2004;94:380–384. doi: 10.1016/j.amjcard.2004.04.043.
21. Franklin SS, Gokhale SS, Chow VH, Larson MG, Levy D, Vasan RS, Mitchell GF, Wong ND. Does low diastolic blood pressure contribute to the risk of recurrent hypertensive cardiovascular disease events? The Framingham Heart Study. Hypertension. 2015;65:299–305. doi: 10.1161/ HYPERTENSIONAHA.114.04581.
22. Steg PG, Greenlaw N, Tendera M, Tardif JC, Ferrari R, Al-Zaibag M, Dorian P, Hu D, Shalnova S, Sokn FJ, Ford I, Fox KM; Prospective Observational Longitudinal Registry of Patients With Stable Coronary Artery Disease (CLARIFY) Investigators. Prevalence of anginal symp-toms and myocardial ischemia and their effect on clinical outcomes in outpatients with stable coronary artery disease: data from the International Observational CLARIFY Registry. JAMA Intern Med. 2014;174:1651– 1659. doi: 10.1001/jamainternmed.2014.3773.
23. Bangalore S, Toklu B, Gianos E, Schwartzbard A, Weintraub H, Ogedegbe G, Messerli FH. Optimal systolic blood pressure target after SPRINT: insights from a network meta-analysis of randomized trials. Am J Med. 2017;130:707.e8–719.e8. doi: 10.1016/j.amjmed.2017.01.004.
24. Bundy JD, Li C, Stuchlik P, Bu X, Kelly TN, Mills KT, He H, Chen J, Whelton PK, He J. Systolic blood pressure reduction and risk of cardiovas-cular disease and mortality: a systematic review and network meta-analy-sis. JAMA Cardiol. 2017;2:775–781. doi: 10.1001/jamacardio.2017.1421. 25. Elliott HL, Lloyd SM, Ford I, Meredith PA. Prognostic importance of pre-treatment and on-pre-treatment blood pressure: further analysis of the ACTION database and the effect of nifedipine gastrointestinal therapeutic system.
Blood Press. 2016;25:67–73. doi: 10.3109/08037051.2015.1127526.
26. Jackson CE, Castagno D, Maggioni AP, et al; Meta-Analysis Global Group in Chronic Heart Failure MAGGIC. Differing prognostic value of pulse pressure in patients with heart failure with reduced or preserved ejection fraction: results from the MAGGIC individual patient meta-anal-ysis. Eur Heart J. 2015;36:1106–1114. doi: 10.1093/eurheartj/ehu490. 27. Franklin SS, Lopez VA, Wong ND, Mitchell GF, Larson MG, Vasan RS,
Levy D. Single versus combined blood pressure components and risk for cardiovascular disease: the Framingham Heart Study. Circulation. 2009;119:243–250. doi: 10.1161/CIRCULATIONAHA.108.797936. 28. Millar JA, Lever AF. Implications of pulse pressure as a predictor of
car-diac risk in patients with hypertension. Hypertension. 2000;36:907–911. 29. Kannel WB, Vasan RS. Aggressive lowering of blood pressure. Lancet.
2006;368:627–628. doi: 10.1016/S0140-6736(06)69224-6.
30. Protogerou AD, Safar ME, Iaria P, Safar H, Le Dudal K, Filipovsky J, Henry O, Ducimetière P, Blacher J. Diastolic blood pressure and mortality in the elderly with cardiovascular disease. Hypertension. 2007;50:172– 180. doi: 10.1161/HYPERTENSIONAHA.107.089797.
What Is New?
•
In this large population of patients with coronary artery disease and treated hypertension, we show for the first time that the J-shaped rela-tionship between diastolic blood pressure (BP) and cardiovascular events persists in patients with the lowest-risk pulse pressure.What Is Relevant?
•
The increased risk observed at low diastolic BP is not an epiphenomenon of increased pulse pressure.•
Although reverse causality cannot be ruled out by our observa-tional study, the alternative hypothesis of a compromised myocar-dial perfusion associated with low diastolic BP seems to be a likelyexplanation for the J-curve of diastolic BP.
Summary
In 22 672 hypertensive patients from the CLARIFY registry (Pro-spective Observational Longitudinal Registry of Patients With Sta-ble Coronary Artery Disease), the J-shaped relationship between diastolic BP and the primary outcome (cardiovascular death or myocardial infarction) remained in patients within the lowest-risk pulse pressure range (45–65 mm Hg), with adjusted hazard ratios of 1.53, 1.00, and 1.54 in the <70, 70 to 79 (reference), and ≥80 mm Hg diastolic BP subgroups, respectively.