optimization of the energy for
Breast monochromatic absorption
X-ray computed tomography
pasquale Delogu
1,2, Vittorio Di trapani
1,2, Luca Brombal
3,4, Giovanni Mettivier
5,6,
Angelo taibi
7,8& piernicola Oliva
9,10The limits of mammography have led to an increasing interest on possible alternatives such as the breast Computed Tomography (bCT). The common goal of all X-ray imaging techniques is to achieve the optimal contrast resolution, measured through the Contrast to Noise Ratio (CNR), while minimizing the radiological risks, quantified by the dose. Both dose and CNR depend on the energy and the intensity of the X-rays employed for the specific imaging technique. Some attempts to determine an optimal energy for bCT have suggested the range 22 keV–34 keV, some others instead suggested the range 50 keV–60 keV depending on the parameters considered in the study. Recent experimental works, based on the use of monochromatic radiation and breast specimens, show that energies around 32 keV give better image quality respect to setups based on higher energies. In this paper we report a systematic study aiming at defining the range of energies that maximizes the CNR at fixed dose in bCT. The study evaluates several compositions and diameters of the breast and includes various reconstruction algorithms as well as different dose levels. The results show that a good compromise between CNR and dose is obtained using energies around 28 keV.
At present dual view 2D mammography is the main tool for detecting breast cancer1,2. However, this method is mainly limited by the overlap of anatomical structures which can reduce the contrast among breast tissues leading to misinterpretations3–7. It has been widely demonstrated that, compared to mammography, breast Computed Tomography (bCT) improves the visibility of the anatomical structures removing the overlaps at the cost of a loss in spatial resolution8–14 and increased dose15–17. The increasing interest on bCT among radiologists and the need for detecting micro-calcifications have recently led to the development of dedicated breast CT systems with improved spatial resolution and doses comparable to the ones accepted in clinical practice13,18,19. Since for planar breast imag-ing the use of monochromatic synchrotron radiation combined with phase contrast techniques has been demon-strated to improve the diagnostic performance without increasing the dose20,21, experimental setups for absorption and phase contrast bCT are being implemented at both the Italian and Australian synchrotron facilities22,23. Specifically, the Syrma-3D project, developed at the SYRMEP beamline at Elettra synchrotron (Trieste, Italy), aims to perform the first clinical synchrotron radiation-based bCT24–32. In this context, the study hereby presented mim-ics the Syrma-3D acquisition setup, which is based on the laminar monochromatic synchrotron beam and a photon counting detector with a 650µm thick CdTe sensor and pixel size Δ = .x 0 06mm33,34. This particular setup allows to acquire the projections in pure parallel-beam geometry with a complete scan over 180°. Moreover, the height of the beam = .h 3 5mm and the large object-detector distance ODD=185cm results in virtually scattering-free projections. A key role in the implementation of systems for medical imaging is played by the calculation of dose, which gives the estimation of radiological risks. Due to its high radiosensitivity, the calculation of dose for breast applications involves only the glandular component of breast tissue, while adipose/fat tissue is considered risk free. Hence, the reference parameter for dose evaluation is the mean glandular dose (MGD), which is defined as the total energy deposited in the glandular tissue divided by the total glandular mass of the breast35. For planar mammogra-phy with compressed breast, the evaluation of MGD through Monte Carlo (MC) techniques has been reported in 1Dipartimento di Scienze Fisiche, della Terra e dell’Ambiente, Università di Siena, Siena, Italy. 2I.N.F.N. Sezione di Pisa, Pisa, Italy. 3Dipartimento di Fisica, Università di Trieste, Trieste, Italy. 4I.N.F.N. Sezione di Trieste, Trieste, Italy. 5Dipartimento di Fisica, Università di Napoli Federico II, Napoli, Italy. 6I.N.F.N. Sezione di Napoli, Napoli, Italy. 7Dipartimento di Fisica e Scienze dalla Terra, Università di Ferrara, Ferrara, Italy. 8I.N.F.N. Sezione di Ferrara, Ferrara, Italy. 9Dipartimento di Chimica e Farmacia, Università di Sassari, Sassari, Italy. 10I.N.F.N. Sezione di Cagliari, Cagliari, Italy. Correspondence and requests for materials should be addressed to P.D. (email: [email protected]) Received: 27 February 2019
Accepted: 22 August 2019 Published: xx xx xxxx
several works36–44 and makes use of the normalized glandular dose coefficient (DgN), which is a function of the spectrum of the beam, the composition and the size of the compressed breast:
= ⋅
MGD K DgN (1)
where K is the air kerma at the entrance surface of the irradiated breast. bCT is a 3D imaging method which does not require the breast compression. The adaptation of the methods of MGD estimation even for bCT con-figuration has been carried out by various authors8,45–49. In this work we refer to (Mettivier et al.49), in which MC calculations of DgNCT (i.e. the normalized glandular dose coefficient calculated in bCT geometry) have been carried out for an idealized cylindrical breast of homogeneous composition and a laminar monoenergetic beam. In this model, the breast is partially irradiated. Following the notation of the authors we evaluated the dose from:
= ⋅
MGDt K DgNCT (2)
where MGDt is the mean glandular dose which includes also the dose delivered to the glandular tissue outside the irradiated volume by the scattered photons. K is the air-kerma at the isocenter and, in the parallel-beam geometry, correspond with the entrance air-kerma.
The quality of X-ray images is mainly given by its discriminating power between different details. For large area details, where the spatial resolution of the detector is not an issue, the Contrast to Noise Ratio (CNR) is the fundamental metrics to quantify image quality. For instance, in planar X-ray imaging, to measure the visibility of a detail with respect to its background it can be defined as:
σ
= −
CNR I I
(3) planar detail background
background
where Idetail and Ibackground are the intensities in large area regions of interest (ROIs) over the detail and the back-ground respectively, and σbackground is the standard deviation in the background ROI. In planar mammography
CNRplanar is related to the MGD:
∝
CNRplanar MGD (4)
Moreover, at fixed photon fluence, both CNRplanar and MGD are decreasing functions of the energy. In planar mammography the best compromise between image quality and dose is given by the X-ray spectrum that maxi-mizes the ratio CNR2/MGD. It has been demonstrated that, depending on the breast size and composition and on the detection system, the optimal energies are in the range 16 keV–27.4 keV50.
Various studies on energy optimization in cone-beam bCT have been published in the past51–53. In particular Glick et al.51 developed a parallel cascade model to evaluate the performances of a dedicated bCT imaging system using a CsI flat panel detector in a truncated cone-beam geometry. By using the ideal observer signal-to-noise ratio as figure of merit, the authors concluded that the best response of their system was achieved within the energy range 36 keV–40 keV. Weigel et al.53 used the metrics of the contrast-to-noise ratio weighted by the square root of the dose (CNRD). Their work is based on numerical simulations and polychromatic experimental data, the geometry of the acquisition is the cone-beam and the composition of the breast is fixed. The authors found that the energy that maximizes CNRD for adipose/glandular tissues depends on the dimension of the breast (diameter) and falls in the range 22 keV–34 keV. Another attempt to estimate the optimal energy was recently performed trough a study using as reference parameter the ratio dose/transmittance47. On the basis of such met-rics, the authors suggested an optimal energy range from 50 keV up to 60 keV. A recent work on the evaluation of the image quality of monochromatic low dose bCT, based on breast specimens54 showed, through the assessment of its quality with objective metrics (signal to noise ratio, spatial resolution and intrinsic quality characteristic)55 and subjective radiological scoring by a group of 13 radiologists, that bCT images at 32 keV are more effective than those at 36 keV and 38 keV. This experimental evidence with monochromatic radiation has shown that ener-gies closer to the ones used in planar mammography could be used to improve the diagnostic power of bCT images. However, to our knowledge, at present a complete systematic study to determine the optimal energy range for parallel-beam bCT image quality optimization has not yet been performed. In this work, we evaluated the quality of bCT images through the specific metrics CNRbCT and studied it as a function of the energy keeping constant MGD and varying, as parameters, the diameter d of the breast and its composition. The composition is characterized by its “glandularity” G, namely the fraction, in weight, of glandular tissue contained in it. The value of G can vary in the range [0, 1] where =G 0 corresponds to a totally adipose tissue and =G 1 to a totally glan-dular tissue. Assuming a monochromatic parallel-beam, a cylindrical breast, an ideal photon counting detector, the object-detector distance ODD=185cm and fixed dose we calculated analytically CNRbCT an, for slices
recon-structed using the Filtered Back Projection (FBP) algorithm. This particular geometry is very similar to one of the Syrma-3D setup. Moreover, we developed an analytical simulation of the whole process of bCT acquisition and reconstruction. This program allows to use various reconstruction methods, including iterative algorithms for which the process of reconstruction cannot be analytically modeled. Furthermore, the simulation program takes into account the quantum nature of the photons, i.e. their Poissonian statistics. This is realized in the projections by calculating, for each pixel, the expected value and by adding to it a random correction following the Poissonian distribution. Using this program, we produced a set of simulated bCT images on which we measured CNRbCT sim,
and compared it to CNRbCT an, . For all the calculations and for the comparison of the analytical model with the
simulation, we fixed the dose to MGD=20mGy. Even though the Syrma-3D final target dose in possible clinical examinations is MGD<5mGy, we chose this value to avoid possible misinterpretation in simulations results,
due to statistical fluctuations that are dose dependent. However, MGD affects only the absolute value of CNR, but not its energy dependence and the results are still valid at lower doses. For the same reason, in the simulations (and for consistency also in the analytical model) we used as voxel size Δ = .x 0 12mm (corresponding to a 2 × 2 re-binning of the Syrma-3D detector). Finally, using the simulation, we studied the visibility of the details at lower doses when the probability of having no counts in some pixels of the detector becomes not negligible. This par-ticular condition can produce the so-called photon starvation artifacts that can further limit the visibility of the details in bCT56.
Methods
General assumptions.
We assume the following hypothesis: • monochromatic parallel-beam• ideal cylindrical breast sample of different diameters and compositions • ideal photon counting detector (the output of the detector reproduces its input) • absorption imaging
• object-detector distance ODD=185cm filled with air • scattered photons do not contribute to the images
The main components of the breast are the adipose tissue and the glandular tissue. These tissues are character-ized, in monochromatic X-ray imaging, by the linear attenuation coefficients µAdipose( )E and µGlandular( )E depend-ing only on the energy E. In our study we model the breast as a cylindrical phantom of diameter d. This phantom contains a homogeneous material specified by its glandularity G (i.e. the glandular weight fraction). The attenua-tion coefficients of pure adipose, glandular and mixed materials (homogeneous materials with specified glandu-larity G) have been determined from their elemental compositions and densities reported in (Hammerstein et al.35 and Boone and Chavez57). In order to take into account inter-individual variability in the female population, we evaluated different values of breast size d and composition G:
• d={8cm; 10cm; 12cm; 14cm; 16cm} • G={0; 0 143; 0 25; 0 5; 0 75; 1}. . . .
In particular, the value = .G 0 143 was investigated in order to mimic a realistic average glandularity, accord-ing to (Yaffe et al.58).
In our model we supposed to acquire a bCT scan of the ideal phantom, placed with the rotation center in the axis of the cylinder, using a wide monochromatic parallel-beam. The parameters that can be varied are:
• d = diameter of the phantom; • G = glandularity of the phantom; • MGD = Mean Glandular Dose; • E = Energy of the photons; • Δx = pixel size of the detector.
Fixing Δx, for a given set of MGD, E, d and G and using the Eq. 2, we calculated K. The photon fluence φ is obtained from the expression of the air kerma at low energies59:
µ ρ φ = ⋅ ⋅ K E (5) en air In Eq. 5, µ ρ
( )
airen is the mass energy-absorption coefficient for air60. Finally we calculated the total number N ph of photons per pixel impinging on the phantom by multiplying the fluence and the pixel area:
= Δ .
Nph N d G MGDph( , , , x E, ) (6)
Analytical model.
In the analytical model, we define the Contrast to Noise Ratio in bCT (CNRbCT an, ) asfollows: µ µ σ = − Δ CNR E E d G MGD x E ( ) ( ) ( , , , , ) (7) bCT an Glandular Adipose center ,
where µAdipose( )E and µGlandular( )E are the linear attenuation coefficients of the adipose and glandular tissues. Equation 7 was chosen in order to mimic CNR measurement in experimental images where the contrast is usually evaluated between bright (typically glandular) and dark (typically adipose) regions. The fluctuations depend instead on the actual mean breast composition and thickness. For the calculation of the noise, in the analytical model the phantom was supposed to be totally homogeneous. Its linear attenuation coefficient µPhantom( , )G E, depends on G. If the Filtered Back-Projection with cubic voxel of linear size Δx is used to reconstruct the bCT images, the noise in the center of the reconstructed slice can be expressed by its standard deviation:
σ Δ = β Δ ⋅ −µ ⋅ ⋅ −µ ⋅ d G MGD x E ( , , , , ) (8) center N d G MGD x E e( , , , , ) e
ph Phantom G E d( , ) air E ODD( )
The Eq. 8 was derived, as shown in the Additional Materials, by integrating the formula of the Noise Power Spectrum (NPS) for CT images61,62. In the calculation, the parameter β depends on the used filter, the pixel size and the interpolation kernel of the reconstruction algorithm. For a pixel size of 0.12 mm and a linear interpolation kernel, βramlak = .26 49mm−2 for Ram-Lak filter and βHamming = .4 41mm−2 for Hamming filter. A detailed deriva-tion β is provided in the Addideriva-tional Materials. Fixing the dose MGD=20mGy and the voxel size Δ = .x 0 12mm, we calculated, for a given pair ( , ), the total number of photons per pixel Nd G ph for each energy in the range
=
E [10keV, 50keV] with steps of 1 keV. This allows us to plot CNRbCT an, as a function of the energy, to study its
behavior and to calculate its maximum value and the corresponding energy. We repeated this procedure for all the possible ( , ) pairs under investigation, in order to study the energy dependence of the maximum of CNRd G bCT an,
for various diameters and glandularities. We compared also the dependence from ( , ) of the energy that maxi-d G
mizes CNRbCT an, normalizing the curves to its maximum.
Simulation program.
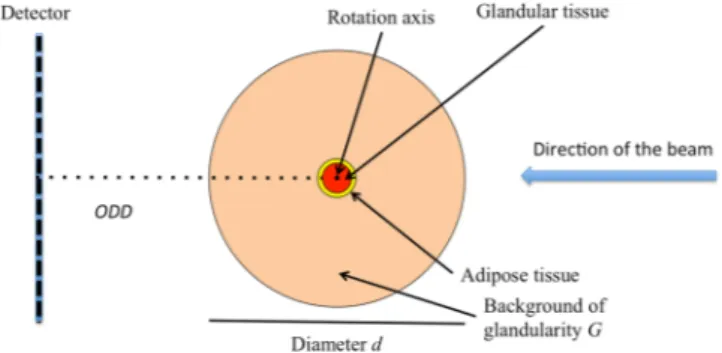
We developed a MATLAB (Release 2017b, The MathWorks, Inc., Natick, Massachusetts, United States) program, to analytically simulate the whole process of bCT acquisition and recon-struction. The breast is here modeled as a cylindrical phantom of diameter d and glandularity G, namely contain-ing a homogeneous material specified by its µPhantom( , )G E. We focused on a slice having a central circular detail of 1 cm diameter made of glandular tissue with µGlandular( )E, surrounded by a ring of the same area, made of adi-pose tissue with µAdipose( )E. A sketch of such phantom is reported in Fig. 1.To simulate the CT scan acquisition, we fixed the value of MGD, Δx and the number of projections nproj per scan. Then, for a given triplet ( , , ), we calculated the expected number of input photons per pixel per projec-d G E
tion (namely Nph/nproj), simulated the forward projection and generated the sinogram of the slice. In this phase we took into account the quantum nature of the photons and their Poisson distribution and assumed the detector to be an ideal photon counter. It should be noted that this implies that a simulation run gives a single realization of a random process. The reconstruction, based on ASTRA (All Scales Tomographic Reconstruction Antwerp) tool-box63, can be made by using all the available algorithms in this environment, for instance the FBP with different filters as well as various iterative methods.
To quantify the quality of the reconstructed slice we used the following metrics:
σ
= −
CNR I I
(9)
bCT sim Detail Ring
Ring
,
where IDetail and IRing are the measured mean values in the central detail and the surrounding ring and σRing is the measured standard deviation in the ring. Using the simulation program, we fixed nproj=1200 over 180° and studied:
• all the available (d, G) pairs;
• the energies in the range =E [10keV, 50keV] with steps of 1 keV; • FBP reconstruction with Ram-Lak and Hamming filters;
• iterative reconstruction with SART (1200 iterations) and SIRT (500 iterations); • different values of MGD to study photon starvation effects.
We compared the behavior and the absolute value of CNRbCT sim, with respect to CNRbCT an, . We also analyzed
the effect of the reconstruction algorithm on the absolute value on CNRbCT sim, and on its dependence from the
energy. Finally, we studied the effect of decreasing MGD down to 1 mGy. If all the other parameters are fixed, we can write:
∝
CNRbCT an, MGD (10)
A similar expression is valid also for CNRbCT sim, except in case of very low MGD when the ratio Nph/nproj is small and the probability of having no counts in some pixels of the detector becomes not negligible.
Results
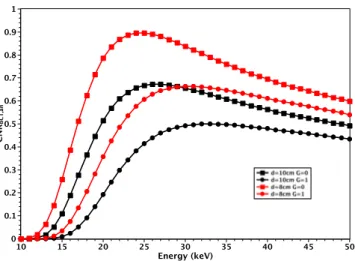
For a given pair (d, G), the plot of CNRbCT an, always shows a maximum inside the energy range under
investiga-tion. The shape of CNRbCT an, , the position and the value of its maximum depend on the values of d and G as
exemplified in Fig. 2 where the FBP with Ram-Lak filter was considered.
In particular, when d or G increases, the value of CNRbCT an, decreases at all the energies. In addition, the
energy corresponding to the maximum shifts towards higher values. Finally, the curves flatten. Referring to Fig. 2, the maximum value of CNRbCT an, for a breast with =d 8cm and =G 0 is 1.42 at 23 keV. In the case of same
com-position and =d 10cm, the maximum of CNRbCT an, decreases to 1.06 and the corresponding energy shifts to
25 keV. Finally, in the case =d 8cm and =G 1, the maximum of CNRbCT an, decreases to 0.97 and the
corre-sponding energy shifts to 30 keV. The values of the maximum of CNRbCT an, , for FBP with Ram-Lak filter and the
corresponding energies are reported in Table 1 for all the investigated (d, G) pairs.
Even if differences in the optimal energy can be observed, it is important to note that, especially in case of large values of 𝑑 and 𝐺, the values of CNRbCT an, are very close in a broad interval of energies around the maximum. For
example, for =d 14cm, = .G 0 5 and FBP with Ram-Lak filter, CNRbCT an MAX, , = .0 51 at 34 keV and > .
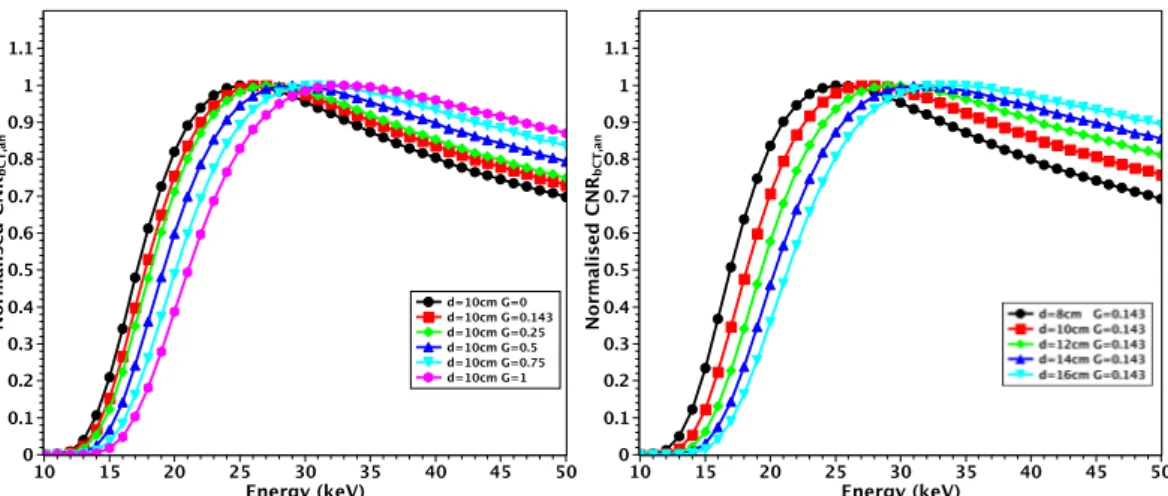
CNRbCT an, 0 44 in the broad interval =E [27keV, 50keV]. The shift in energy and the flattening of the curves are displayed also in Fig. 3 where the plots are normalized to their maxima.
Figure 3 suggests that it is possible to identify a single energy where all the curves are close to each other and
CNRbCT an, values are near to their maximum. At constant =d 10cm, for all possible G, the values CNRbCT an, are
all above the 97% of the maxima at =E 29keV. Likewise fixing = .G 0 143, the values CNRbCT an, are all above the
96% of the maxima for all =d [8cm, 16cm] again at =E 29keV. In Fig. 4 we show a global comparison in which all the investigated d values are included and the glandularity is limited to the range =G [0, 0 25]. This . assumption excludes the cases of breasts of very highly glandularity that, according to (Huang et al.64), are highly rare in female population. In this case, at =E 28keV, the value of CNRbCT an, is still greater than 93% of its
maxi-mum for all the investigated configurations.
In Fig. 5 we compare the CNRbCT an, with CNRbCT sim, for some pairs (d, G). The used reconstruction algorithm
is FBP with Hamming filter. For each energy, the simulation program was ran 5 times in order to evaluate the errors in measuring CNRbCT sim, over multiple realizations. The matching between CNRbCT an, and CNRbCT sim, is
very good both in terms of energy dependence and absolute CNR values.
It is worth noting that the different reconstruction algorithms we have tested act only on noise, thus modifying the absolute value of CNR without changing its shape against the energy. Hence the previous results about the
Figure 2. Plot of CNRbCT an, for =d 8cm (red) and =d 10cm (black) with =G 0 (squares) and =G 1 (circles).
d\G G = 0 G = 0.143 G = 0.25 G = 0.5 G = 0.75 G = 1
d = 8 cm 1.42 @ 23 keV 1.34 @ 24 keV 1.28 @ 25 keV 1.17 @ 27 keV 1.07 @ 28 keV 0.97 @ 30 keV d = 10 cm 1.06 @ 25 keV 0.98 @ 27 keV 0.95 @ 27 keV 0.87 @ 29 keV 0.79 @ 31 keV 0.73 @ 32 keV d = 12 cm 0.81 @ 27 keV 0.75 @ 29 keV 0.72 @ 29 keV 0.66 @ 32 keV 0.60 @ 34 keV 0.56 @ 36 keV d = 14 cm 0.62 @ 29 keV 0.59 @ 31 keV 0.56 @ 32 keV 0.51 @ 34 keV 0.47 @ 36 keV 0.44 @ 40 keV d = 16 cm 0.48 @ 32 keV 0.45 @ 32 keV 0.44 @ 34 keV 0.39 @ 37 keV 0.37 @ 40 keV 0.34 @ 42 keV
Table 1. Maxima of CNRbCT,an and corresponding energies for all the (d, G) pairs under investigation. FBP with Ram-Lak filter was used to obtain the values.
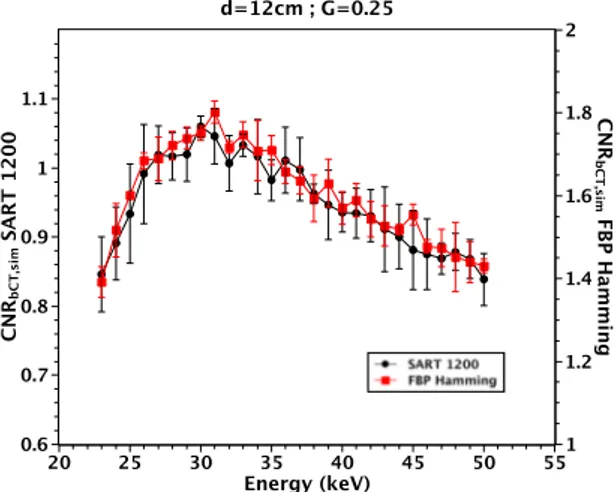
optimal energies, even though obtained supposing FBP, apply also to any of the other tested reconstruction algo-rithm. This is confirmed by Fig. 6 where the curves of CNRbCT sim, ( =d 12cm, = .G 0 25) for FBP with Hamming
and SART iterative algorithm (1200 iterations) are compared.
Figure 3. Plots of normalized CNRbCT an, for =d 10cm and various G (left) and for = .G 0 143 and various d (right).
Figure 4. Plots of normalized CNRbCT an, for =d [8cm, 16cm] and various =G [0, 0 25]..
Figure 5. Comparison between CNRbCT an, (continuous lines) and CNRbCT sim, (symbols) for various d and G.
The used reconstruction algorithm is FBP with Hamming filter. The error bars represent the standard deviation in the CNRbCT sim, values measured over 5 different realizations.
In Fig. 7 we show the reconstruction of the central detail and the surrounding ring for the phantom with =
d 16cm and = .G 0 143. The energy was =E 28keV and the values of MGD were: mGy mGy mGy{1 ; 2 ; 5 ;
mGy mGy mGy
10 ; 20 ; 200 }. The photon starvation effect appears in the case MGD=10mGy where 9 different pixels at different projections had no counts, thus originating the streaking artifact visible in the first row of Fig. 7. Decreasing the radiation dose, e.g., MGD=5mGy, the artifact becomes so strong that the central detail cannot be distinguished. However, the effect can be well corrected by masking the pixels with zero counts, via linear interpolation, as shown in the other rows of Fig. 6. This allows obtaining images at very low MGD, where the quality is mainly limited by the low value of CNRbCT sim, and not by the photon starvation artifacts. Moreover, the
photon starvation can be simply avoided by limiting the number of projections or by increasing the voxel size, obviously at the cost of the deterioration of the spatial resolution.
Discussion
Our study demonstrates that, at fixed MGD, for a breast of diameter d and glandularity G a specific energy that maximizes the CNRbCT an, exists. This energy is generally lower than the one recommended by other previous
studies47,54 and is in agreement with the value obtained by (Weigel et al.53) in the case of = .G 0 5. The results obtained with the analytical model have been confirmed by the simulation software. We showed that the recon-struction algorithm strongly influences the absolute value of CNRbCT sim, but does not modify its energy
depend-ence. Similar observations can be made regarding any processing of acquired data that acts independently from the energy. In conclusion, at fixed MGD, the energy dependence of CNRbCT is defined only by the values of d and
G and a single energy that maximizes it exists. Of course, regardless of the selected energy, an increase of the
absolute value of CNRbCT can be obtained either by varying MGD or by changing the reconstruction algorithm (for example including a smoothing filter) and/or the voxel size, at the cost of a deterioration of the spatial reso-lution. A decrease in MGD causes a reduction in the image quality mainly due to the drop of CNRbCT since the
Figure 6. CNRbCT sim, measured on a phantom with =d 12cm and = .G 0 25 with 2 different reconstruction
algorithms. The error bars represent the standard deviation in the CNRbCT sim, values measured over 5 different
realizations.
Figure 7. Detail of the reconstructions of simulated bCT of the phantom with =d 16cm, = .G 0 143 and =
E 28keV at different values of MGD. In the rows 2, 3 and 4 the photon starvation has been corrected by masking the pixels with zero counts.
photon starvation artifacts represent a less critical issue. Limiting the analysis to breasts with diameters in the range =d [8cm, 16cm] and glandularity in the range =G [0, 0 25] and choosing the energy of the photons .
=
E 28keV, we found that the value of CNRbCT an, is still greater than 93% of its maximum as shown in Fig. 4. This
suggests that this energy can be considered appropriate in most cases.
We underline that the effect of a real detector could be significant on the results especially if its response (in terms of efficiency, spatial resolution and noise) is energy dependent. In this case, the energy response of the detector has to be taken into account and the optimal energies may be different. However, our assumption of an ideal detector is rather realistic for photon-counting devices based on thick CdTe sensors, for the energy range used in this study33. Different results can be obtained also when considering different acquisition geometries. For instance, a variation in the ODD can cause a shift in the optimal energy. Indeed we expect that, whereas air attenuation is stronger for lower energies, shorter ODD values would shift the optimal energies to lower values. Moreover, when drastically reducing ODD, for example in a geometry with the detector close to the sample, or in the case of a much wider X-ray beam, the photon scattering cannot be neglected. Since the scattered fraction of interacting photons grows when increasing the energy, we expect a general reduction of the absolute value of the
CNRbCT and a further shift to lower energies when taking into account the scattering. The amount of such energy shift can be quantified only performing specific calculations for the actual geometry.
Finally, we want to underline that our methods have been developed to mimic the imaging at a specific syn-chrotron beamline and hence a direct, quantitative comparison with bCT systems52,53 based on cone-beam geom-etry, polychromatic beams and detectors with an energy dependent response is not possible at present. However, we believe that our methods to calculate the optimal energy in monochromatic, parallel-beam bCT can pave the way to future studies of more complex cases of systems based on polychromatic and divergent beams and detec-tors with an energy and intensity dependent response.
References
1. Albert, U. et al. 2008 update of the guideline: early detection of breast cancer in Germany. J. Cancer Res. Clin. Oncol. 135(3), 339–354,
https://doi.org/10.1007/s00432-008-0450-y (2009).
2. Van Engen, R., Skaane, P., Thibault, F. & Wilson, A. R. M. Breast imaging and screening – technology update. European Journal of
Cancer Supplements 6(7), 4–6, https://doi.org/10.1016/S1359-6349(08)70294-5 (2008).
3. Kerlikowske, K. et al. Positive Predictive Value of Screening Mammography by Age and Family History of Breast Cancer. JAMA
270(20), 2444–2450, https://doi.org/10.1001/jama.1993.03510200050031 (1993).
4. Kolb, T. M., Lichy, J. & Newhouse, J. H. Comparison of the Performance of Screening Mammography, Physical Examination, and Breast US and Evaluation of Factors that Influence Them: An Analysis of 27,825 Patient Evaluations. Radiology 225(1), 165–175,
https://doi.org/10.1148/radiol.2251011667 (2002).
5. Brewer, N. T., Salz, T. & Lillie, S. Systematic Review: The Long-Term Effects of False-Positive Mammograms. Ann Intern Med.
146(7), 502–510, https://doi.org/10.7326/0003-4819-146-7-200704030-00006 (2007).
6. Ciatto, S. et al. Integration of 3D digital mammography with tomosynthesis for population breast-cancer screening (STORM): a prospective comparison study. The Lancet Oncology 14(7), 583–589, https://doi.org/10.1016/S1470-2045(13)70134-7 (2013). 7. Alakhras, M. et al. Digital tomosynthesis: A new future for breast imaging? Clinical Radiology 68(5), e225–e236, https://doi.
org/10.1016/j.crad.2013.01.007 (2013).
8. Boone, J. M., Nelson, T. R., Lindfors, K. K. & Seibert, J. A. Dedicated Breast CT: Radiation Dose and Image Quality Evaluation.
Radiology 221(3), 657–667, https://doi.org/10.1148/radiol.2213010334 (2001).
9. Lindfors, K. K., Boone, J. M., Newell, M. S. & D’Orsi, C. J. Dedicated breast computed tomography: the optimal cross-sectional imaging solution? Radiologic clinics of North America 48(5), 1043–54, https://doi.org/10.1016/j.rcl.2010.06.001 (2010).
10. O’Connell, A. et al. Cone-Beam CT for Breast Imaging: Radiation Dose, Breast Coverage, and Image Quality. American Journal of
Roentgenology 195(2), 496–509, https://doi.org/10.2214/AJR.08.1017 (2010).
11. Lindfors, K. K. et al. Dedicated Breast CT: Initial Clinical Experience. Radiology 246(3), 725–733, https://doi.org/10.1148/ radiol.2463070410 (2008).
12. O’Connell, A. M. & Kawakyu-O’Connor, D. Dedicated Cone-beam Breast Computed Tomography and Diagnostic Mammography: Comparison of Radiation Dose, Patient Comfort, And Qualitative Review of Imaging Findings in BI-RADS 4 and 5 Lesions. J Clin
Imaging Sci 2(1), 7, https://doi.org/10.4103/2156-7514.93274 (2012).
13. Zhao, B., Zhang, X., Cai, W., Conover, D. & Ning, R. Cone beam breast CT with multiplanar and three dimensional visualization in differentiating breast masses compared with mammography. Eur. J. Radiol 48(1), 48–53, https://doi.org/10.1016/j.ejrad.2014.05.032 (2015). 14. Sarno, A. et al. Cone-beam micro computed tomography dedicated to the breast. Medical Engineering & Physics 38(12), 1449–1457,
https://doi.org/10.1016/j.medengphy.2016.09.012 (2016).
15. Kalender, W. A. et al. High-resolution spiral CT of the breast at very low dose: concept and feasibility considerations. Eur. Radiol
22(1), 1–8, https://doi.org/10.1007/s00330-011-2169-4 (2012).
16. Vedantham, S., Shi, L., Karellas, A., O’Connell, A. M. & Conover, D. L. Personalized estimates of radiation dose from dedicated breast CT in a diagnostic population and comparison with diagnostic mammography. Phys Med Biol. 58(22), 7921–36, https://doi. org/10.1088/0031-9155/58/22/7921 (2013).
17. Sarno, A., Mettivier, G. & Russo, P. Dedicated breast computed tomography: Basic aspects. Med. Phys. 42, 2786–2804, https://doi. org/10.1118/1.4919441 (2015).
18. Prionas, N. D. et al. Contrast-enhanced dedicated breast CT: initial clinical experience. Radiology 256(3), 714–23, https://doi. org/10.1148/radiol.10092311 (2010).
19. O’Connell, A. M., Karellas, A. & Vedantham, S. The potential role of dedicated 3D breast CT as a diagnostic tool: review and early clinical examples. The breast journal 20(6), 592–605, https://doi.org/10.1111/tbj.12327 (2014).
20. Castelli, E. et al. Mammography with Synchrotron Radiation: First Clinical Experience with Phase-Detection Technique. Radiology
259(3), 684–694, https://doi.org/10.1148/radiol.11100745 (2011).
21. Longo, R. et al. Clinical study in phase- contrast mammography: image-quality analysis. Phil. Trans. R. Soc. 372(2010), https://doi. org/10.1098/rsta.2013.0025 (2014).
22. Pacile, S. et al. Advantages of breast cancer visualization and characterization using synchrotron radiation phase-contrast tomography. J. Synchrotron Rad. 25(5), 1460–1466, https://doi.org/10.1107/S1600577518010172 (2018).
23. Longo, R. et al. Advancements towards the implementation of clinical phase-contrast breast computed tomography at Elettra. J.
Synchrotron Rad. 26(4), 1343–1353, https://doi.org/10.1107/S1600577519005502 (2019).
24. Delogu, P. et al. Optimization of the equalization procedure for a single-photon counting CdTe detector used for CT. JINST 12(11), C11014, https://doi.org/10.1088/1748-0221/12/11/C11014 (2017).
25. Brombal, L. et al. Large‐area single‐photon‐counting CdTe detector for synchrotron radiation computed tomography: a dedicated pre‐processing procedure. J. Synchrotron Rad. 25, 1068–1077, https://doi.org/10.1107/S1600577518006197 (2018).
26. Longo, R. et al. Towards breast tomography with synchrotron radiation at Elettra: first images. Phys Med Biol. 61(4), 1634, https:// doi.org/10.1088/0031-9155/61/4/1634 (2016).
27. Delogu, P. et al. Imaging study of a phase-sensitive breast-CT system in continuous acquisition mode. JINST 12(01), C01016, https:// doi.org/10.1088/1748-0221/12/01/C01016 (2017).
28. Sarno, A. et al. Imaging performance of phase-contrast breast computed tomography with synchrotron radiation and a CdTe photon-counting detector. Physica Medica 32(5), 681–690, https://doi.org/10.1016/j.ejmp.2016.04.011 (2016).
29. Brombal, L. et al. Monochromatic breast computed tomography with synchrotron radiation: phase-contrast and phase-retrieved image comparison and full-volume reconstruction. Journal of Medical Imaging 6, 6–9, https://doi.org/10.1117/1.JMI.6.3.031402 (2018). 30. Brombal, L. et al. Phase-contrast breast CT: the effect of propagation distance. Phys. Med. Biol. 63(24), 24NT03, https://doi.
org/10.1088/1361-6560/aaf2e1 (2018).
31. Piai, A. et al. Quantitative characterization of breast tissues with dedicated CT imaging. Phys. Med. Biol., https://doi. org/10.1088/1361-6560/ab2c29 (2019).
32. Brun, F. et al. Post-reconstruction 3D single-distance phase retrieval for multi-stage phase-contrast tomography with photon-counting detectors. J. Synchrotron Rad. 26(2), 510–516, https://doi.org/10.1107/S1600577519000237 (2019).
33. Delogu, P. et al. Characterization of Pixirad-1 photon counting detector for X-ray imaging. JINST 11(01), P01015, https://doi. org/10.1088/1748-0221/11/01/P01015 (2016).
34. Vincenzi, A. et al. Energy characterization of pixirad-1 photon counting detector system. JINST 10(4), C04010, https://doi. org/10.1088/1748-0221/10/04/C04010 (2015).
35. Hammerstein, G. R. et al. Absorbed Radiation Dose in Mammography. Radiology 130(2), 485–491, https://doi.org/10.1148/130.2.485
(1979).
36. Kulkarni, R. N. & Supe, S. J. Radiation dose to the breast during mammography: a comprehensive, realistic Monte Carlo calculation.
Phys. Med. Biol. 29(10), 1257, https://doi.org/10.1088/0031-9155/29/10/009 (1984).
37. Dance, D. R. Monte Carlo calculation of conversion factors for the estimation of mean glandular breast dose. Phys. Med. Biol. 35(9), 1211–1219 (1990).
38. Dance, D. R., Skinner, C. L., Young, K. C., Beckett, J. R. & Kotre, C. J. Additional factors for the estimation of mean glandular breast dose using the UK mammography dosimetry protocol. Phys. Med. Biol. 45(11), 3225–3240 (2000).
39. Dance, D. R., Young, K. C. & van Engen, R. E. Further factors for the estimation of mean glandular dose using the United Kingdom, European and IAEA breast dosimetry protocols. Phys. Med. Biol. 54(14), 4361–72, https://doi.org/10.1088/0031-9155/54/14/002
(2009).
40. Dance, D. R. & Young, K. C. Estimation of mean glandular dose for contrast enhanced digital mammography: factors for use with the UK, European and IAEA breast dosimetry protocols. Phys. Med. Biol. 59(9), 2127–37, https://doi.org/10.1088/0031-9155/59/9/2127 (2014).
41. Wu, X., Barnes, G. T. & Tucker, D. M. Spectral dependence of glandular tissue dose in screen-film mammography. Radiology 179(1), 143–148, https://doi.org/10.1148/radiology.179.1.2006265 (1991).
42. Wu, X., Gingold, E. L., Barnes, G. T. & Tucker, D. M. Normalized average glandular dose in molybdenum target-rhodium filter and rhodium target-rhodium filter mammography. Radiology 193(1), 83–89, https://doi.org/10.1148/radiology.193.1.8090926 (1994). 43. Boone, J. M. Glandular Breast Dose for Monoenergetic and High-Energy X-ray Beams: Monte Carlo Assessment. Radiology 213(1),
23–37, https://doi.org/10.1148/radiology.213.1.r99oc3923 (1999).
44. Boone, J. M. Normalized glandular dose (DgN) coefficients for arbitrary x‐ray spectra in mammography: Computer‐fit values of Monte Carlo derived data. Med. Phys. 29(5), 869–875, https://doi.org/10.1118/1.1472499 (2002).
45. Boone, J. M., Shah, N. & Nelson, T. R. A comprehensive analysis of DgN_CT coefficients for pendant-geometry cone-beam breast computed tomography. Med. Phys. 31(2), 226–235, https://doi.org/10.1118/1.1636571 (2004).
46. Boone, J. M. et al. Technique factors and their relationship to radiation dose in pendant geometry breast CT. Med. Phys., 32:. 32(12), 3767–3776, https://doi.org/10.1118/1.2128126 (2005).
47. Mittone, A., Bravin, A. & Coan, P. Radiation dose in breast CT imaging with monochromatic x-rays: simulation study of the influence of energy, composition and thickness. Phys. Med. Biol. 59(9), 2199, https://doi.org/10.1088/0031-9155/59/9/2199 (2014). 48. Fedon, C., Longo, F., Mettivier, G. & Longo, R. GEANT4 for breast dosimetry: parameters optimization study. Phys. Med. Biol.
60(16), N311, https://doi.org/10.1088/0031-9155/60/16/N311 (2015).
49. Mettivier, G. et al. Glandular dose in breast computed tomography with synchrotron radiation. Phys. Med. Biol. 61(2), 569, https:// doi.org/10.1088/0031-9155/61/2/569 (2016).
50. Oliva, P., Golosio, B., Stumbo, S., Bravin, A. & Tomassini, P. Compact x‐ray sources for mammographic applications: Monte Carlo simulations of image quality. Med. Phys. 36(11), 5149–5161, https://doi.org/10.1118/1.3245876 (2009).
51. Glick, S. J., Thacker, S., Gong, X. & Liu, B. Evaluating the impact of x‐ray spectral shape on image quality in flat‐panel CT breast imaging. Med. Phys. 34(1), 5–24, https://doi.org/10.1118/1.2388574 (2007).
52. McKinley, R. L., Tornai, M. P., Samei, E. & Bradshaw, M. Simulation study of a quasi‐monochromatic beam for x‐ray computed mammotomography. Med. Phys. 31(4), 800–813, https://doi.org/10.1118/1.1668371 (2004).
53. Weigel, M., Vollmar, S. V. & Kalender, W. A. Spectral optimization for dedicated breast CT. Med. Phys. 38(1), 114–124, https://doi. org/10.1118/1.3523599 (2011).
54. Baran, P. et al. Optimization of propagation-based x-ray phase-contrast tomography for breast cancer imaging. Phys. Med. Biol.
62(6), 2315–2332, https://doi.org/10.1088/1361-6560/aa5d3d (2017).
55. Gureyev, T. E. et al. Duality between noise and spatial resolution in linear systems. Opt. Express 22(8), 9087–9094, https://doi. org/10.1364/OE.22.009087 (2014).
56. Buzug, T. M. In Computed Tomography: From Photon Statistics to Modern Cone-BeamCT (Springer, Heidelberg, 2008).
57. Boone, J. M. & Chavez, A. E. Comparison of x‐ray cross sections for diagnostic and therapeutic medical physics. Med. Phys. 23(12), 1997–2005, https://doi.org/10.1118/1.597899 (1996).
58. Yaffe, M. J. et al. The myth of the 50-50 breast. Med. Phys. 36(12), 5437–5443, https://doi.org/10.1118/1.3250863 (2009). 59. Attix, F. H. In Introduction To Radiological Physics and Radiation Dosimetry (John Wiley & Sons, Ltd, 2007).
60. Hubbell, J. H. & Seltzer, S. M. Tables of X-Ray Mass Attenuation Coefficients and Mass Energy-Absorption Coefficients (version 1.4).
National Institute of Standards and Technology, Gaithersburg, MD., [Online] Available: http://physics.nist.gov/xaamdi [2019, July 23] (2004).
61. Kijewski, M. F. & Judy, P. F. The noise power spectrum of CT images. Phys. Med. Biol 32(5), 565, https://doi.org/10.1088/0031-9155/32/5/003 (1987).
62. Riederer, S. J., Pelc, N. J. & Chesler, D. A. The noise power spectrum in computed X-ray tomography. Phys. Med. Biol. 23(3), 446,
https://doi.org/10.1088/0031-9155/23/3/008 (1978).
63. Van Aarle, W. et al. The ASTRA Toolbox: A platform for advanced algorithm development in electron tomography. Ultramicroscopy
157, 35–47, https://doi.org/10.1016/j.ultramic.2015.05.002 (2015).
64. Huang, S. Y. et al. The characterization of breast anatomical metrics using dedicated breast CT. Med. Phys. 38(4), 2180–2191, https:// doi.org/10.1118/1.3567147 (2011).
Author contributions
P.D. and P.O. conceived the project and the methods. V.D.T. made the calculations and wrote the simulation program. P.D., V.D.T. and P.O. wrote the initial manuscript. P.D., V.D.T., L.B., G.M., A.T. and P.O. analysed the data, discussed the results and revised the manuscript.
Additional information
Supplementary information accompanies this paper at https://doi.org/10.1038/s41598-019-49351-2.
Competing Interests: The authors declare no competing interests.
Publisher’s note: Springer Nature remains neutral with regard to jurisdictional claims in published maps and
institutional affiliations.
Open Access This article is licensed under a Creative Commons Attribution 4.0 International
License, which permits use, sharing, adaptation, distribution and reproduction in any medium or format, as long as you give appropriate credit to the original author(s) and the source, provide a link to the Cre-ative Commons license, and indicate if changes were made. The images or other third party material in this article are included in the article’s Creative Commons license, unless indicated otherwise in a credit line to the material. If material is not included in the article’s Creative Commons license and your intended use is not per-mitted by statutory regulation or exceeds the perper-mitted use, you will need to obtain permission directly from the copyright holder. To view a copy of this license, visit http://creativecommons.org/licenses/by/4.0/.