1. Introduction
Robust and sound forest engineering practices spe-cifically developed for different terrain and stand char-acteristics are a crucial element of sustainable forest management systems; such practices must be techni-cally feasible, economitechni-cally viable, environmentally sound and socially acceptable (Heinimann 2004, Marchi et al. 2018). The forest industry around the world is facing common challenges in accessing wood fiber on steep terrain (Visser and Stampfer 2015, Mologni et al. 2016). Steeper slopes require motor-manual felling and yarding with systems such as cable (Cavalli 2012,
Visser and Harril 2017) and helicopter (Lyons and McNeel 2004, Grigolato et al. 2016), but these options are more expensive and much more hazardous com-pared to fully mechanized ground-based harvesting operations (Hert 2016).
Specialized forestry machines can often exceed the upper slope limits established in safety codes in many countries throughout the world (Alam et al. 2013, Visser and Berkett 2015, Session et al. 2017). Current regulations in the province of British Columbia (Canada), for example, restrict the use of ground-based logging equipment to slopes not exceeding 40% (B.C. Reg.
Tensile Force Monitoring on Large
Winch-Assist Forwarders Operating
in British Columbia
Omar Mologni, Peter Dyson, Dzhamal Amishev, Andrea Rosario Proto,
Giuseppe Zimbalatti, Raffaele Cavalli, Stefano Grigolato
AbstractThe forest industry around the world is facing common challenges in accessing wood fiber on steep terrain. Fully mechanized harvesting systems based on specialized machines, such as winch-assist forwarders, have been specifically developed for improving the harvesting perfor-mances in steep grounds. While the mechanization process is recognized as a safety benefit, the use of cables for supporting the machine traction needs a proper investigation. Only a few studies have analyzed the cable tensile forces of winch-assist forwarders during real operations, and none of them focused on large machines normally used in North America. Consequently, a preliminary study focused on tensile force analysis of large winch-assist forwarders was conducted in three sites in the interior of British Columbia during the fall of 2017.
The results report that in 86% of the cycles, the maximum working load of the cable was less than one-third of the minimum breaking load. The tensile force analysis showed an expected pattern of minimum tensile forces while the forwarders were traveling or unloading on the road site and high tensile forces when operating on steep trails, loading or traveling. Further analysis found that the maximum cycle tensile forces occurred most frequently when the machines were moving uphill, independently of whether they were empty or loaded. While the forwarders were operating on the trails, slope, travel direction, and distance of the machines from the anchor resulted statistically significant and able to account for 49% of tensile force variability. However, in the same conditions, the operator settings accounted for 77% of the tensile force variability, suggesting the human factor as the main variable in cable tensile force behavior during winch-assist operations.
Keywords: Steep slope harvesting, ground-based extraction, cut-to-length system, cable tensile force, winch-assist
296/97) following specific steep slope protocols for stability and safety concerns. The slope is not the only limiting factor, however, and fully mechanized ground-based systems are often limited by other ter-rain factors, such as soil strength and/or roughness (Amishev et al. 2009).
There is a considerable interest and recent world-wide effort to improve traction of forestry machines when operating on steep slopes, especially in western North America (Amishev 2016). Various steep-slope harvesting machines with specialized undercarriages and carriers have been shown to safely access and op-erate on terrain up to 70% slope without external sup-port or anchoring (Cavalli 2015). However, there is a limit about the physical feasibility of operating ma-chines on steep slopes (Berkett 2012) that needs to be better defined and understood. A way to increase trac-tion and stability on steep terrain is through assisting forestry machines by winch and cable to various an-chor types. Options for extending mechanized for-estry operations to steep slopes were examined during the 1970s through a feasibility study of a self-contained
cable tether system (McKenzie and Richardson 1978). Steep terrain winch-assist machinery for forestry have been commercially available in Europe since the 1990s and since the early 2000s numerous commercial op-tions have been developed for harvesters (Visser and Stampfer 2015). In New Zealand, the first winch-assist system was pioneered in 2006, while in North Ameri-ca, the first winch-assist unit was designed and manu-factured in 2012.
The subsequent developments in purpose-built winch-assist machines over the last decade have led to the application of this concept as a well defined har-vesting system (Cavalli and Amishev 2017) with po-tentiality for improving the efficiency of harvesting operations (Dyson and Boswell 2016), as well as for improving machine mobility and reducing soil distur-bance through the reduction of slip (Visser and Stampfer 2015). However, even if scientific and anecdotal evidence provided for increased knowledge and un-derstanding, there is still a limited quantitative frame-work with which to evaluate the relationship between cable tensile force, stability, ground pressures, and
slip, especially in terms of site operative conditions and machine specifications (Sessions et al. 2017).
Forestry machines operating in steep terrain should be able to stop in full control at all times with-out reliance on the cable. Lots of winch-assist systems utilize alert devices which sound an alarm in the op-erator’s cab if the anchor moves. These devices are generally based on systems able to detect the anchor movements or the sudden drop of the rope tensile force, usually occurring when anchors have moved, or wire rope/connectors have failed (Amishev 2016). However, there are currently no high-resolution on-board information systems installed to provide de-tailed information about the actual tensile force on the cable/s. Holzleitner et al. (2018) developed a scientific approach with a robust workflow for in-depth moni-toring and analysis of cable tensile force for harvesters and forwarders equipped with integrated winch-assist systems. The Authors tested the methodology and pre-sented results from a short-term study of tensile forc-es of harvforc-ester and forwarder operations in Central Europe. The forwarder analyzed by Holzleitner et al. (2018), following the classification system reported in Brunberg (2004), was a medium-size machine (load capacity 12 ton). There is no evidence of research stud-ies reporting tensile force monitoring on large for-warders (load capacity >14 ton).
The main objective of this study was to analyze the performance of large winch-assist forwarders equipped with integrated winches operating on ordi-nary harvesting sites in British Columbia, focusing on the tensile force monitoring of the support cables. A better understanding of factors affecting cable tensile force during harvesting operations was another objec-tive of the study.
2. Materials and methods
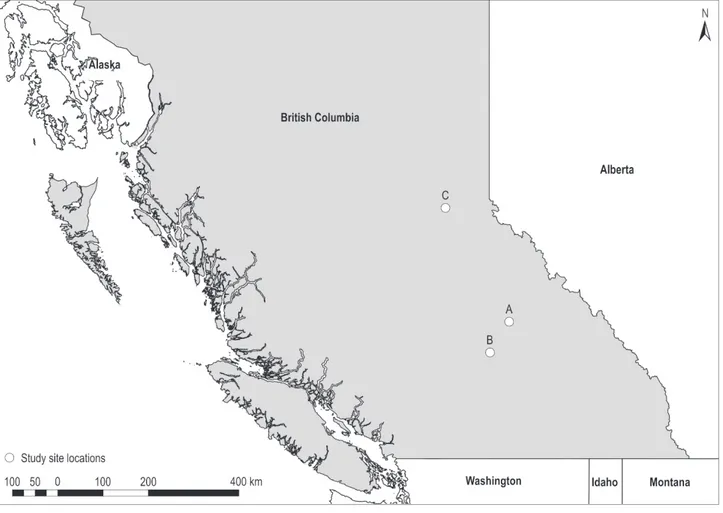
2.1 Study sites and machine descriptionThe study was conducted in three different har-vesting blocks located in the interior of British Columbia (Fig. 1), between Clearwater, Kamloops, and Prince George. All three harvested study sites were com-prized of old-grow forests dominated by hybrid spruce (Picea glauca var. albertiana (S.Br.) Sarg.), subal-pine fir (Abies lasiocarpa (Hook.) Nutt.) and lodgepole pine (Pinus contorta Douglas ex Loudon), with varying stand characteristics (Table 1). The study took place in ordinary harvesting operations where stands were clearcut using a combination of fully mechanized winch-assist and conventional ground-based opera-tions. The winch-assist operations were limited to the
steepest sections of the blocks, interesting between 57% and 70% of the areas.
Three John Deere 1910E eight wheels winch-assist forwarders were monitored. The 21.8 ton forwarders have a maximum payload of 19.0 ton and are powered by a 186 kW engine. The cabs are self-leveling and rotate automatically following the crane movements. A Haas synchro-winch was mounted on the rear frame of each forwarder. The capstan style winch has a drive drum which provides tensile force to the cable, sepa-rately from the storage drum. The winch provides a consistent pulling power synchronized with the for-warder wheel rotation. The operator can adjust the tensile force to ten different settings ranging from 0 to 90 kN. Forwarder maximum speed is 6 km h-1 when winch-assist is active. The store drum holds 400 m of cable with a diameter of 14 mm and a minimum break-ing load of 211 kN. The Haas winch system, includbreak-ing the cable, weighs 1.9 ton.
2.2 Data collection
The data collection was based on the cable tensile force monitoring, synchronized with the time and mo-tion study and with the collecmo-tion of the machine posi-tions on known corridor profiles. The approach pro-Table 1 Timber cruise stand and stem volume
Parameter Site A Site B Site C
Total harvested area, ha 50.2 17.1 116.2
Winch-assist harvested area, ha 29.0 9.7 81.0
Wood volume, m3 ha-1 364 409 374
Average stem net merchantable volume, m3 0.63 0.45 1.10
Average DBH, cm 32.9 27.2 41.3
Stand density, stems ha-1 577.0 909.3 339.7
Species composition by volume, % – – –
Douglas-fir
Pseudotsuga menziesii (Mirb.) Franco – 7 –
Hybrid spruce
Picea glauca var. albertiana (S.Br.) Sarg. 63 10 68
Lodgepole pine
Pinus contorta Douglas ex Loudon – 50 –
Subalpine fir
Abies lasiocarpa (Hook.) Nutt. 37 33 31
Western hemlock
posed by Holzleitner et al. (2018) for monitoring tensile force in winch-assist operations was adapted and integrated with the profile field survey and the load volume estimation. The study was conducted in the fall of 2017 in conditions of snow and freezing tem-peratures.
The cable tensile force was measured by a Cable-Bull® SR22/800 XR sensor (manufactured by the Honigmann Industrielle Elektronik GmbH) positioned close to the anchor. The rated load capacity was 200 kN and the resolution was 0.0127 kN. The recording fre-quency could be set to four different modes 100, 200, 1000, and 2000 Hz. The survey frequency was set to 100 Hz. A diameter compensator enabled pre-calibrating the sensor to measure cable ranging from 14 to 22 mm in diameter. An analogic-digital converter unit was used to connect the sensor to a laptop where the data was recorded through the HCC-Easy software (version 6.02.23). The connections of the sensor and the convert-er wconvert-ere reinforced and isolated to protect the system from the elements and hard contact with the ground.
Two video cameras were installed in the forwarder cabs. One camera recorded the work cycles and mo-tion elements and the second camera recorded the winch settings chosen by the operators. Both cameras were set to acquire videos at 720 ppm with 30 frames s–1. A GNSS sensor, integrated and synchronized with an Inertial Measurement Unit (IMU) – composed by an accelerometer and gyroscope – on a single board mi-crocontroller Arduino®, was installed in the forwarder cabs. This sensor measured the forwarder’s speed, position, and inclination at a registration frequency set to 5 Hz; as the cabs were self-leveling no machine in-clination data was collected. High-quality photos were taken of each load to estimate forwarder load volume. Both back and lateral photos were taken orthogonally to the machine, reducing to the minimum the distor-tions, when the cable was on the ground with no ten-sile force. Forwarding corridor terrain profiles were surveyed by measuring slope and distance using a Truepulse®200 rangefinder at each significant change in ground slope. Anchor positions and survey points were marked using the AvenzaMap® app. Anchor trees species, diameters, and heights were noted. 2.3 Data analysis
The tensile force analysis was completed by com-bining recorded tensile forces with video analysis, load volumes, and corridor profile data. The clock time on the laptop recording the tensile force data was synchronized before each survey session using a web connection. The R software (version 3.2.4) was then
used to synchronize the two cameras and analyze the whole set of data.
The Analysis of Variance (ANOVA) was used for analyzing the differences between different work ele-ments in both mean tensile forces and in average peak tensile forces, utilising the forwarder cycles as the ob-servational unit. If the normality of the data distribu-tion and the homogeneity of the variance assumpdistribu-tions were violated, non-parametric tests were used to per-form the analysis. The relationships between the ten-sile force and potential influencing factors were tested through simple and multiple linear regression analy-ses at a significance level of 0.05.
The in-cab videos were analyzed identifying the forwarder travel direction – uphill, downhill or sta-tionary – and the different work cycles, work elements, and delays following procedures defined in the Basic Time Concepts (Björheden 1991). If two elements over-lapped, the activity with the higher priority (1: highest; 3: lowest) was recorded following the method de-scribed by Fernandez-Lacruz et al. (2013) and Erber et al. (2016), adapted to the present time study. The work elements were:
Þ Travel empty: time spent moving (empty) to the loading site; starts when the forwarder wheels begin to rotate and ends when the boom begins to swing (priority 2)
Þ Loading: time spent loading logs in one trip; starts when the boom begins to swing and fin-ishes when the boom stops swinging (priority 1)
Þ Driving – loading: time spent moving between the different loading spots; starts when the for-warder wheels begin to rotate and ends when the boom begins to swing (priority 2)
Þ Travel loaded: time the loaded machine spends moving to the landing; starts when wheels be-gin to rotate and ends when the boom bebe-gins its swing (priority 2)
Þ Unloading: time spent unloading logs at the landing; starts when the boom begins to swing and finishes when the boom stops its swing (pri-ority 1)
Þ Driving – unloading: time spent moving be-tween different sort piles at the unloading site; starts when the forwarder wheels begin to rotate and ends when the boom begins to swing (prior-ity 2)
Þ Winch control: time the operator spent changing the force settings on the winch control panel (priority 3)
Forwarder load photos were uploaded into CAD software, following a perspective correction through Adobe Photoshop® to reduce eventual minimal distor-tions. Field measurements of forwarder bunk dimen-sions were used for scaling the photos. Load volume was calculated from log diameters and average log lengths, measured directly in the CAD software, as-suming the logs as pure cylinders. Profile data were analyzed through the R software to define terrain slope at any distance from the landings. The tensile force data was combined with the video analysis, the GNSS-IMU data, and the corridor terrain profile data to obtain a data set showing: the cable tensile force, clock time, metric coordinates, distance from the mid-road (from which calculate the distance from the an-chor), ground slope, machine speed, cycle number, and work element. The videos recording the operator settings were analyzed only for one of the operators working in two different corridors.
3. Results and discussion
A total of 14.7 hours of forwarding operations were monitored, recording more than 5.3 million rows of tensile force data. The study included 28 forwarder loads driven by four different operators on eight dif-ferent corridors. All operators were less than 40 years of age and had at least two years’ experience in winch-assist operations. The average slopes of the corridors ranged between 25 and 45%, but is six of them, the maximum slopes exceeded 55%. The corridor lengths varied between 90 and 260 m. Downhill forwarding direction was the most commonly observed method (21 on 28 cycles). According to the operators, this was
because of lower fuel consumption, better traction, and overall improved efficiency compared to uphill forwarding. For this reason, most of the time cut blocks were planned with landings at the bottom and a road/ trail to the top for access to an anchor. Details on cor-ridors features are shown in Table 2.
The average work cycle was 31.6 minutes long, with the loading element accounting for more than one-third of the total time (Fig. 2). Loading and un-loading accounted for 52.2% of the total recorded time, while traveling was 44.8%. Forwarders operated for 72.0% of the time on trails and 28.0% of the time on forest roads.
The forwarder travel distances were measured as the horizontal distances from the forest road centre line in proximity to the trail, assumed as the reference starting point. The distance traveled on the trails, mea-sured as the farthest loading point of the cycle, ranged from 42.5 m to 203.1 m, with an average of 149.1 m (SD 46.4 m). Forwarder distances traveled on the roads, measured as the farthest unloading point of the cycle, ranged from 14.0 m to 203.9 m, with an average of 67.8 m (SD 52.9 m).
The total wood volume forwarded during the study was 523 m3. Volume forwarded by corridor showed a wide range, from 28 to 110 m3, mainly be-cause of different number of monitored cycles per cor-ridor. The average wood volume extracted for each cycle was 18.7 m3 cycle-1 (SD 4.2 m3 cycle-1) ranging between 10.9 to 24.1 m3 cycle-1. A total of 1054 logs were counted and measured by photo analysis. The average log size was 0.50 m3, ranging from 0.13 to 1.60 m3. Table 3 shows details of forwarder travel distances and loads aggregated per corridor.
Table 2 Corridors features
Corridor Site Cycles Operator Forwarding
direction Slope, % Horizontal length, m Inclined length m Mean SD Max 1 A 6 A–B Down 25.4 8.1 39.1 210.4 218.6 2 B 3 C Up 36.6 19.0 75.8 238.6 261.3 3 C 2 D Down 44.2 12.3 68.2 201.4 224.9 4 C 2 D Down 40.6 12.2 58.0 208.7 232.3 5 C 4 D Up 32.6 8.8 42.3 89.4 95.8 6 C 4 D Down 36.1 19.6 55.0 204.4 225.7 7 C 5 D Down 45.3 10.9 58.3 203.4 226.6 8 C 2 D Down 37.1 19.7 66.4 200.0 220.5
3.1 Working load of the cable and tensile force variability
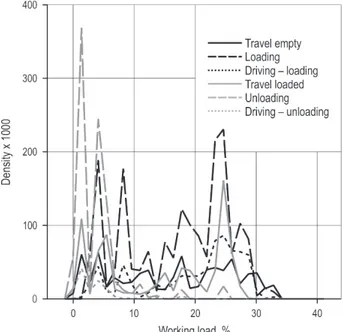
The tensile force was less than 30% of the minimum breaking load of the cable in almost all the cycles. In only four cycles, the peak tensile forces exceed one-third of the minimum breaking load for a total of just 7.3 seconds. The maximum working load (expression of the tensile force as percentage of the minimum breaking load of the cable) recorded in the study was 40.1% and it happened while a forwarder was travel-ing empty. The distribution of worktravel-ing load of the cable shows a characteristic bimodal shape (Fig. 3), similar to the working load distribution presented by Holzleitner et al. (2018). Low working loads occurred mainly during the unloading element at the landing,
where tensile force ranged from 8 to 15 kN. Higher working loads were measured during the work ele-ments operating on steep trails, and in particular dur-ing the loaddur-ing (Fig. 4), which was also the longest element in the average cycle.
For most of the work elements, cable tensile force ranged from 15 to 55 kN, with peak tensile forces oc-casionally exceeding 70 kN (Fig. 5). Minimum tensile forces, less than 10 kN, were recorded during unload-ing and travelunload-ing on the road. The winch control ele-ment occurred most frequently while the forwarders were operating in the loading area, setting the winch considering the trail conditions. Thus, tensile forces recorded during this element assumed values similar to loading and driving on the trails.
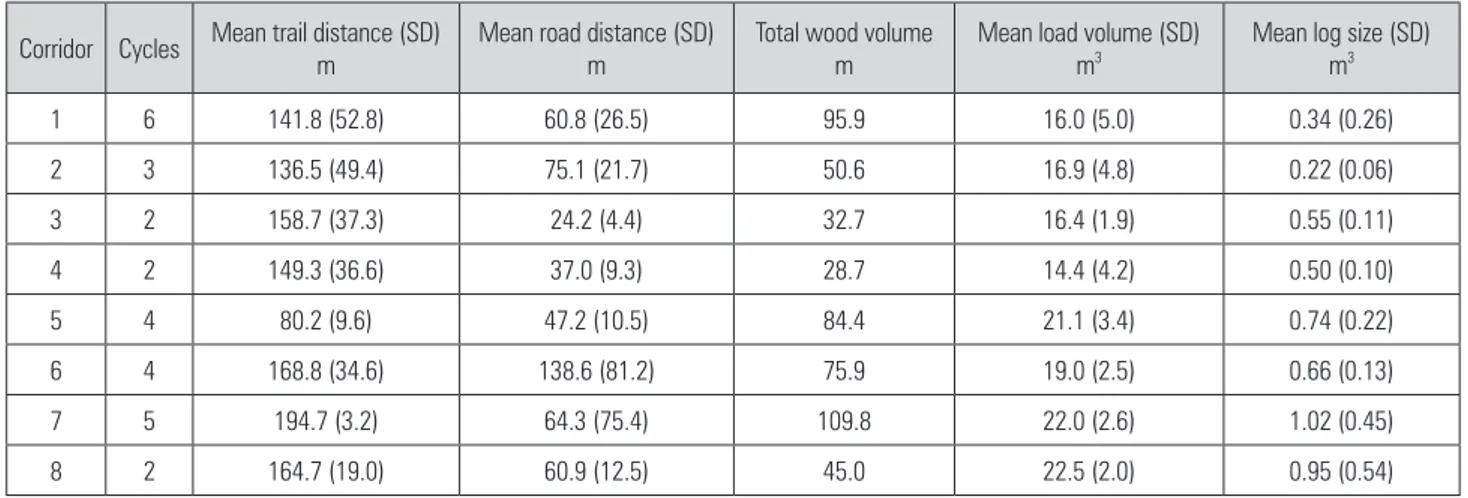
Table 3 Average forwarding distances and load features aggregated per corridors. Values between the brackets report the standard deviation
Corridor Cycles Mean trail distance (SD) m Mean road distance (SD) m Total wood volume m Mean load volume (SD) m3 Mean log size (SD) m3
1 6 141.8 (52.8) 60.8 (26.5) 95.9 16.0 (5.0) 0.34 (0.26) 2 3 136.5 (49.4) 75.1 (21.7) 50.6 16.9 (4.8) 0.22 (0.06) 3 2 158.7 (37.3) 24.2 (4.4) 32.7 16.4 (1.9) 0.55 (0.11) 4 2 149.3 (36.6) 37.0 (9.3) 28.7 14.4 (4.2) 0.50 (0.10) 5 4 80.2 (9.6) 47.2 (10.5) 84.4 21.1 (3.4) 0.74 (0.22) 6 4 168.8 (34.6) 138.6 (81.2) 75.9 19.0 (2.5) 0.66 (0.13) 7 5 194.7 (3.2) 64.3 (75.4) 109.8 22.0 (2.6) 1.02 (0.45) 8 2 164.7 (19.0) 60.9 (12.5) 45.0 22.5 (2.0) 0.95 (0.54)
The cable tensile force of a forwarder completing one cycle forwarding logs downhill is shown in Fig. 6. The first five minutes of data show tensile force peak-ing and then recedpeak-ing to about 5 kN. This was because the forwarder had to return to the road and lower the tensile force as the cable was wedged in a stump. The
sequence of spikes between the loading and driving on the trail is due to the non-perfect synchronization between the machine movements and the winch. Ten-sile force decreased by approximately 10 kN when the Fig. 3 Working load of the cable for the whole dataset Fig. 4 Working load of the cable divided for the different work
ele-ments. Winch control and delay are excluded for better clarity of the graph
forwarder began moving uphill after being stationary. Again, when the machine started moving downhill after a stationary element, there were positive spikes due to the machine moving in the opposite direction of the winch force.
3.2 Mean and peak tensile forces
The highest mean tensile forces were recorded for loading and driving between different loading spots (driving – loading), considering both the whole set of data and the separate subsamples of downhill orient-ed cycles (logs forwardorient-ed downhill to the landing) and uphill oriented cycles (logs forwarded uphill to the landing). Lower and similar tensile forces were re-corded for travel empty, travel loaded, winch control and delay. The minimum values were recorded for the unloading elements (unloading and driving – unload-ing) at the landing.
Regarding the average peak tensile forces, which represent one of the main concerns in tensile force analysis, the highest and similar values were recorded again during the work elements operating on steep trail and in particular during loading and travel emp-ty. Travel empty also represented the element during which the absolute highest peak tensile force of 84.6 kN was recorded. However, analyzing separately the subsample of uphill oriented cycles, the highest average peak tensile forces were recorded for the trav-el loaded trav-element. These considerations suggested the absence of correlation between the total machine weight and the tensile force, while the travel direction
prevailed. Table 4 shows the results of the Kruskal-Wallis and Mann-Whitney-Wilcoxon non-parametric tests, which were applied instead of the ANOVA be-cause of the violation of the normality of data distribu-tion and the homogeneity of variance.
The frequency, with which a work element record-ed the highest tensile force value in the cycle, changrecord-ed Table 4 Tensile force data aggregated per work element
Work element Mean tensile force, kN peak tensile Average force, kN Max peak tensile force kN Travel empty 31.6 (14.85) ab 48.0 (17.4) a 84.6 Loading 38.5 (16.6) b 50.6 (14.6) a 69.9 Driving – loading 37.9 (16.4) b 46.7 (17.1) ab 69.6 Travel loaded 27.3 (10.9) a 46.2 (15.7) a 70.8 Unloading 8.1 (7.0) c 12.6 (13.4) c 53.1 Driving – unloading 6.8 (4.8) c 10.2 (10.2) c 41.4 Winch control 27.6 (14.4) ab 37.5 (21.2) b 68.2 Delay 25.0 (15.6) a 35.8 (16.3) b 63.0
»Mean tensile force« and »Average peak tensile force« represent the data aggre-gate per work element calculated as the mean of different cycles
The »Max peak tensile force« represents the maximum tensile force recorded in the whole dataset for any work element (just one value for any work element) The standard deviation is reported between the brackets. Different letters close to the brackets represent statistical differences between the work elements Fig. 6 Rope tensile force plotted over time for a whole cycle. Continues line shows the distance of the forwarder from the mid road. Two dashed lines represent the safe working load of the cable (33 and 40% of the minimum breaking load)
considering the forwarding direction. For uphill ori-ented forwarding operations, the maximum tensile force was recorded during the travel loaded element in 71.4% of the cycles. Instead, for downhill oriented operations, which represent the majority of the ana-lyzed cycles, the elements which recorded the main frequency in reaching the maximum tensile force was travel empty (47.6% of the cycles), followed by loading (28.6%). Thus, in both the configurations, the maxi-mum tensile forces were recorded while the forward-ers were traveling uphill, during travel empty for downhill oriented operations, and during travel load-ed for the uphill orientload-ed ones. This suggestload-ed again that the total machine weight (and thus also the wood volume transported during the travel loaded element) did not influence the peak tensile force, while the punctual travel direction did. Indeed, considering the cycle as the observational unit, no statistically signifi-cant relationships were found between the maximum tensile forces and the load volume, nor for the for-warding direction (uphill or downhill orientation), and the maximum trail slope. Only the average trail slope was significant (F=22.1, p<0.001, R2=0.460).
3.3 Tensile force influencing factor analysis When the forwarders were operating on the trails, the slope, travel direction, and distance from the an-chors (derived by the distance from the mid-road) resulted as the main significant variables influencing the tensile force and able to explain 49% of the data variability (F=929371.9, p<0.001, Adjusted R2=0.493).
Estimates, coefficients, standard errors, and significant levels are reported in Table 5. While increasing slope is easily connected to the tensile force increase, the increase in the tensile force during moving uphill could be associated with the necessity to contrast the slipping of the wheels. The reduction in the tensile force at an increased distance from the anchor could be mainly connected to losses due to the friction of the cable on the ground and stems, which exceed the effect of tensile force increasing due to an increased differ-ence in altitude (rope weight effect).
In the subsample of data, where setting informa-tion have been analyzed, settings chosen by the op-erator were able to explain alone 94% of the tensile force variability measured at the anchor (F=26889960.5,
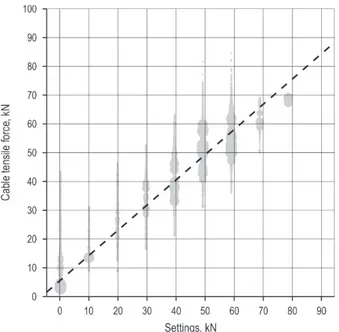
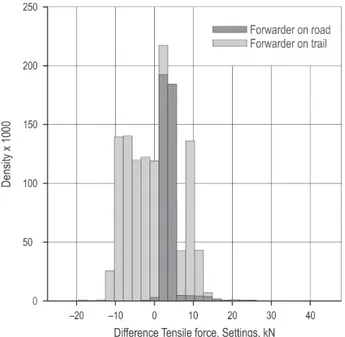
p<0.001, R2=0.944), representing the main factor influ-encing the cable tensile forces. The differences between the recorded tensile forces and the operator settings were normally less than plus or minus 15 kN. Fig. 8 shows the prevalence of an extra tensile force ranging from 2 to 6 kN when the forwarders were operating at the forest road. Considering that most of the cycles were downhill oriented, the forwarders at the forest road were located at about 50 m less in altitude and about 200 m of distance. The weight per unit of length of the cable, multiplied for the difference in altitude and reduced by the partial force losses for friction on the ground (limited in case of very low tensile forces), caused this almost constant extra tensile force during unloading at the forest road. Limiting the analysis to the subsample of data related to forwarding opera-tions on steep trails (thus excluding operaopera-tions oc-curred when the machine was located on the forest road), the relationship between the tensile force and the operator settings (Fig. 7) decreases in strength but still maintains high determination (F=4131298.5,
p<0.001, R2=0.774). The relationship increased when only the data related to active machine movements Fig. 7 Tensile force and settings relationships. Different sizes
repre-sent the point density. Dashed line reprerepre-sents the linear regression
Table 5 Correlation coefficients
Coefficient Estimate of
coefficient
Standard error
of estimate t-value p-value
Intercept 6.172 0.0270 228.905 <0.001 Slope 0.936 0.0001 1864.653 <0.001 Travel direction Stationary –1.200 0.0147 –81.805 <0.001 Travel direction Uphill 3.644 0.0181 201.255 <0.001 Anchor distance –0.050 0.0000 –411.133 <0.001
uphill or downhill (F=3727998.5, p<0.001, R2=0.841) were considered.
The analysis of the main factors influencing the residuals of the tensile force-setting regression did not show a satisfying result because of the limited data available (one-day recording on two corridors). Slope, travel direction, and distance from the anchor were able to explain just 5% of the residuals variability (F=15560.4, p<0.001, Adjusted R2=0.049). However, the same limited dataset was able to explain only 15% of the tensile force variability (F=54052.9, p<0.001, Ad-justed R2=0.152), compared to the 49% of the whole dataset on the trail. Thus, the analysis of operator set-tings, considered as the main factor influencing the cable tensile force in winch-assist forwarding, should be expanded for identifying the main influencing vari-ables.
4. Conclusion
The study found that in 24 of 28 (86%) forwarder cycles, cable tensile forces were less than one-third of the minimum breaking load of the cables. This limit was exceeded for only 7.3 seconds during the 14.7 total operating hours monitored in the study. A series of short duration spikes in cable tensile force was ob-served when the forwarder was loading and then moved. This was attributed to a time lag between the time when the wheels started moving and the re-sponse of the winch, indicating that synchronization
between the winch and the wheel movement was not perfectly matched.
Cable tensile force analysis showed an expected pattern of minimum tensile force while the forwarders were traveling on the road or unloading and high ten-sile forces when operating on steep trails, loading or traveling. Further analysis found that maximum cycle tensile forces were recorded most frequently during traveling uphill, empty or loaded, independently of the load, forwarding direction orientation, or maxi-mum corridor slope. Only the average corridor slope was significant and able to explain 46% of the peak tensile force variability. Analyzing the set of data re-lated to the forwarder operations on steep trail, slope, travel direction, and distance of the machine from the anchor resulted statistically significant and able to ac-count for 49% of tensile force variability. However, in the same conditions, the operator settings account for 77% of tensile force variability, representing the main factor in determining the actual tensile forces.
Cable tensile force is an important factor in assess-ing long-term cable performance and developassess-ing safety guidelines for winch-assist harvesting ma-chines. This study found that the tensile force settings chosen by the forwarder operators account for most of the tensile force variability, suggesting the need for considering the human factor in the safety procedures. Deeper investigation should also be focused on the analysis of the relevance of the operator experiences in winch-assist operations and its relationship with the settings chosen. The present study involved four dif-ferent operators; however, most of the cycles were monitored on a single operator (operator D) and all the operators had similar age and experience. Again, considering the fact that cable tensile forces never reached critical values, further research should con-sider the development of protocols to analyze local-ized cable damages and natural anchor stability, which could represent the worst safety limit in winch-assist operation based on integrated-winch machines.
5. References
Alam, M., Acuna, M., Brown, M., 2013: Self-levelling feller-buncher productivity based on LiDAR-derived slope. Croa-tian Journal of Forest Engineering 34(2): 273–281.
Amishev, D., 2016: Winch-assist technologies available to Western Canada. Technical report No. 37, FPInnovations, Vancouver, British Columbia (Canada).
Amishev, D., Evanson, T., Raymond, K., 2009: Felling and bunching on steep terrain – A review of the literature. Har-vesting Technical Note HTN01-07, Future Forests Research Limited, Rotorua, 10 p.
Fig. 8 Differences between tensile force measured at the anchor and tensile force set by the operator in the winch control panel
B.C. Reg. 296/97: Workers compensation act. Occupational health and safety regulation. Part 26 – Forestry operations and similar activities. Equipment operations – 26.16 Slope limitations.
Berkett, H., 2012: An examination of the current slope gra-dients being experienced by ground-based forest machines in New Zealand plantation forests. M.Sc. Thesis, University of Canterbury, Christchurch, New Zealand, 75 p.
Björheden, R., 1991: Basic time concepts for international comparisons of time study reports. Journal of Forest Engi-neering 2(2): 33–39.
Brunberg, T., 2004: Underlag till produktionsnormer för skotare [Productivity-norm data for forwarders]. Skogforsk, Uppsala, Sweden. Redogörelse 2004(3): 12 p.
Cavalli, R., 2012: Prospects of research on cable logging in forest engineering community. Croatian Journal of Forest Engineering 33(2): 339–356.
Cavalli, R., 2015: Forest Operations in Steep Terrain. Pro-ceedings of the Conference CROJFE 2015 Forest Engineering – Current situation and future challenges, March 18–20, Za-greb, Croatia.
Cavalli, R., Amishev D., 2017: A case study: ground yarding
in mountainous terrain. Proceedings of the 27th Club of
Bo-logna Member’s Meeting – Session 3 KNR 3.2, November 12–13, Hannover, Germany.
Dyson, P., Boswell, B., 2016: Winch-assisted feller-buncher equipped with a continuous-rotation disc saw: short-term productivity assessment. Technical report No. 46, FPInnova-tions, Vancouver, British Columbia (Canada).
Erber, G., Holzleitner, F., Kastner, M., Stampfer, K., 2016: Effect of multi-tree handling and tree-size on harvester per-formance in small-diameter hardwood thinnings. Silva Fen-nica 50(1): Article id 1428, 17 p.
Fernandez-Lacruz, R., Di Fulvio, F., Bergström, D., 2013: Productivity and profitability of harvesting power line cor-ridors for bioenergy. Silva Fennica 47(1): Article id 904, 23 p. Grigolato, S., Panizza, S., Pellegrini, M., Ackerman, P., Ca-valli, R., 2016: Light-lift helicopter logging operations in the Italian Alps: a preliminary study based on GNSS and a
video camera system. Forest Science and Technology 12(2): 88–97.
Heinimann, H.R., 2004: Harvesting: forest operations under mountainous conditions. In: Jeffery, B. (Ed.), Encyclopedia of Forest Sciences. Elsevier, Oxford, 279–285 p.
Hert, R., 2016: Risk management issues for mechanized har-vesting. Steep slope Conference, Richmond, British Colum-bia (Canada).
Holzleitner, F., Kastner, M., Stampfer, K., Holler, N., Kan-zian, C., 2018: Monitoring cable tensile forces of winch-assist harvester and forwarder operations in steep terrain. Forests 9(2): 1–13.
Lyons, K.C., McNeel, J., 2004: Partial retention and helicopter turn volume. Forest Products Journal 54(1): 58–61.
McKenzie, D., Richardson, B., 1978: Feasibility study of self-contained tether cable system for operating on slopes of 20–75%. Journal of Terramechanics 15(3): 113–127.
Marchi, E., Chung, W., Visser, R., Abbas, D., Nordfjell, T., Mederski, P.S., McEvans A., Brink, M., Laschi, A., 2018: Sus-tainable forest operations (SFO): a new paradigm in a chang-ing world and climate. Science of the Total Environment 634: 1385–1397.
Mologni, O., Grigolato, S., Cavalli, R., 2016: Harvesting sys-tems for steep terrain in the Italian Alps: state of the art and future prospects. Contemporary Engineering Sciences 9(25): 1229–1242.
Sessions, J., Leshchinsky, B., Chung, W., Boston, K., Wimer, J., 2017: Theoretical stability and traction of steep slope teth-ered feller-bunchers. Forest Science 63(2): 192–200.
Visser, R., Berkett, H., 2015: Effect of terrain steepness on machine slope when harvesting. International Journal of Forest Engineering 26(1): 1–9.
Visser, R., Harrill, H., 2017: Cable yarding in North America and New Zealand: a review of developments and practices. Croatian Journal of Forest Engineering 38(2): 209–217. Visser, R., Stampfer, K., 2015: Expanding ground-based har-vesting onto steep terrain: a review. Croatian Journal of For-est Engineering 36(2): 321–331.
Received: May 02, 2018 Accepted: June 13, 2018
Authors’ addresses: Omar Mologni, MSc.
e-mail: [email protected] Prof. Raffaele Cavalli, MSc.
e-mail: [email protected] Assoc. prof. Stefano Grigolato, PhD * e-mail: [email protected] Università degli Studi di Padova Department of Land Environment Agriculture and Forestry
Viale dell’Università, 16 35020 Legnaro ITALY Dzhamal Amishev, PhD. e-mail: [email protected] Peter Dyson, BSc. e-mail: [email protected] FPInnovations
2665 East Mall Vancouver British Columbia V6T 1Z4 CANADA
Assist. prof. Andrea Rosario Proto, PhD. e-mail: [email protected]
Prof. Giuseppe Zimbalatti, MSc. e-mail: [email protected]
Università degli Studi di Reggio Calabria Località Feo di Vito
89122 Reggio Calabria ITALY