DOTTORATO DI RICERCA IN
SCIENZE DELL’INGEGNERIA
CICLO XXIII
COORDINATORE Prof. Trillo Stefano
A 3D ENVIRONMENT FOR SURGICAL
PLANNING AND SIMULATION
Settore Scientifico Disciplinare ING-INF/05
Dottorando Tutore
Dott. Chiarelli Tommaso Prof. Lamma Evelina
_______________________________ _____________________________
(firma) (firma)
Tutore esterno
The use of Computed Tomography (CT) images and their three-dimensional (3D) reconstruction has spread in the last decade for implantology and surgery. A common use of acquired CT datasets is to be handled by dedicated software that provide a work context to accomplish preoperative planning upon. These software are able to exploit image processing techniques and computer graphics to provide fundamental information needed to work in safety, in order to minimize the surgeon possible error during the surgical operation. However, most of them carry on lacks and flaws, that compromise the precision and additional safety that their use should provide. The research accomplished during my PhD career has concerned the development of an optimized software for surgical preoperative planning. With this purpose, the state of the art has been analyzed, and main deficiencies have been identified. Then, in order to produce practical solutions, those lacks and defects have been contextualized in a medical field in particular: it has been opted for oral implantology, due to the available support of a pool of implantologists. It has emerged that most software systems for oral implantology, that are based on a multi-view approach, often accompanied with a 3D rendered model, are affected by the following problems: unreliability of measurements computed upon misleading views (panoramic one), as well as a not optimized use of the 3D environment, significant planning errors implied by the software work
system in particular, where image processing and computer graphic techniques have been used to create a smooth and user-friendly completely-3D environment to work upon for oral implant planning and simulation. Interpolation of the axial slices is used to produce a continuous radiographic volume and to get an isotropic voxel , in order to achieve a correct work context. Freedom of choosing, arbitrarily, during the planning phase, the best cross-sectional plane for achieving correct measurements is obtained through interpolation and texture generation. Correct orientation of the planned implants is also easily computed, by exploiting a radiological mask with radio-opaque markers, worn by the patient during the CT scan, and reconstructing the cross-sectional images along the preferred directions. The mandibular canal is automatically recognised through an adaptive surface-extracting statistical-segmentation based algorithm developed on purpose. Then, aiming at completing the overall approach, interfacing between the software and an anthropomorphic robot, in order to being able to transfer the planning on a surgical guide, has been achieved through proper coordinates change and exploiting a physical reference frame in the radiological stent. Finally, every software feature has been evaluated and validated, statistically or clinically, and it has resulted that the precision achieved outperforms the one in literature.
ABSTRACT
(ITA)
L’uso di immagini ottenute tramite Tomografia Assiale
Computerizzata (TAC), e la loro ricostruzione tridimensionale (3D), si è diffusa negli ultimi decenni per l’implantologia e la chirurgia. Un uso comune dei dataset di TAC è di essere gestiti da software dedicati che forniscono un contesto di lavoro su cui effettuare pianificazione preoperatoria. Questi software sono in grado di sfruttare tecniche di elaborazione delle immagini e grafica computerizzata per fornire informazioni fondamentali necessarie per lavorare in sicurezza, in maniera da minimizzare il margine d’errore del chirurgo durante un intervento. Tuttavia, la maggior parte di loro è gravata da mancanze e difetti, che compromettono la precisione e la sicurezza aggiuntiva che il loro uso dovrebbe conferire. L’attività effettuata durante il dottorato di ricerca ha riguardato lo sviluppo di un software ottimizzato per la pianificazione chirurgica preoperatoria. Con questo proposito, è stato analizzato lo stato dell’arte, e sono state identificate le relative carenze principali. Poi, in maniera da produrre soluzioni pratiche, le mancanze e difetti riscontrati sono stati contestualizzati in un campo medico in particolare: è stata scelta l’implantologia dentale, in relazione alla disponibilità a supportare questa ricerca da parte di un gruppo di implantologi. E’ emerso che la maggior parte dei software per l’implantologia orale, che sono basati su un approccio multi-vista, spesso accompagnato da una vista dedicata al modello 3D della struttura ossea, sono affetti dai seguenti problemi: inaffidabilità delle
cross-sectional incorretti), e l’assenza di riconoscimento automatico di anatomie fondamentali (come il canale mandibolare). Perciò, è stato seguito un approccio 3D, e definito un software di pianificazione nello specifico, integrando tecniche di elaborazione delle immagini e di grafica computerizzata. Il risultato è un ambiente 3D pratico, semplice, e completamente integrato, su cui lavorare, per la simulazione e pianificazione implantare orale. Si è definito un algoritmo di interpolazione, applicato sulle immagini TAC assiali, per produrre un volume radiografico continuo ed un voxel isotropico, in maniera da ottenere un contesto di lavoro su cui effettuare misure corrette. La possibilità di ricostruire arbitrariamente, durante la pianificazione, i migliori piani cross-sectional per conseguire misurazioni corrette, è ottenuta tramite interpolazione e generazione di texture. Anche il corretto orientamento degli impianti pianificati è facilmente conseguibile, sfruttando una maschera radiologica equipaggiata con reperi radio-opachi, indossata dal paziente durante la scansione TAC, e ricostruendo le immagini cross-sectional lungo le
direzioni preferite. Il canale mandibolare è riconosciuto
automaticamente tramite un algoritmo adattivo, appositamente sviluppato, basato sulla segmentazione statistica e l’estrazione di superficie. Poi, mirando al completamento dell’approccio globale, è stato implementato l’interfacciamento tra il software ed un robot antropomorfo, in maniera da poter trasferire la pianificazione su una
guida chirurgica, ed è stato ottenuto tramite appropriati cambi di coordinate e sfruttando un riferimento fisico nella mascherina radiologica. Infine, ogni soluzione software implementata è stata valutata e convalidata, statisticamente o clinicamente, e la precisione ottenuta è risultata essere nettamente superiore alla corrispettiva in letteratura.
INTRODUCTION 11
CHAPTER 1: MEDICAL IMAGING 15
1.1 COMPUTED TOMOGRAPHIES 16
1.2 DICOM 3 FORMAT 17
1.3 RESEARCH OBJECTIVES 18
1.3.1 COMMON MULTI-VIEW CONTEXT 21
1.3.2 VOLUME ANISOTROPY 25
1.3.3 INCORRECT WORKING PLANES 28
1.3.4 LACK OF ANATOMIES AUTO-IDENTIFICATION 32
1.3.5 GOALS SUMMARY 34
CHAPTER 2: FULLY 3D SOFTWARE 37
2.1 PROPOSED APPROACH 37
2.2 PLANNING ENVIRONMENT 40
2.2.1 GRAPHIC USER INTERFACE 41
2.2.2 3D VIRTUAL WORLD 43
2.2.3 IMPLANTS LOADING 55
2.2.4 PLANNING MANAGEMENT 57
CHAPTER 3: ISOTROPIC WORK CONTEXT 63
3.1 2 PASS INTERPOLATION ALGORITHM 63
3.1.1 FIRST STEP 64
3.1.2 SECOND STEP 66
3.2 SYSTEMATIC EFFECT 69
4.2.1 AUTOMATIC IDENTIFICATION INTEGRATION 86
4.3 RUNTIME IMPLANTS CENTERING 87
4.4 CROSS RECONSTRUCTION EVALUATION 89
4.5 AUTOMATIC IDENTIFICATION VALIDATION 95
4.6 CBCT IMAGES COMPATIBILITY 98
CHAPTER 5: ANATOMY RECOGNITION 101
5.1 MANDIBULAR NERVE CANAL DRAWING 102
5.1.1 CATMULL-ROM SPLINES 103
5.1.2 CURVE DESIGN 106
5.2 AUTOMATIC RECOGNITION 109
5.3 MANDIBULAR CANAL ANALYSIS 115
5.4 ALTERNATIVE APPROACH 117
5.5 DISCOVERING PROBE ALGORITHM 122
5.6 CANAL RECOGNITION EVALUATION 130
CHAPTER 6: ROBOT INTERFACING 141
6.1 STENT-ROBOT INTERFACING DEFINITION 141
6.2 IMPLANTS TRANSFER 146
6.3 PLANNING TRANSFER PRECISION 151
CHAPTER 7: RELATED WORK 157
7.1 PREOPERATIVE PLANNING SOFTWARE 158
7.2 MANDIBULAR NERVE CANAL RECOGNITION 165
CHAPTER 8: DISCUSSION 175
8.2 FUTUREWORK 183
8.3 ACKNOWLEDGMENTS 185
REFERENCES 187
Medical imaging is the subject involving the study of the application of image processing techniques, computer graphics, and computer vision in support of diagnostic imaging. Nowadays medical imaging indeed is a research field: it includes computer science competencies related to computer graphics, image processing, computer vision, and medical ones, related to necessities definition, meta-products comprehension, and result interpretation. This field has born because of the transition from film bases systems, as common radiographic devices, to digital and computer-based ones: during the years, different procedures have been developed, and each one has found the proper medical field, in relation to determinant factors like the set -up and maintenance costs, level of danger in regard of the patient, timings (exam duration and number of necessary scans), and inherent characteristics of the achieved product (more suitable for morphologic highlighting of certain tissues rather than others, or more app ropriate for functional-metabolic tracing). Among the most used procedures there are Computed Tomography (CT), Magnetic Resonance Imaging (MRI), Medical Ultrasonography, and Nuclear Medicine. The result of these techniques is an informative dataset that, through the proper software, provides a detailed visualization of the anatomical section (or metabolic path) of interest for the related doctor, without the need of a surgical intervention.
planning, the doctor is then able to perform the surgical operation less invasively and with more safety for the patient, due to the wider knowledge obtained about the area of interest. In implantology in particular, but in general in the surgical field, the doctor needs complete information about structures and tissues which he/she has to operate upon, in order to get a precise planning, which the common images only, the ones obtained by radiographic devices, are not enough for. With the aim of helping the operator, there are preoperative planning software that takes care of calculating fundamental data to operate in safety, and provides, through digital reconstruction, meaningful anatomical sections different from the axial one (the common horizontal slice plane, that is orthogonal to the body axis). Therefore, the purposes of the preoperative planning, as well as of the related software, are the minimization of the surgeon possible error during the surgical operation, that is reaching the complete predictability of the surgical act, the decreasing of the operative invasiveness and patient postoperative discomfort, as well as the significant reduction of surgical timings. However, still nowadays, most of the state-of-the-art planning software carry on deficiencies and flows that compromise the precision and additional safety that their use should provide.
The research accomplished during my PhD career has concerned medical imaging, and the development of an optimized software for surgical preoperative planning in particular. It has involved the study of the state-of-the-art software and technologies about, the collaboration with field experts, as well as the resulting acquisition of the necessary medical knowledge. Then, the solution of the most significant planning software common lacks and defects identified ha s been defined as main research objective, in order to provide to doctors a really reliable and precise work context to accomplish planning on, significantly supporting minimally invasive surgery as a result. The four most meaningful deficiencies identified, and consequently which it has been researched a solution for, concerned unreliability of measurements computed upon these tools, both for 1) misleading views and 2) lack of volume anisotropy handling, 3) significant planning errors implied by software provided working planes, and 4) absence of automatic functionalities to support the operator about fundamental anatomies recognition. The related accomplishment needed the definition of the most suitable protocol, the development of several innovative algorithms, and the application of advanced image processing and computer graphics techniques, as well as an intensive testing and experimentation.
The aim of this thesis is to report the doctorate activity performed, to explain the adopted approaches, and to describe the developed solutions. The dissertation is organized as follows.
The innovative software framework developed, thought to provide a reliable and optimized fully 3D work-context, as well as the defined global approach, is described in Chapter 2, together with its most important features and the technology involved.
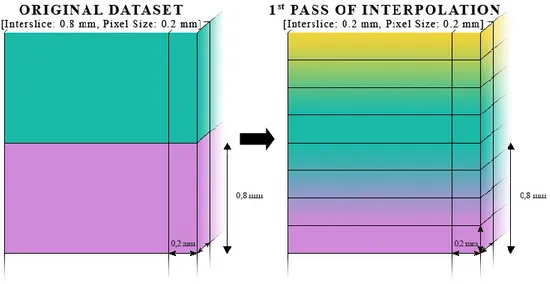
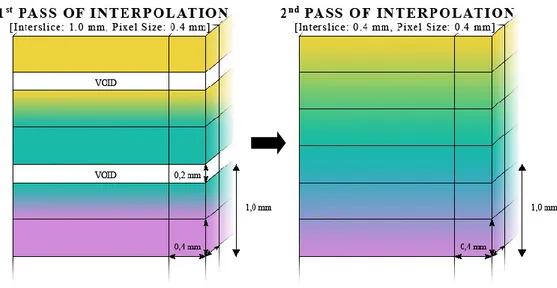
Chapter 3 shows the 2 passes interpolation algorithm developed in order to correctly handle anisotropy datasets, with its evaluation at the end.
Chapter 4 shows manual and automatic solutions concerning the reconstruction of correct and optimal working planes, and consequent related features, including their evaluation and validation.
Techniques and procedures used to achieve the relevant anatomy recognition, both manually and automatically, as well as their evaluations, are reported in Chapter 5.
Moreover, in Chapter 6, in order to complete the approach def ined, is described the interfacing of the software with a robot, that is able to produce a surgical guide based on the accomplished planning.
Finally, Chapter 7 and Chapter 8 are respectively dedicated to a survey of related works and conclusions about the accomplished activity. Then, the dissertation ends with references and publications.
Starting with the first X-ray Computed Tomographies (CT) devices in the early ’70, it has been possible to observe a significant evolution of techniques of acquisition, reconstruction, and improvement, as well as compression, memorization, analysis, and visualization of medical diagnostic images. From film working systems, as common radiographic devices, providing analogical, static, and two -dimensional information, it has been passed to computers based devices, that work with digital, possibly dynamic, and most three-dimensional data (Duncan & Ayache 2000). The Medical Imaging has born due to the described transition towards digital information: this field is related to the study of diagnostic imaging through the application of advanced image processing and state-of-the-art computer graphics techniques. Nowadays this discipline has great importance in several medical fields: the use of the Computed Tomography (CT) is a common practice, and it plays a fundamental role assisting pre-operative planning, due to the high resolution of images produced. As a consequence, software systems have been realized to take advantage of the CT devices and support the doctor, providing analysis and synthesis functions and helping to formulate th best diagnosis, in order to ease and optimize the related medical procedures.
1.1 COMPUTED TOMOGRAPHIES
Computer Tomography devices are the most used in diagnostic imaging, due to their low cost and high spreading. Data acquisition is achieved through rotation around patient’s body of a X-ray emitter and some receivers, coherent each other, in correspondence of the are to be analized. Information obtained through this device consists of a series of transaxial images orthogonally aligned to the patient height/vertical axis, that is the axis that corresponds to the patient’s spine. Each of those image is called slice because it represents a determined thickness cut of the patient’s body. Other relevant slices properties are the resolution, that is defined by length and width of the image in pixels (from picture element, the image measure unit), the pixel size in millimetres, homogenous in the transaxial plane (length equal to width), and their amount, that depends on the constant distance among the slices (called interslice) and the total extent of the analyzed area. Moreover, due to the fact that these slices have a third dimension, that is the thickness, it is also possible to refer to the single slice measure unit as voxel (from volume element), that is the three-dimensional (3D) version of the two-dimensional (2D) image pixel. Every slice voxel ideally represents the absorption factor of the tiny corresponding volume of the patient’s body. In order to define the amount of absorption, it has been defined a standard measur e unit known as Hounsfield Unit (HU), that has its zero in the water absorption level (0 HU), and it corresponds to -1000 HU for air and above 200 HU for bones.
Although the following three-dimensional reconstruction (slices stacking) can be achieved on any slices series, correctness and precision of the final image are directly correlated to constraint set and consequently to data integrity. As a result, the parameters choice, like slice thickness and interslice value, is an important step. It has also quite relevant that, even if technically it is possible to achieve high resolution scans, and better quality images as a consequence, it does imply an higher dosage of radiation on the patient and a longer time of exposure, decreasing the operation safeness. Moreover, the time factor would also increase the chance of patient movements during the scanning, apart from possibly create greater discomfort. In this regard, it has been also developed a fast and low radiation factor technique, called Cone Beam Computed Tomographies (CBCT), due to its cone-like X-ray shape. Images achieved with CBCT scan devices are usually characterized by a lower resolution in comparison to the CT ones, however the research works hardly on it, and it is possible to wish for good-quality, low-radiant computed tomographies in the future.
1.2 DICOM 3 FORMAT
Initially, every CT scan manufacturer defined its own file format to store the digital information provided by the device. Obviously, this generate confusion and impeded the CT spread. Thus, the Association
of Electrical and Medical Imaging Equipment Manufacturer (NEMA) decided to develop an industrial standard of communication for medical images, called DICOM, the last official version of which is the third (DICOM/3). This standard handles many types of medical images, above all radiological ones, including related information . Actually DICOM/3 is more like a collection of rules to define medical imaging information sharing, among which there is the classification of a series of “objects” that identify radiological data (“patient”, “image”, etc…) and how they are related each other. This is the known Object Oriented structure, in which every object includes related series of attributes (e.g. the patient object will contain personal records, hospitalization data, etc…).
It is taking advantage of this format, that CT processing software systems are able to achieve all the needed information from CT datasets, elaborating and processing them in order to support the doctor diagnosis and planning.
1.3 RESEARCH OBJECTIVES
The use of Computed Tomography images and their three-dimensional reconstruction has spread in the last decade for surgery. Image processing tools and computer graphic techniques for animation and visualization are powerful ways to achieve measure of size, distance and texture consistency. Many tools are currently used as
semi-automatic ones: starting from CT images, after 3D reconstruction, the operator (radiologist or surgeon) works on a two-dimensional multi-view environment, characterized by meaningful sections of the original dataset, where measures can be computed. Some of them, besides the 2D views, also show a 3D surface rendered model of the bone (e.g., for oral implantology, SurgiCase and SimPlant, Materialise and CAD Implant, Praxim). The output of these latter systems can be exploited in order to produce 3D stereolithographic models. However, these stereolithographic models correspond only to the bone structure, and do not fit with the human anatomy the implantologist does operate upon.
Even if nowadays there are several pre-operative planning software tools commercially sold, the state of the art has not completely reached a very high level of reliability yet, and this gain a particular relevance in consideration of any related surgical operation that follows. There are still some structure weak points, deceiving or imprecise working views, unreliable achievable measurements, and lacks in general. Few of the top-rated software showed to handle some of these deficiencies, and no one demonstrated to take care of many of them and to provide evidence of a very high precision to report it. The main focus of this research has been about developing of a procedure aimed at increasing precision and safeness of surgical acts and implantological applications in general, and a reliable state of the art software able to support the overall procedure, in particular. With this intention, the first step has been to analyse and define the significant
problems of the current planning software in commerce. The most relevant ones that have been identified are the follows:
1. outdated common multi-view working contexts: due to tradition or habits, it may happen that cut views are provided by software independently from their being obsolete or misleading;
2. complete or partial absence of CT dataset anisotropy handling; 3. implicitly distorted working views and consequent implied
imprecision in measurements computed over them;
4. lack of automatic algorithms to help the doctor to identify anatomies relevant for the related surgical operation, in order to support the overall precision.
Once defined the objectives in general (i.e. solving the four problems described), it has been decided a specific field to apply the research onto, in order to start finding solutions for real problems, leaving the opportunity to extend them to similar cases in other surgical areas . The medical field that has been chosen to focus about is oral implantology, due to the option to take advantage of a dentist study in Cattolica (RN, Italy), with its related labs, instrumentations, and materials. This possibility has been a courtesy of Dr. Franchini, the study owner, that also helped sharing its medical knowledge. Thus, the identified general problems have been concretized into t he specific ones of the chosen field, and solutions found have been reported in this volume.
In the following subsections the significant lacks 1÷4 above are described in details for the case of oral implantology planning software systems.
1.3.1 COMMON MULTI-VIEW CONTEXT
The typical oral implantology planning software systems provide a quite common multi-view context of work: loaded the CT dataset, they are able to three-dimensionally reconstruct the radiographic volume, cut it following determined cut planes, and display the consequent working views in the framework of the window.
The common views combination, known as Dentascan in relation to the pioneer software that defined it (DentaScan, GE Medical System), consists of:
axial images, those directly acquired from the instrument (or computed by interpolation, but lying on the acquisition plane); panoramic images, orthogonal to a curve (panoramic cutting
curve) drawn on an axial image that follows the curvature of the maxillary or mandibular ridge (this curve is usually manually identified via a series of data points buccal to the midzone of the bone in an axial image);
cross-sectional (or oblique) images, orthogonal to the previous mentioned series of images.
In Fig. 1.2 is shown the common multi-planar work context described. This multi-view approach is very much spread, and almost every oral implantology planning software provides its framework following that schema, but, after an analysis and some knowledge sharing with implantologists and dentists, it resulted to be not the best to plan surgical operations upon. Essentially, excluding the axial plane, needed to define the others planes and to accomplish diagnosis i n top-down direction for mandibles and viceversa for maxillas, there is only one view on which measures should be computed and planning is actually performed: the cross-sectional images one.
Fig. 1.2. Common multi-view working context
It is upon this one that implantologists compute the fundamental measurements, check areas fitting, and plan implants insertion. The panoramic view, instead, is not really used to plan anything, and surely it cannot be used to achieve important measures from, due to its misleading nature. Actually, the panoramic images are obtained through the projection of a curve plane (i.e. red curve in the top-right green-edged view in Fig. 1.2) on a two-dimensional rectangular one (bottom red-edged view in Fig. 1.2), thus implying incorrect intra-distances, and wrong measures consequently. It remains, though, an
CROSS IMAGES AXIAL IMAGES
orienting view, allowing to clarify objects positions being a third point of view of the radiographic dataset, that is providing a kind of third dimension perspective, but nothing else. It could be affirmed that the panoramic view is necessary to identify some relevant anatomies, but, using the right algorithms and tools, cross-sectional and axial planes can fit to the same role. Therefore, the will to keep this view can be associated to tradition (representing the digital version of the orthopantomogram) and habits (being doctors used to this common software framework), at the cost of providing an unsafe working context to the user.
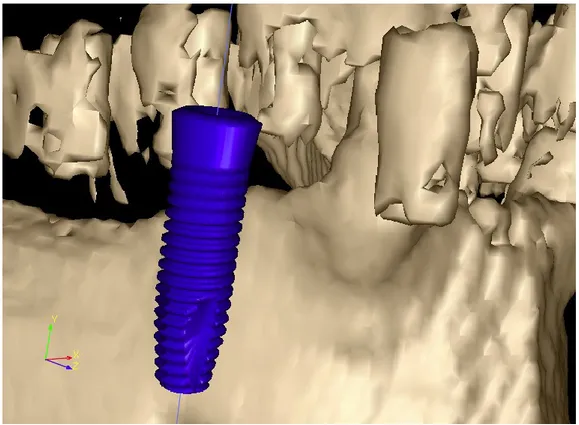
Some of the mentioned software (SurgiCase and SimPlant, Materialise; CAD Implant, Praxim) are also able to provide a 3D dedicated view, in which a model of the bone structure can be three-dimensionally reconstructed throw the use of proper algorithms. Usually, this model has only the role to show the bone structure or to allow the production of a related stereolithographic model. Moreover, apart from few cases (e.g. SimPlant, Materialise), generally the 3D view is not connected with the two-dimensional ones, depriving from the possibility to plan over it as on the first ones, or, even if it is, the communication between the contexts has necessarily to pass through approximating translations of dimensionally different coordinate systems. As a result, this approach, independently from the insertion of a three-dimensionally reconstructed surface, is still multi-view: even if a 3D rendered model of the bone structure can be presented to the user, implant planning is done in a 2D multi-planar environment.
Fig. 1.3. Ad-hoc and multi-view parted 3D model view
In relation to the reported considerations, it appears to be clear that the commonly proposed framework is not the best on which an implantologist may work upon, surely not optimized at all, often structurally rough, and above all misleading.
1.3.2 VOLUME ANISOTROPY
Still nowadays, most of the CT scanners are not beforehand ready to the specific purpose of providing an isotropic dataset by default. Almost always is concern of the implantologist to ask to the radiology responsible about that prerequisite compliance, and even in that case the asked requirement is not granted for sure. In addition, it is not
uncommon or odd for an implantologist to receive anisotropic CBCT volumes too, even if the related scanners are prepared on purpose, and due to their different working system, to isotropy conformity.
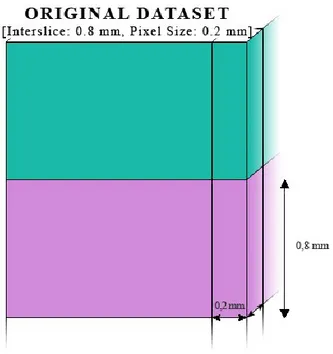
The lack of isotropy appears when the dataset interslice value, that is the distance between the beginning of a slice and the beginning of the following, is not equal to the dataset pixel size. This parameter describes the length and width of the slice/image pixel, that, considering the dataset as a whole, correspond to the related dimensions of the voxel base (see Fig. 1.4). Notice that, actually, the pixel size value is defined by two parameters, but, following the DICOM standard in relation to computed tomographies, they are equals.
The problem related to the anisotropy concerns working on the discussed volume as if it was isotropic, and consequently getting fake results. Actually, most of the pre-operative planning/CAD software are based on an isotropic coordinate system and dataset handling environment. As a consequence, measurements computed on slices visualized in these software, achieved from an anisotropic volume, may carry on an imprecision: this is due to the fact that the user measures in relation to what is shown, but the software provides a measurement value in regard to its own isotropic coordinate system, that does not correspond to the anisotropic volume one. The implied imprecision, that can reach significant values, is inversely proportional to the angle between the measurement direction and the volume/dataset vertical axis (Fig. 1.5). This is due to the contribute of the pixel sized dimensions of the voxel (length and width) that is greater the more the measurement direction tends to be orthogonal to the voxel height axis.
The anisotropy systematic effect implied on a measurement can be calculated as follows: ) ( ) cos( 2 I L S S M S P I M s L s s s
Whereas P is the pixels-size value, I is the interslice one, represents the angle between the measurement direction and the volume vertical axis, and L corresponds to the expected measure. Once calculated the maximum systematic effect over a slice height Ms, it is possible to
obtain the real systematic effect implied over a slice height (Ss), and
consequently also over a specific measurement (SL).
1.3.3 INCORRECT WORKING PLANES
In Section 1.3.1 it has been explained the common multi-view context (DentaScan, GE Medical System) and some weak points in it. In addition to what described, there is a quite relevant fault that needs a separate description. This problem concerns the possibility to imply a significant imprecision into the measurements computed on cross-sectional planes, which are the cut planes actually used to plan (Sansoni 1999; Cucchiara et al. 2004). The cross-sectional images are not parallel each other, and converge at an accumulation line containing the accumulation point where teeth axes, in their turn, converge at (see Fig. 1.6). On these images fundamental data for endosseous implants installation are achieved.
Fig. 1.6. Cross sections converge at accumulation line (above accumulation point) An example of an essential measure is the bone thickness, due to the implant insertion through bone drilling, in order to perform a stable placement of the fixture and allow a good osteointegration. As mentioned before, cross-sectional images, that the software achieve through the use of interpolation algorithms, may imply a significant lack of precision on measurement computed on them: in fact, the cross-sectional plane is almost always not perpendicular to teeth axes, due to natural causes, unless the acquisition transaxial plane is perfectly orthogonal to the tooth axis of interest. However, even in that case, the cross-sectional image would be correctly parallel to that tooth axis only, and in case of a completely or partial edentulous patient, different cutting planes should be reconstructed nonetheless (one for each needed implant). Actually, due to this angle between the cross plane and the tooth axis of interest, on the provided image lies only a part of the tooth itself.
Fig. 1.7. Cross-sectional plane (vertical) orthogonal to the axial one (horizontal)
As a consequence, measures achieved on these images carry on an imprecision, that is inversely proportional to the mentioned slope angle: E M M E * ) cos( 1
Whereas E represents the slope distortion effect, M is the expected measure (or the length of the object to be measured), and M’ is the measurement result. In Fig. 1.9 it is shown the relation between the angle and the obtained measure.
Fig. 1.9. Cross plane slope angle and wrong measurement result d’=d*(1÷cos())
As reported by Sansoni (1999), it has already been demonstrated in literature that CT images are affected by a distortion and that it may consequently lead to negative effects during the surgical act. Talking back about the bone structure thickness measurement, if the measure
obtained was not correct, the surgeon could risk to break through the bone during implant insertion (the error tolerance in these cases is quite less than 1 mm), possibly injuring sensitive nerve tissues seriously, prejudicing facial muscles control as a result.
The described problem could be handled using specific centering tools/ad hoc radiological stents to help the radiologist to align the acquisition transaxial plane orthogonally to the tooth axis of interest (CentraScan, Era Scientific;). However, even if this procedure could be feasible for every radiology study, it would solve the problem for one tooth axis only, implying the need of a different CT scan of the patient for each tooth axis of interest (as mentioned before).
1.3.4 LACK OF ANATOMIES AUTO-IDENTIFICATION
When using pre-operative planning software in order to guide the following surgical act, it is always important to care about relevant related anatomies. Often, carelessness of these anatomies can cause consequences so serious that it appears vital to these kind of software to give them the right importance and to help the doctor to take them into consideration. In oral implantology the most relevant anatomy to care of, and based on which the planning has to be, is the mandibular nerve canal.
Fig. 1.10. Mandibular nerve canal (second white canal from top -left)
As mentioned in Section 1.3, an important deficit of common planning software is the lack of automatic identification of these kind of anatomies, and, in case of oral implantology, this lack involes the mandibular nerve recognition. Actually only a few pre-operative planning software for oral implantology are able to highlight the mandibular canal, and, to the best of the acquired knowledge, none is provided of an automatic feature. When the canal identification feature is present, it is purely manual: it works through interaction of the user to spot points along the slices of a view (generally the cross-sectional one), and finishes drawing the canal following the determined path. Whereas this procedure is surely good and needed, it is preferable to additionally provide an automatic algorithm, in order to assist better implantologists that have lesser computer use capabilities, improving the software safeness in general.
1.3.5 GOALS SUMMARY
In conclusion, as emerged from the contextualization of the general planning software defects in regard of oral implantology, in my PhD career I have faced the following problems:
1. Misleading work context: most of the state-of-the-art planning software for oral implantology are based on a common 2D multi-view environment. The Panoramic view, part of this work context, cannot be used to accomplish correct measurements, due to its construction nature, but it is present nonetheless, consequently leading to planning imprecision. Moreover, even when a 3D dedicated view is present, usually it is not fully integrated in the 2D work context, remaining unused, whereas the planning is achieved on the 2D multi-planar only.
2. Unhandled volume anisotropy: very often, CT datasets provided by the radiologist to the implantologist have an interslice value (the space between a slice and the one stacked immediately after) different from the pixel size one (the minimum picture element on the slice plane). When the slices are stacked to construct a 3D dataset (or volume), this results to be anisotropic, having the voxel (minimum volume element) shaped as a parallelepiped instead of a cube. Then, during the planning, when user measures sections of this volume, the resulting measurements are affected by a possibly significant imprecision, because of measure computing in an isotropic coordinate system on an anisotropic volume.
3. Unreliable cross-sectional planes: among the various views of planning software work context, cross-sectionals are the most important in regard of implant positioning. This views are achieved through an interpolation reconstruction orthogonal to both the axial plane and the panoramic curve, but almost always they are not parallel to teeth axes of interest. Consequently, whenever a doctor accomplishes the needed planning on the cross-sectional view correspondent to the tooth axis of interest, it will follow an error on the related computed measurements. This happens because the interesting area will go through the cross-sectional obliquely, resulting to be incomplete in the related cross-sectional view showed to the user. This problem could be solved asking to the radiologist a CT scan with the trasaxial plane orthogonal to the tooth axis of interest, in order to achieve cross-sectional planes parallel to the tooth axis one. However, this is not an acceptable solution, because usually these cases of study involve more than one tooth of interest, and, to proceed in the described way, it would need a different CT scan for every tooth axis of interest.
4. Lack of mandibular canal automatic recognition: rarely state-of-the-art software in commerce are able to provide functionalities to highlight the inferior alveolar nerve canal, that is fundamental for oral implant planning. When they do, however, is usually through a significant interaction of the user, exploiting manual identification. An automatic recognition feature, instead, is almost always absent from oral implantology
planning software, whereas it would be desirable. Indeed, an automatic tool able to correctly identify the relevant anatomy would significantly help the doctor, speeding up the planning and avoiding resolution-related difficulties in regard of spotting the area of interest, as well as preventing manual identification errors.
Thus, I developed and applied several methodologies and algorithms in order to solve the described problems. The adopted solutions are reported and explained in the following chapters. In Chapter 2 is described the overall approach and the framework that has been opted for, in order to have a reliable and optimized fully 3D work -context, including the technology used and the most important features implemented in. The algorithm developed aiming at correctly handling the anisotropy datasets, together with its evaluation, is reported in Chapter 3. Chapter 4 shows the solutions, both manual and automatic, adopted to manage the construction of multiple correct cross-sectional working planes, plus further related functionalities implemented; at the end of the chapter, evaluation and validation of the described features are reported. In Chapter 5 are explained the procedures developed in order to both manually and automatically recognise the mandibular canal, as well as their evaluations. The completion of the global approach is reported in Chapter 6, in regard of the interfacing of the software with a robot able to produce a surgical guide based on the accomplished planning. Finally, Chapter 7 lists related work, whereas conclusions about the doctorate activity are reported in Chapter 8. References and publications end the dissertation.
Almost all the oral implantology planning software in commerce provide a common frame of work, strongly based on the pioneering one (DentaScan, GE Medical System). This work context has been analyzed and discussed in collaboration with dentists and implantologists, in order to understand if it could be optimized and to possibly identify lacks and defects. It emerged that, as it is, it results to be misleading and not planning focus optimized, due to the deceiving projective nature of the panoramic view and its intrinsic low importance, apart from being usually bonded to a two-dimensional model, confining the 3D view to a conceptually and practically parted environment (see Section 1.3.1).
2.1 PROPOSED APPROACH
With the purpose of improving and optimizing the planning software framework, it has been necessary to define the whole approach involved, in order to be sure of being able to spread the expected optimization and improved safeness in each procedure phase, without loosing the improved precision before to reach the surgical operation. With the described intention, it has been designed a fully three-dimensional approach, that starts from a CT scan (whereas images are
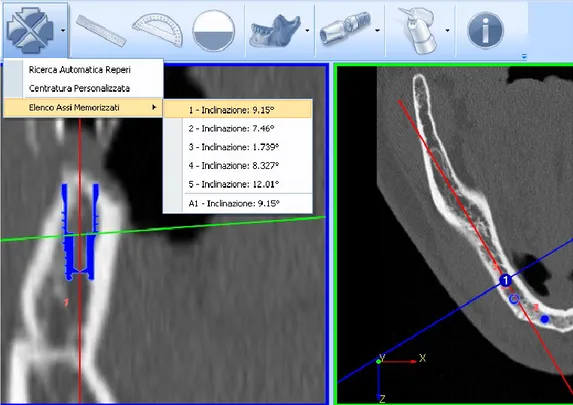
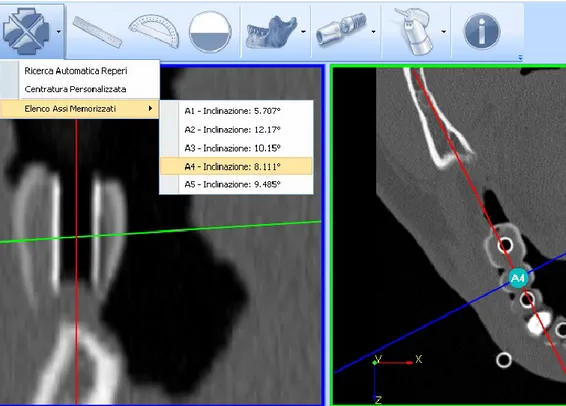
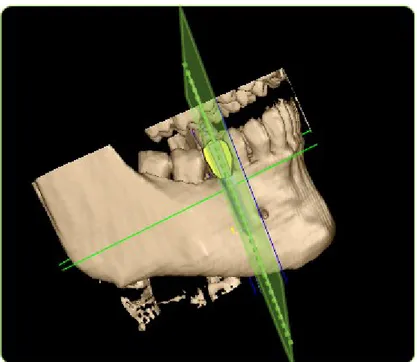
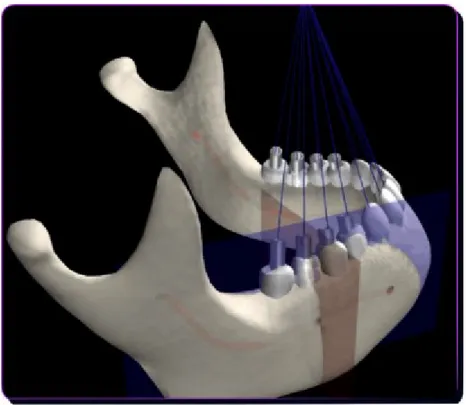
in DICOM format), presents to the planning doctor the 3D surface rendered model and the needed computer-aided design (CAD) implant models, and finishes with the planning driven surgical act, keeping the coordinate system always in the same dimensional level. The user can therefore plan and simulate in a precise and reliable 3D virtual environment the setting of the most suitable implants for the corresponding 3D volume (Chiarelli et al. 2009a; Chiarelli et al. 2009b; Chiarelli et al. 2010a; Chiarelli et al. 2010b). In regard of this, it has been prospected the possibility to have relevant axes in the 3D volume, in order both to help the doctor to identify the best planning planes (see Section 1.3.3) and to provide a physical reference frame to the software. Concerning this, it has been exploited the same method described by Cucchiara et al. (2001) by executing the CT scan on a patient wearing a radiological mask with radio-opaque markers. These markers are installed in the stent following the dentist prosthe tic pre-planning, and they usually represent the best directions for the final implants, anatomy impediments apart. This technique is adopted in the 3D environment especially in order to have relevant axes (i.e., those of the positioned markers) correctly and univocally identified in the 3D volume, but not only. Actually, apart from the pre-planning installed markers, two other ones, parallel each other, can be set into the outer part of the radiological stent, providing a physical reference frame inside the software 3D virtual world. This can be useful in order to univocally identify the axes of the implants planned in the 3D space, as well as their angle and depth, to transfer the planning into a surgical mask to be used during the surgical act, and therefore to
avoid human mistakes in implants insertion into the bone structure. The overall approach is shown in Fig. 2.1, and it can be summarized as follows:
during the CT scan, the patient wears a radiological mask with radio-opaque markers, to have relevant axes in the 3D space; 3D Environment processing is exploited for implant planning; for each planned implant (characterized by a position,
orientation and depth), a surgical guide can be made, by
properly interfacing the 3D environment with an
anthropomorphic robot able to drill the surgical mask along the computed direction e for the computed depth.
2.2 PLANNING ENVIRONMENT
The first step of the pre-operative planning approach consists of loading from the integrated database a case of study, which has been previously added through a built-in DICOM set importer. The proposed methodology, differently from the usual DentaScan multi-view one (SurgiCase and SimPlant, Materialise; Cucchiara at al. 2001; DentaScan, GE Medical System), aims at optimizing the planning operation giving the implantologist a reliable 3D environment to plan on. The whole system does not follow the common multi-view interface, which takes in consideration a bunch of 2D images context of work plus a 3D one reconstructed ad hoc (SurgiCase and SimPlant, Materialise; Cucchiara at al. 2001). It has been avoided this user interfacing approach due to the psychological and practical separation induced on the user and the implied lacks and difficulties of compatibility between the different contexts. Instead, the tool here discussed provides a 3D environment, based on a built-in graphic engine, achieving the multi-view interface through the use of different cameras looking the same 3D object. The context of work, then, is completely integrated, and allows to work and plan on every view, being able to see modifications in real time on each other view.
The developed application has been implemented for the Windows O.S. (XP/Vista/7) and tested on a PC with a Pentium D 3.00 GHz
CPU, 2 GB of RAM and 512 MB of VideoRAM. The software is written in C++ with the support of the following libraries:
- DCMTK (OFFIS e.V.) to handle DICOM images;
- MITK 2.0 (Prof. Jie Tian and Medical Image Processing Group, Institute of Automation, Chinese Academy of Sciences) to manage the three-dimensionally reconstructed radiographic volume;
- MFC and ProfUIS 2.90 for the frame graphics;
- SQLite for the database to store imported study cases
- HDD/USBPhysic and zlib (Jean-loup Gailly and Mark Adler) for devices control;
- OpenGL for the graphic pipeline control and the rendering in general.
2.2.1 GRAPHIC USER INTERFACE
The framework is fundamentally composed by two main graphic elements: a toolbar to advance in the planning procedure and to use the provided features, and the four views on the 3D worl d (see in detail in Section 2.2.2). Every view, in turn, presents only a sidebar, that can be a scrollbar or a threshold control depending on the view function. The results is a very simple, easy, and immediate user-friendly interface. This outcome has been looked for on purpose, aiming at simplifying the doctor planning, and consequently assuring more operational safeness and less faults due to misunderstandings.
Fig. 2.2. Two interface toolbars: main (purple) and 3D one (ora nge)
Parting from the common oral implantology planning software work context, it has been decided to include three kinds of views: axial, oblique, and 3D. Whereas the panoramic view has been removed for the previously mentioned disadvantages, and the axial one has been kept for its importance (see Section 1.3.1), the three remaining views are divided in two oblique ones and a 3D one. The oblique views are actually dedicated to the cross-sectional images, as the common approach ones, but with the great difference that the discussed limit of orthogonality has been removed (see Section 1.3.3), and consequently their measurement faulting as well (see Chapter 4). Finally, the 3D
AXIAL
OBLIQUE
view has been integrated in the main window frame to provide the three-dimensional sensation of planning, providing the sense of comfort given by the reality dimensional level.
2.2.2 3D VIRTUAL WORLD
The developed work environment parts from the common two-dimensional multi-planar one, and it focuses, instead, on a 3D setting. This has been achieved using a single 3D virtual world, and managing the views in order to allow the user to navigate it. Every view is achieved through a mobile camera in the environment, starting in a determined location and watching in a distinct direction. Each view has, moreover, a camera filter that defines the kind of lens: if it is an axial or an oblique camera, the filter will set a particular set of clip planes, in order to reproduce the slice effect, and visualize the proper slice as texture placed in front of the camera lens. In addition, the filter determines also the rendering techniques for the objects in the scene, in order to enhance their visibility and identification. As a consequence the user may navigate the radiographic dataset and visit the world using these cameras: the allowed operations are the cameras ones typical of CAD software, like panning and zooming, or the trackball rotation for the 3D view in specific. Moreover, the axial and oblique views sidebars allows to scroll the cut planes along th e view’s depth axis, whereas in the 3D one there is the control bar to set the threshold for the three-dimensional reconstruction of the bone model.
The whole 3D engine, that is the base of the software technology, is built-in and it has been developed on purpose. Everything, from a 3D point definition to an object slide movement, from the shading to the texture management, from the coordinates converting functions to the visualization modes, is managed by the realized kernel. However, in relation to the focus of the research objectives, and in consideration of the extent of the engine characteristics, in the following paragraphs its main features are described, avoiding to report the whole kernel code base, in order to focus on the most interesting technologies used and functionalities implemented.
VISUALIZATION AND RENDERING
In order to improve items identification and visualization , two different types of rendering have been implemented. The radiographic filter allows to reproduce any cut plane of the axial dataset: this has been achieved using the interpolation methods provided by the MITK library (see Section 2.2), responsible for the radiographic volume handling in general, and producing textures properly attached on the view’s camera lens. The toon shading-line rendering technique (plain coloured polygons without lighting effects, plus highlighted boundary edges), instead, strongly enhances objects silhouettes, emphasizing them over a complex background. The first visualization mode combines the radiographic filter with the toon shading-like rendering technique in order to optimize the planning upon axial (upper right in Fig.2.3) and oblique views (upper and lower left in Fig. 2.3). In
addition, notice that, in the status bar (the bottom border of th e software main frame), a panel shows in real-time both the mouse cursor correspondent position within the radiographic volume and the related Hounsfield density value, with the intention to provide a wider knowledge of the area currently hovered.
Fig. 2.3. Visualization modes: radiographic (top, down -left) and 3D (down-right)
The second visualization mode, instead, is used in the 3D view, and it renders the reconstructed bone model, plus every other possible item in the 3D world, using an automatic Gouraud shading (Gouraud, 1971)
calculator method that has been implemented in the kernel on purpose. Moreover, with the aim of correctly managing and optimizing models transparencies and overlapping, every rendered object is processed by the developed engine sorting pipeline, before to be passed to the OpenGL one.
ROTATIONS
Another relevant built-on purpose feature of the 3D engine is the rotation system. It has been started from a common rotational system based on Euler angles, due to their immediateness and ease of implementation. However, as reported by Hughes (unpublished), Euler angles have important drawbacks:
1) Ambiguity: the rotation sequence is critical (e.g. a XYZ rotation sequence is very different from a ZYX one); due to the lack of an industry accepted standard rotation sequence, there is an inherent risk of mistaken assumption of rotation order in performing analysis and communicating using Euler angles. 2) Singularities: any set of Euler angles in which the second
rotation aligns the axes of the first and third rotations causes a singularity. For an Euler Rotation Sequence where the first and third axes are the same, called a repeated axis sequence, singularities occur for second rotation angles of zero and 180 degrees; for non-repeated axis sequences, singularities occur at +/- 90 degrees.
In relation of these considerations and the need of complete freedom of movement and relocation both in oblique slice definition (see Chapter 4) and 3D camera trackball movement, it has become necessary to change the rotational system into a more suitable one: a quaternion rotational system. The quaternions have been formulated by Sir William Rowan Hamilton in 1843, as an extension of complex numbers, starting from an Euler’s theorem that states that the most general displacement of a rigid body with one point fixed is a rotation about some axis. The quaternions are a noncommutative number system defined by Hamilton as the quotient of two directed lines in a three-dimensional space or, equivalently, as the quotient of two vectors. In detail, Hamilton described a quaternion as an ordered quadruple (4-uple) of real numbers, and every element of H (the Hamilton algebra of quaternions) can be uniquely written as a linear combination of four basis elements:
k q j q i q q11 2 3 4
whereas q1, q2, and q3 are real numbers, and i, j, and k are literals. Sum and product of two quaternions are defined in consideration of the following relations:
1
2 2
2 j k ijk
i
that, in turn, imply the following relations:
. , , , , , j ik j ki i kj i jk k ji k ij
In particular, notice that quaternions form a four-dimensional normed division algebra over the real numbers. Furthermore, they can also be represented as the sum of a scalar and a vector. Actually, a quaternion q = q1 + q2i + q3j + q4k can be described as the pair (q1, v), whereas v = (q2, q3, q4) is a vector in 3. Thus, considering the Euler theorem previously mentioned, it is possible to define a quaternion as the pair (rotation angle, rotation axis):
) 2 / sin( ) 2 / sin( ) 2 / sin( ) 2 / cos( , , , 3 4 2 3 1 2 1 4 3 2 1 e q e q e q q q q q q q with the requirement of q 1. Whereas e1, e2, and e3 are the elements of the rotation axis unit vector ê = {e1,e2,e3}, is the rotation angle,
and q is the quaternion composed by the four Euler parameters q1, q2,
q3, q4. In Fig. 2.4 is shown the quaternion rotation concept. The need
of the four parameters (the 3D vector coordinates and the scalar value) is due to the insufficiency of three numbers to correctly represent 3D rotations. As reported in literature, an analogy is a two dimensional map of the earth: there is no way for which it is possible to map the surface of the earth without distorting either angles or areas. However , once the 2D map is wrapped round a 3D sphere it becomes linear , whereas it was not: in a similar way the 3D space of rotations becomes linear when it is mapped to a quad-dimensional (4D) hypersphere.
Fig. 2.4. Quaternion axis-angle definition
Indeed, notice that unit quaternions (quaternions with norm equal to 1), as the previous axis-angle definition one, when identified in 4
form a 4D hypersphere:
( , , , ) 4 | 12 22 32 42 1
4 3 2 1 3 q q q q q q q q SIn particular, using quaternions for three-dimensional rotations, as in 3D computer graphics, their 4D geometrical representation is an hemi-hypersphere (only half since opposite sides of the hemi-hypersphere represent the same rotation). Thus, following the quaternion arithmetic
and functions, it has been developed from scratch a dedicated inner library. Using the quaternion rotations system implemented, it has been feasible to manipulate the rotation of the 3D view camera through a trackball control. In this way, it is possible to rotate the view around the 3D surface model of the bone structure located in the world center (positionally correspondent to the radiographic counterpart of the 3D reconstructed dataset).
Fig. 2.5. Quaternions powered trackball rotation
MOUSE MOVEMENT DIRECTIONS
3D BONE MODEL
The three-dimensional model of the bone is achieved starting from the radiographic dataset and applying a known algorithm of iso -surface extraction called Marching Cubes (Lorensen & Cline 1987), after having selected a desired threshold value from the view’s sidebar (see for instance the model reconstructed with a threshold of 976 HU shown in Fig. 2.6).
Fig. 2.6. 3D model of the bone structure
This algorithm scans the dataset, slice after slice, and for every four adjacent pixels it builds an imaginary cube having these pixels as inferior face vertices, and the correspondent pixels in the adjacent slice as the superior face ones.
Fig. 2.7. Marching Cube
The next step consists of examining a cube, comparing the vertices density values with the selected threshold, and consequently understanding the inner surface shape using a pattern recognition system. Then, it passes to the next cube and repeat the procedure (therefore the name Marching Cubes).
Then the vertices interpolation points are calculated in relation to the surface shapes found, and the related surface triangular faces can be defined. The algorithm finishes providing the unit normal for each cube vertex, through normalization of the points density difference, and interpolating the achieved normal with every vertex of the related triangle.
MEMORY OPTIMIZATION
Setting the right algorithm parameters, the 3D reconstructed bone structure appears very accurate, although, on the other hand, it can slow down the application performances, due to the massive amount of vertices the 3D surface model is composed by. Thus, apart from selecting a parameters setting of compromise between quality and computer load, it has been necessary to find a way to speed up the software when operating with 3D objects in general. With this purpose in mind, it has been developed a meshes manager, a kind of active module which every request of 3D model memory loading has to pass through. This control manager, using a pointers/tickets system and sharing the same OpenGL context for all the views, is able to optimize the application performance, allowing to load in the video card memory every mesh only once and using the OpenGL display lists pre-compiled commands feature to significantly fast the rendering operations for repeated meshes, in addition of fastening the manipulation of 3D models composed by a huge number of vertices. As a consequence, also the use of many implant models becomes
possible without feeling a significant performance decreasing, allowing the user to accomplish its planning easily (see Section 2.2.3).
ENHANCED INTERACTION
Therefore, everything the doctor may or would like to interact with, either an implant model or the mandibular nerve canal (see Chapter 5), is loaded into the 3D virtual world, the reference frame of which is centered on the 3D radiographic dataset. During the planning, it is possible to use the mouse device to interact with any kind of item loaded in the environment: the sliding and the rotations are easily achievable through an instinctive click and drag, whereas with the right focus on an object model the user has access to the inherent context menu and the consequent item-related permitted operations. Moreover, it has been implemented a selection state (with a related states management system), that, keeping an item selected, allows to slide/rotate it through the use of the keyboard. The main difference with the mouse counterpart resides in the accuracy of the accomplished movement: with this feature, in fact, it is possible to move objects with micrometre accuracy with the purpose to reach great precision, adding final touches after a preliminary positioning. Concerning the technology behind, in order to provide the described type of selection, it has been necessary to move on from the common projective picking, that is based on a sort of line projection into the field of view volume, starting from the viewport clicked point, and reporting every item touched along the path. This typical method can
not work correctly with clipped objects: because of OpenGL pipeline functioning their cut part do exists nonetheless, and the items are consequently reported in the picking result list even if the objects have not been visibly selected. Hence, it has been developed an alternative selection methodology, that is based on the end-image color picking, being able to properly identify and distinguish every object in the scene. This feature can recognise an item class exploiting the view’s colour back buffer, forcing every object to print its own reference ID over, instead of its rendering colour, immediately before the following buffer flush and the successive swap with the foreground one. Consequently the provided picking method correctly avoids clipped parts and identifies everything and only the user select by clicking.
2.2.3 IMPLANTS LOADING
As discussed in the Section 2.2.2, it has been taken in consideration the software need of being able to manage many 3D models. Actually, talking about oral implantology, and prosthesis surgery in general, and having the intention to provide a complete planning software, the possibility to insert in the environment and to manage implant 3D CAD models was a must. In consideration of this, two types of implant model loading have been implemented. Firstly, it has been supplied the option to load implant CAD models from file, in order to allow the dentist to work with the same implants types he/she is used
to. In fact, several implants manufacturer provided the CAD models files of their real implants, with the intention of supporting the planning with their own ones, that have been gathered in file libraries accessible from the software.
Fig. 2.9. A 3D view rendering of an implant CAD model loaded from file
In relation to the usual CAD file formats concerning implants models, it has been developed a file manager module, able to recognize the file format and to support the most common ones, like STL (Stereolithography) and PLY (Polygon File Format), both for the ASCII and binary versions, as well as to handle standard and not
standard file headers. The second implant model loading type, instead, concerns the possibility to design custom models, with the purpose of giving the freedom to manage every planning need, even in absence of the right pre-built implant CAD model. This feature has been accomplished implementing an hollow cylinder automatic construction algorithm that will build the model on demand, using the para meters set ad-hoc by the user.
Fig. 2.10. Custom implant model design window
2.2.4 PLANNING MANAGEMENT
Once loaded implants into the environment, the doctor is able to move and place them, performing the desired planning. In this regard, the software offers a further feature: the option to keep track of the current planned implants. Actually, every operation on an implant in the virtual world dynamically updates its state, and consequently the software is able to know every detail about it at any moment. Thus, it
provides at runtime the list of any current implant in the 3D world (see Fig. 2.11), informing about its updated position and orientation properties, and giving the possibility to center the views’ cameras on it, in order to correctly check its surrounding area (for other related information, see Section 4.3).
Fig. 2.11. Implant centering from the dynamically up-to-date implants list
It is interesting to notice that the feature to slide the views’ cameras on a defined object/point is not strictly related to implants. Actually it has been implemented an utility of views synchronization, that allows the user to select any point in any view via mouse click in order to