DIPARTIMENTO PER L’INNOVAZIONE NEI SISTEMI BIOLOGICI, AGROALIMENTARI E FORESTALI
Corso di Dottorato di Ricerca
BIOTECNOLOGIA DEGLI ALIMENTI - XXVII CICLO
Influence of short-term postharvest ozone treatments in nitrogen or air atmosphere on the metabolic response of white wine grapes
s.s.d. AGR/15
Tesi di dottorato di: Dott.ssa Katya Carbone
Coordinatore del corso Tutore
Prof. Marco Esti Prof. Fabio Mencarelli
Firma Firma
Data della discussione
to my beloved family
The present Ph.D. thesis is based on the following publications
1. Carbone K. (2012). Effect of ozone postharvest treatment on the oxidative metabolism of grapes for wine production. In: Proc.s of the 17th Workshop on the “Developments in the Italian PhD Research in Food Science and Technology”, Cesena, 19-21 September 2012, pp. 289-290
2. Carbone K. (2013). Effects of ozone and nitrogen postharvest treatment on antioxidant compounds of wine grapes. In: Proc.s of the 18th Workshop on the “Developments in the Italian PhD Research in Food Science and Technology”, 25-27 September 2013, Conegliano, Italia, pp. 229-230.
3. Carbone K. (2014). Qualitative characterization, polyphenolic profiling and chemometric analysis of wine white grapes subjected to different ozone postharvest treatments. In: Proc.s of the 19th Workshop on the “Developments in the Italian PhD Research in Food Science and Biotechnology”, 24-26 September 2014, Bari, Italia, pp. 258-262.
4. Carbone K., & Mencarelli F. (2015). Influence of short-term postharvest ozone treatments in nitrogen or air atmosphere on the metabolic response of white wine grapes. Food and Bioprocess Technology, in press.
Summary Abstract – English version This PhD thesis aimed to clarify the effects due to different ozone postharvest treatments on quality traits and accumulation of phenolic healthy compounds in white wine grapes, belonging to Grechetto cv. The thesis also aimed to investigate whether and how the ozone treatments could affect the flavor profile of the grapes. Finally, it aimed to apply one of the most used chemometric tools, the principal component analysis (PCA), to gain insights into variations in the nutritional profiles between different postharvest treatments trying to classify them on the basis of some molecular markers of oxidative state.
Grapes were exposed to ozone gas in air (GO) or in nitrogen atmosphere (GNO) for 12 hours at 10°C and then kept in normal atmosphere for one day at room temperature. Grapes kept at 10°C, for 12 hours without ozone treatment plus one day at room temperature, were considered as the control sample (GC). Results showed that low temperature induced a great change of ripening features only in GC with reduction of weight, loss of sugars (about 20%) and increase in titratable acidity but, above all, 15% of increase in malondialdehyde (MDA).
The use of ozone in air or in nitrogen neither altered the fruit quality attributes nor modified MDA concentration. Ozone provoked a high decrease of hydroxycinnamic acids, compared to the harvest grapes, overall in GNO samples (caftaric acid: -38.8%; coutaric acid: -26.1%). Besides, cold storage treatment without ozone enhanced the antiradical capacity of grapes. Three main flavonols, named hyperoside (quercetin-3-O-galactoside), rutin
(quercetin-3-O-rutinoside) and kaempferol-3-O-glucoside were found in all grape extracts analysed and the total flavonol content increased significantly (p < 0.008) in all the samples starting from 1.79 mg/g dry matter of grapes at harvest (GH sample) up to 2.13 mg/g of GNO one. Both cold storage and ozone in air treatments significantly increased catechin content compared to that in the grapes at harvest (+54.6% and +35.7% for GC and GO, respectively; p < 0.008).
GC-MS untargeted metabolic screening of polar extracts from different treated grapes pointed out a significant variability in the physiological response of grapes to different postharvest treatments, mainly in the first part of the chromatograms for retention times between 3 and 35 minutes (polar compounds). The most representative classes of organic compounds identified were alcohols, ketones, aldehydes, acids, esters, and anhydrides. Among them, sugar degradation products linked with chemical like Maillard reactions were predominant. They were volatile heterocyclic compounds such as furans, furanones, pyranones, alkyl ketones and to a lesser extent pyrazines, and oxazolidines.
Finally, the interrelationships between the parameters analysed and the different postharvest treatments, as well as the relationships among variables, were investigated by principal component analysis. Component loadings showed significant groupings for concentrations of hydroxycinnamic acid derivates and flavonols, which appeared as good candidates to be further considered as biomarkers of the physiological status of grapes. Similarly, the component scores grouped according to the different postharvest treatments, highlighting hyperoside as a useful indicator of the ozone effect on the grape’s physiology.
Summary Abstract – Italian version Lo scopo principale di questa tesi di dottorato è stato quello di chiarire l'effetto esercitato dall’ozono durante il post-raccolta di uve enologiche appartenenti alla cultivar Grechetto sulle caratteristiche fisiologiche e nutraceutiche delle bacche. La tesi ha avuto anche l'obiettivo di indagare se e come i trattamenti di ozono potessero influenzare il profilo aromatico delle uve. Infine, si è applicato uno degli strumenti più utilizzati in chemiometria, l’analisi delle componenti principali (PCA), per acquisire conoscenze in merito alle variazioni nel profilo nutrizionale tra i diversi trattamenti post-raccolta, cercando di classificarli sulla base di alcuni marcatori molecolari di stato ossidativo.
Grappoli di uva varietà Grechetto sono stati accuratamente raccolti a mano, a maturità tecnologica, selezionati e posti su singolo strato in cassette perforate (60 x 40 x 15 cm), di circa 6 kg (±500 g) ognuna. Le cassette sono state quindi poste in celle termo-igrometriche (12 m3) a 10 (±1)°C e al 90% di umidità
relativa, per 12 ore. Gli effetti dell’esposizione all’ozono sui campioni d’uva selezionati sono stati studiati fumigando le uve con un flusso di ozono (1,5 g/h) in atmosfera normale (codice campione: GO) e con un flusso di ozono (1,5 g/h) in atmosfera d’azoto (codice campione: GNO). Come controlli sono stati utilizzati i) uve poste in cella termo igrometrica in atmosfera normale (codice campione: GC) e ii) uve alla raccolta (codice campione: GH). Alla fine dei rispettivi trattamenti le uve sono state tenute per un giorno a temperatura ambiente in atmosfera normale.
La refrigerazione ha indotto delle variazioni importanti nella qualità dei grappoli, producendo perdita di peso, perdita di solidi solubili (circa il 20%), aumento dell’acidità titolabile e soprattutto un aumento del 15% del contenuto di malondialdeide (MDA) rispetto alle uve alla raccolta. Al contrario, la bio-fumigazione dei campioni con ozono, sia in aria sia in atmosfera inerte, non ha provocato alcuna alterazione significativa nei parametri qualitativi delle uve, né nel loro contenuto di MDA. Tuttavia, l’ozono ha provocato una drastica diminuzione nel contenuto di acidi idrossicinnamici, soprattutto nei campioni GNO (acido caftarico: -38,8%; acido cutarico: -26,1%). Al contrario, la refrigerazione ha aumentato la capacità antiradicalica delle uve. Tre flavonoli, l’iperoside (quercitina-3-O-galattoside), la rutina (quercitina-3-O-rutinoside) e il kampferolo-3-O-glucoside sono stati trovati in tutti gli estratti d’uva analizzati e il contenuto di flavonoli totali è aumentato significativamente, rispetto alle uve alla raccolta, in tutti i campioni da 1,79 mg/g di sostanza secca in GH fino a 2,13 mg/g di sostanza secca in GNO. Sia il freddo sia la bio-fumigazione in aria hanno prodotto un incremento significativo nei livelli di catechina rispetto a quelli registrati nelle uve alla raccolta (+54,6% e +35,7% per GC e GO, rispettivamente; p < 0,008).
Lo screening metabolico non mirato degli estratti polari delle uve trattate ha rivelato una significativa variabilità nella risposta fisiologica dell'uva ai diversi trattamenti post raccolta applicati, soprattutto nella prima parte dei cromatogrammi acquisiti per tempi di ritenzione tra 3 e 35 minuti (composti polari). Le classi più rappresentative di composti organici individuati sono state quelle degli alcoli, chetoni, aldeidi, acidi, esteri e anidridi. Tra queste, i metaboliti predominati erano quelli derivanti dalla degradazione degli zuccheri, formatisi presumibilmente a seguito di reazioni tipo Maillard, tra cui
composti eterociclici volatili come furani, furanoni, pyiranoni, chetoni alchilici e, in minor misura, pirazine e ossazolidine.
Infine, le inter-relazioni tra i parametri analizzati e i trattamenti post-raccolta applicati, così come le relazioni tra le variabili investigate, sono state studiate per mezzo dell’analisi delle componenti principali. La matrice delle componenti ha evidenziato un significativo raggruppamento dei campioni analizzati in base al contenuto di derivati degli acidi idrossicinnamici e di flavonoli, che sembrano quindi buoni candidati per il ruolo di biomarcatori dello stato fisiologico delle uve. La rappresentazione grafica delle saturazioni nei tre fattori principali ha permesso di evidenziare chiaramente la separazione dei gruppi sperimentali sulla base dei trattamenti applicati e ha evidenziato il ruolo dell’iperoside come possibile marcatore metabolico della risposta delle uve all’azione dell’ozono.
TABLE OF CONTENTS
Introduction & Research objectives 10
1. Literature review 13
1.1Phytochemical composition of grape berry 16
1.2Major classes of phenylpropanoids in grapes 21
1.2.1 Phenolic acids 21
1.2.2 Flavonoids 24
1.3Biological significance of grape’s phenolics
for human health 25
1.4Postharvest technologies and phytochemical
content of fruit 27
1.5Ozone: general aspects 30
1.6The chemistry of ozone 31
2. Experimental section 37
2.1Plant material & experimental design 38
2.2Analysis of grape’s quality attributes 39
2.3Extraction of grape’s bioactive compounds 40
2.4Analysis of bioactive compounds 40
2.5In vitro antioxidant properties of grape’s extracts 42 2.5.1 Free radical scavenging capacity (DPPH• method) 42
2.5.2 Free radical scavenging capacity (ABTS•+ method) 45
2.6Chromatographic analysis of phenolic compounds using photodiode
array detection (DAD) 46
2.7Analysis of lipid peroxidation 46
2.9Statistical analysis 50
3. Results & Discussion 51
3.1Fruit quality attributes 52
3.2Polyphenols, flavan-3-ols and antiradical capacity 54 3.3Quantification of polyphenols by HPLC-DAD 57 3.4Differentiation of postharvest treatments
by principal component analysis (PCA) 70
4. Conclusions 77
5. References 79
Introduction & research objectives After detachment from the plant and until cell death occurs, fruits remain metabolically active and react to internal and external stimuli and stresses, resulting in compositional changes. Postharvest strategies are generally aimed at reducing metabolic activity and maintaining the physico-chemical properties of fruit at harvest. However, for certain food products, postharvest controlled stresses are applied to induce desired physical/chemical changes and/or to positively affect their phytochemical content (Schreiner & Huyskens-Keil, 2006). This is for example the case of grapes, where postharvest water loss is the prerequisite for raisin production and, after a less intense dehydration process, for making special wines (such as dessert and fortified wines; Costantini et al., 2006).
Recently, an innovative postharvest technology, Purovino®, based on the
treatment of wine grapes with ozone was presented. Ozone, the triatomic form of oxygen (O3), is a powerful oxidising agent with a demonstrated ability to
reduce populations of bacteria and fungi in a diversity of use situations (Kim & Yousef, 2000). Recently, Mencarelli et al. (2011) demonstrated the potential of ozone on grapes as an efficient and safe bactericidal and fungicidal agent, which used during postharvest leads to the complete disposal of SO2 in
winemaking. In 1997, an expert panel reviewed the safety and potential for food processing use of ozone, declaring it to be generally recognized as safe (GRAS) for food contact applications in the United States (Graham et al., 1997). In 2001, FDA has approved the use of ozone on foods. (US FDA, 2001).
It has been suggested that in plants, O3 enters the mesophyll cells via the
cuticle. Here, it is converted into the so-called reactive oxygen species (ROS) such as superoxide anion, hydroxyl radicals, and H2O2 (Mehlhorn et al., 1990).
Unless efficiently metabolized, ROS may alter plant metabolism (Pell & Dann, 1991). Plants metabolize ROS by invoking the endogenous antioxidant defence system (Foyer et al., 1994), which consists of low molecular weight antioxidants, as well as several antioxidant enzymes (Sandermann et al., 1998). Besides, plants respond to biotic and abiotic stresses also through a chemical defence response, synthetizing specific metabolites, some of them recognized as healthy compounds (i.e. stylbens and polyphenols). In this sense, O3 can be
considered a postharvest elicitor that may promote the levels of healthy phytochemicals in fruit and vegetables.
To the best of our knowledge, while there is a body of literature concerning the use of ozone during the storage of table grape, there is still a lack of information on the effect of its use in postharvesting of wine grapes.
Starting from these considerations the present research aimed:
1) to evaluate the effect exerted by different ozone postharvest treatments on the physiological aspects, quality traits and accumulation of phenolic healthy compounds in white wine grapes, belonging to Grechetto cv. 2) to evaluate the effect exerted by different ozone postharvest treatments
on the flavor profile of grapes.
3) to investigate the interrelationships between the parameters analysed and the different postharvest treatments, as well as the relationships among variables, by principal component analysis (PCA).
1.
LIT
ER
A
TU
RE
R
EV
IE
W
Vitis vinifera, L. (common grapevine) is a species of Vitis, whereas the term subsp. vinifera is restricted to cultivated forms (Table 1).
It is one of the earliest domesticated fruit crops and it has been widely cultivated and appreciated for its fruit and wine. In fact, cultivars of Vitis vinifera form the basis of the majority of wines produced around the world (Myles et al., 2011). The fruit is a berry, known as a grape. It is a non-climateric fruit growing on the perennial woody vines of the genus Vitis. Grapes are natives of Western Asia and Central Europe and are botanically known as Vitis vinifera. This species has more than 10,000 varieties, which have been generated from its wild progenitor, Vitis vinifera ssp. sylvestris, by vegetative propagation and by crossbreeding.
Grapes are the most important raw material for making wine. Approximately 70% of world grape production is used for this purpose, less than 30% as fresh fruit and about 1 – 2% as dried fruit. Italian wine production in 2014 amounted to 44.4 million hectoliters of wine, which was second only to that of France, while it was the leader country in exports (Figures 1 and 2; source: OIV, 2014).
Table 1. Vitis vinifera botanical classification. Kingdom: Plantae Division: Magnoliophyta Class: Magnoliopsida Order: Vitales Family: Vitaceae Genus: Vitis Species: V. vinifera (http://en.wikipedia.org/wiki/Vitis_vinifera).
Figure 1. Top fifteen wine-producing countries.
(
Figure 2. Top ten wine-exporting countries.
(http://italianwinecentral.com/wp-content/uploads/Wine-Exports-2013-chart.png)
1.1 Phytochemical composition of grape berry
From a structural point of view the berry is composed of three different types of tissue (Figure 3): pulp, skin, and seeds, with the sheer bulk of wine being derived from the pulp. These tissues vary considerably in composition, and therefore by extension, they contribute differently to the overall wine composition (Carbone et al., 2013a). Furthermore, the distribution of these tissues inside the berry is considered to be closely related to genotype (Carbone et al., 2011a; Cecchini et al., 2013).
Figure 3. Berry’s structure (http://www.youcellar.com/en/images/grain-en.gif).
Grape tissues contain many health-promoting components such as the so-called “phytochemicals”, a term that refers to every naturally occurring chemical substance in plant with biological activity (Zienlinski & Kozlowska, 2000; Iriti & Faoro, 2006).
The phytochemical composition of grapevine includes a great variety of known bioactive compounds (i.e. phenylpropanoids, isoprenoids, alkaloids) arise from different metabolic pathways (Figura 4). The main compounds arise from acetyl-CoA and shikimic acid, via the intermediates mevalonate and aromatic amino acids, respectively. Among them, phenylpropanoid compounds are the most popular ones (Figure 5). Phenolics are ubiquitous secondary metabolites in plants and known to contribute to pigmentation of different organs along with their role against different biotic and abiotic stresses. In fact, it is known the variation of the content of phenolic compounds in plants in response to fungal attacks (Carbone et al., 2011b).
Figure 4. Biosynthetic pathways of important phytochemicals from grapevines (Ali et al., 2010).
These compounds are present both in insoluble form, mainly in cell walls, and in soluble one, within the plant cell vacuoles (Figure 6).
Figure 6. Cross-section of berry showing epidermal and hypodermal cells (the skin) with polyphenolic (PP) deposits (Hardie et al., 1996).
They include a large group of biologically active components, from simple phenol molecules to polymeric structures with molecular mass above 30kDa (Dreosti, 2000; Figure 7), and represent the third most abundant constituent in grapes and wines after carbohydrates and organic acids.
Figure 7. Main classes of phenolic compound in grapes.
Phenolics are broadly distributed inside grapes and are mainly located in the seeds and the skins. On the contrary, the juice contains only small amounts (3 to 5% of total phenols). The total extractable phenolics in grape are present at only 10% or less in pulp, 60-70% (5 to 8% by weight) in the seeds and 28-35% in the skins. As a consequence of these variations, in the structure and relative content, the different properties of wine (i.e. sensorial, antimicrobial) can be affected by phenolics and related compound (Kennedy, 2008). White wines are usually produced from juice with little skin and seed contact. Their phenolic content is on average low, in the range of 100 to 500 mg/L gallic acid equivalent (GAE). Red wines, on the other hand, are customarily produced with skin and seed contact. Depending on the length of contact time, the phenolic content of a red wine generally varies between 800 to 3500 mg/L GAE.
Phenolics are involved in browning reactions in grapes and wine and also play a key role in the aging and maturation of wines.
1.2 Major classes of phenylpropanoids in grapes
In grapes, phenylpropanoid biosynthetic route leads to simple phenols or phenolic acids, flavonoids, stilbenes and proanthocyanidins (Figure 7). The phenolic content and composition of grapes depend mainly on the cultivar and tissue considered and are greatly influenced by the technological practice to which grapes are exposed (Flamini et al., 2013). During the maturation and handling of grapes several chemical changes may occur with the appearance of new compounds and/or disappearance of others, with the consequent modification of the ratios of total phenolic content as well as their qualitative and quantitative profiles.
The polyphenolic classes typical of white wine grapes and wines are discussed in details below.
1.2.1 Phenolic acids
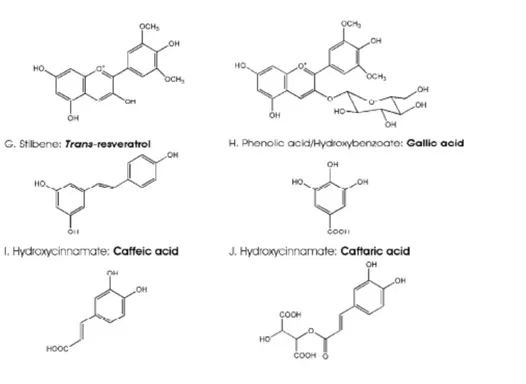
Phenolic acids (PAs) can be divided in two main groups: benzoic (carbon skeleton: C6-C1) and cinnamic (carbon skeleton: C6-C3) acids. They occur mainly as hydroxybenzoic (HBA) and hydroxycinnamic (HCA) acids, either in free or conjugated form (Figure 8). Those of grape origin are initially synthesized from phenylalanine (Hrazdina et al., 1984), whereas those of yeast origin are derived from acetic acid (Packter, 1980). HCAs are one of the most representative classes of phenolic acids found in grapes, especially that from white genotypes.
HCAs are present in the cell wall, covalently bound to species such as cellulose or proteins via ester linkages and are thus insoluble, contributing to the mechanical strength of cell walls. Conversely, the cytoplasm typically contains soluble HCAs. They play a regulatory role in plant growth and morphogenesis and in cell responses to biotic and abiotic stressors (i.e. pathogens).
HCAs are synthesized using the amino acid phenylalanine (PHE) as a starting material, via the shikimate pathway (Figure 5). In fact, the deamidation of PHE (or tyrosine), catalysed by the enzyme phenyl-alanine ammonia-lyase (PAL), yields the carbon skeleton (C6-C3) that serves as the core structure of phenyl propanoids.
Common hydroxycinnamic acids are p-coumaric acid, caffeic acid, sinapic acid, and ferulic acid (Figure 8). Cinnamic acids display cis or trans configuration, the latter being the most abundant in nature. These isomers are convertible either enzymatically or through the action of the light. HCAs usually appear as tartaric esters or diesters (hydroxycinnamoyltartaric esters; Buiarelli et al., 2010). The caftaric acid (caffeic acid conjugated with tartaric acid) is predominant (up to 50%) of the total HCAs.
Other important tartaric esters are p-coutaric acid (coumaroyltartaric acid), and fertaric acid (feruloyltartaric acid). The presence of a double bond in the lateral side is responsible for the observed geometric isomerism (predominantly trans; Garrido & Borges, 2013). These compounds are mainly localized in the pulp, whereas the trans and cis isomers of p-coutaric acid are mostly localized in the grape skin.
Among HCA derivatives, ethyl esters of caffeic and coumaric acids, along with ethyl esters and diethyl esters of caftaric acid, are reported. Furthermore, evidence of glucosides like 4-O glucosides of ferulic and coumaric acids (both
cis and trans forms), glucosides of caffeic, coumaric, ferulic, and sinapic acids have been shown by some studies (Baderschneider & Winterhalter, 2001).
Figure 8. Chemical structure of phenolic acids found in grapes.
When compared with HCA, wines have lower levels of hydroxybenzoic acids (HBAs) and their derivatives.
The most common HBAs are gallic acid, gentisic acid, protocatechuic acid, and p –hydroxybenzoic acid, which are mainly found in their free form (Pozo-Bayon et al., 2003; Vanhoenacker et al., 2001). Hydroxybenzoic acids are mostly represented by gallic acid, which is found free as well as acyl substituent of flavan-3-ols. Two forms of gallic acid, i.e. 3-O-β-glucopyranoside and 4-O-β-glucopyranoside, have been reported in grape (Lu & Foo, 1999 ). In wine, the level of gallic acid has been shown by many studies ranging from 0.3 to 4.8 mg/L (Pozo-Bayon et al. 2003; Pena-Neira et al., 2000 ; Sladkovsky et al., 2004).
Other benzoic acids such as protocatechuic, vanillic, and syringic acids are reported in Riesling wine from Germany (Baderschneider & Winterhalter, 2001). Several derivatives of HBA were also identified including the ethyl esters of vanillic and p-hydroxybenzoic acid, methyl esters of vanillic and protocatechuic acid, ethyl esters of protocatechuic acid, the glucose ester of
vanillic acid, from German Riesling wine (Baderschneider and Winterhalter 2001).
1.2.2. Flavonoids
The term flavonoid refers to a broad class of compounds (i.e. flavonols, flavanols, anthocyanins), displaying a C6-C3-C6 basic structure (Figure 7). They are synthesized from the combination of the shikimic and polyketide pathways. In nature, flavonoids can occur either in the free or conjugated form being often esterified to one or two sugar molecules through at least one hydroxyl group (O-glycosides, O-Glyc; Garrido & Borges, 2013).
Another type of glycosides (C-glycosides) can take place, in which the connection to the sugar molecule occurs directly in the flavonoid skeleton through a C-C bond. These derivatives are more resistant to hydrolysis than their O-analogs. The sugar associated to a particular glycoside may differ from glucose to galactose, rhamnose, xylose or arabinose. In C-glycosides, glucose is the more frequently found.
Among flavonoids, white wine grapes are rich in flavonols and flavan-3-ols (also named flavans).
Flavonols are characterized by the presence of a double bond between atoms C2 and C3, and a hydroxyl group in C3, thus being often named 3-hydroxyflavones. Moreover, about 90% of the flavonols are hydroxylated in C3, C5 and C7, thus being designated as 3,5,7-trihydroxylated derivatives (Garrido & Borges, 2013). In grapes, glycosides from the following aglycons have been identified: quercetin (3′,4′-diOH), kaempferol (4′-OH), isorhamnetin (3′-MeO analog of quercetin), myricetin (3′,4′,5′-triOH), laricitrin (3′-MeO analog of myricetin) and syringetin (3′,5′-MeO analog of myricetin). However, in white
wine, only quercetin, kaempferol and isorhamnetin have been detected. The flavonoids myricetin, laricitrin, and syringetin were missing in all white varieties, a fact that reveals that the enzyme flavonoid 3′, 5′-hydroxylase is not expressed in white grape varieties.
Flavan-3-ols are benzopyrans that have a saturated carbon chain between C2 and C3, a hydroxyl function in C3, and no carbonyl group in C4. The most abundant flavan-3-ols in nature are catechin and its enantiomer epicatechin. These compounds are present in the skin and seeds of grapes as well as in wine. In white wines produced under special conditions, avoiding a prolonged contact with the skin of the grapes, catechin was determined to be the most abundant flavonoid, being largely responsible for the characteristic taste of the wine. Some catechin derivatives, namely gallocatechin, epigallocatechin, epicatechin gallate and epigallocatechin gallate, have been identified in grapes and wine.
Catechin and epicatechin are also the monomeric units of proanthocyanidins (also named condensed tannins), which are recognized as being responsible for the majority of the potential health benefits attributed to grapes (Cecchini et al., 2013).
1.3 Biological significance of grape’s phenolics for human health
Polyphenols are important for both plants and humans for several reasons. Firstly, they protect plants from biotic and abiotic stress factors. Indeed, some of these phenolic compounds are only induced when stress factors are present, among them, the so-called phytoalexins, which are specifically involved in defense mechanisms and are synthesized after pathogen or predator attack or
injury (Cantos et al., 2003). Secondly, most of these metabolites are responsible for the organoleptic and qualitative properties of foods originating from such plants. However, in grapes, polyphenols play a vital role not only in determining the wine's color and flavor, but may also act as antioxidants, with mechanisms involving both free-radical scavenging, metal chelation, singlet oxygen quenching and their effects on cell signalling pathway and gene expression (Sun et al., 2011).
The beneficial implications for human health of grapes and relevant grape-derived food products and by-products (i.e. grape pomace, seeds,..) are believed to be related to the presence of these compounds, due to their proven biological activity in the prevention of degenerative disease (i.e. cardiovascular disease; Haminiuk et al., 2012).
Moreover, an increasing number of studies suggest that the high consumption of grape components could be associated with the reduced risk of certain cancers such as breast cancer and colon cancer. In this regard, grape antioxidants have been shown to induce cell cycle arrest and apoptosis in cancer cells as well as prevent carcinogenesis and cancer progression in in vivo models (Garvin et al., 2006). In light of the broad spectrum of different chemical structures of the grape antioxidants, it is very likely that these compounds exert potential anticancer activity by acting on multiple cellular events associated with tumor initiation, promotion, and progression. Proposed mechanisms of potential anticancer effects of grape antioxidants include antioxidant, anti-inflammatory, and anti-proliferative activities (Hogan et al., 2010; Cecchini et al., 2013). At this regards, a clinical report has shown that procyanidin oligomers from grape seeds are 20 and 50 times more potent antioxidant than vitamin C and E, respectively (Cecchini et al., 2013). Moreover, Kanner et al. (1994) found that red wine phenolics inhibit
myoglobin, cytochrome C and iron ascorbate catalyzed lipid peroxidation. In that study, it was shown that gallic acid, resveratrol, and tannic acid exerted same inhibition on lipid peroxidation, which was greater than D–L-α-tocopherol.
In their recent review, Semaming et al. (2015) reported that in vivo experiments using rats and mice showed that protocatechuic acid (PCA, 3,4-dihydroxy benzoic acid), a major metabolite of anthocyanin, exerts anti-inflammatory as well as antihyperglycemic and antiapoptotic activities. Furthermore, PCA has been shown to inhibit chemical carcinogenesis and to exert proapoptotic and antiproliferative effects in different cancerous tissues.
1.4 Postharvest technologies and phytochemical content of fruit
Due to their role in food quality and human health, different methods to improve the polyphenol content of plants have been developed.
After they are harvested, the value of fruits is added in successive stages up to the point when someone eats them. The aim of postharvest management is therefore to maximize this added value. To reach this goal, postharvest strategies aimed at reducing metabolic activity and maintaining the physico-chemical properties of fruit at harvest. To date, the three main objectives of applying postharvest technology to harvested fruits are:
1. to maintain quality (appearance, texture, flavour and nutritive value); 2. to protect food safety;
3. to reduce losses (both physical and in market value) between harvest and consumption;
However, with rising consumer interest in foods that promote health, attention has shifted from quality maintenance to quality assurance, with particular emphasis on the enhancement of health-promoting phytochemicals. Therefore,
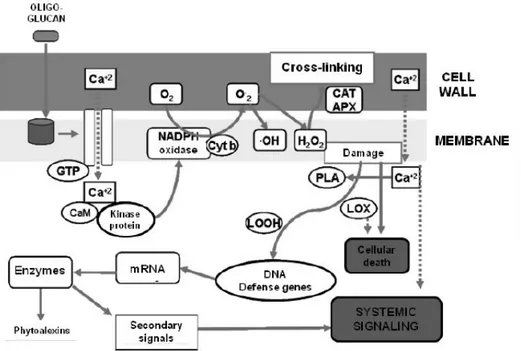
to obtain fruit enriched with phytochemicals, postharvest elicitor treatments might be used either singularly or in combination to elicit the desired effect, by inducing the plant defense mechanisms. In fact, whenever a plant is subjected to biotic or abiotic stressors, it activates different signaling pathways to synthesize a specific set of defensive compounds. This process, mediated by the accumulation of endogenous salicylic acid (SA), a metabolite downstream the biosynthetic pathway initiated by phenylalanine ammonialyase (PAL), is based on the induction of secondary metabolic pathways and the increased synthesis of products, phenolic compounds among them, by this metabolism as a response to external attacks (i.e. pathogen attack or abiotic stressors) (Ruiz-García & Gómez-Plaza, 2013). It is assumed that SA acts by inducing: i) pathogenesis-related proteins such as glucanases, peroxidases and chitinases that may contribute to the resistance via hydrolysis of the pathogen cell wall; ii) an oxidative burst, which triggers the elicitation of phytoalexins with antifungal properties; and iii) the phenylpropanoid pathway by activation of PAL, which leads to the formation of phytoalexins, lignins, and SA. In the absence of any attack, these defense mechanisms may be induced by physical or chemical elicitation (Figure 9).
Figure 9. Mechanism of oxidative damage in response to oligoglucan elicitors (Ceron-Garcia et al., 2012).
Defence reactions can then include a rapid and intense production of highly reactive and toxic oxygen species (ROS) generated through the sequential one-electron reduction of molecular oxygen (O2). The mechanism is called
oxidative burst. Under physiological conditions, the first reduction of O2 forms
the superoxide anion (O2•–) and hydroperoxyl radical (HO2•), the second step
forms hydrogen peroxide (H2O2), and the third step produces the hydroxyl
radical (OH•) via the Fenton reaction in the presence of transition metals such
as iron or copper. OH• and O2•– possess very short half-lives (from nanosecond
to microsecond, respectively). Uncharged H2O2 is more stable and can diffuse
across membranes, whereas OH• cannot migrate in solution and instead reacts
locally, notably with molecular targets by modifying their structure or activity. H2O2 as well as OH• can react with polyunsaturated lipids in membranes,
Because cells are unable to detoxify OH•, an excess of this molecule results in
irreversible damage and cell death (Garcia-Brugger et al., 2006). The term oxidative stress has been coined to describe situations in which the generation of ROS exceeds the capacity of the organism to maintain cellular redox homeostasis (Wojtaszek, 1997). It has been demonstrated that ROS are implicated in postharvest storage disorders (Hodges, 2003). ROS can accumulate when horticultural material is exposed to stresses like those induced by elicitors, producing a disruption of the redox homeostasis.
Specific postharvest elicitor treatments are low or high temperature treatments, ultraviolet and gamma irradiation, altered gas composition or application of signaling molecules (i.e. salicylic acid, methyl jasmonate, and ethylene). Among gaseous molecules, the air pollutant ozone has been found to resemble fungal elicitors, inducing plant signal molecules such as ethylene and salicylic acid, as well as certain genes and biosynthetic pathways associated with pathogen and oxidative defence (Sandermann et al., 1998).
1.5 Ozone: general aspects
Ozone is a strong, naturally occurring oxidizing agent with a long history of safe use in disinfection of municipal water, process water, bottled drinking water, and swimming pools. Its antimicrobial power, due to its potential oxidizing capacity, is able to reduce the postharvest decay of fresh commodities by directly inhibiting the pathogen or by inducing decay resistance. The use of ozone as an effective sanitizer and disinfectant worldwide beginning in France in 1902 and has been documented in an Expert Panel Report entitled “Evaluation of the history and safety of ozone in processing food for human consumption” (Graham, 1997). This declaration of generally recognized as safe (GRAS) status for use of ozone in food processing
was presented to Food & Drug Administration (FDA) on April 10th, 1997 and
published thereafter in the scientific literature and the trade press (USDA, 1997). Over the years, attempts have been made to use the reactive properties of ozone to preserve the quality of fresh fruits and vegetables. However, ozone may induce many physiological changes in horticultural products, both positive and negative.
1.6 The chemistry of ozone
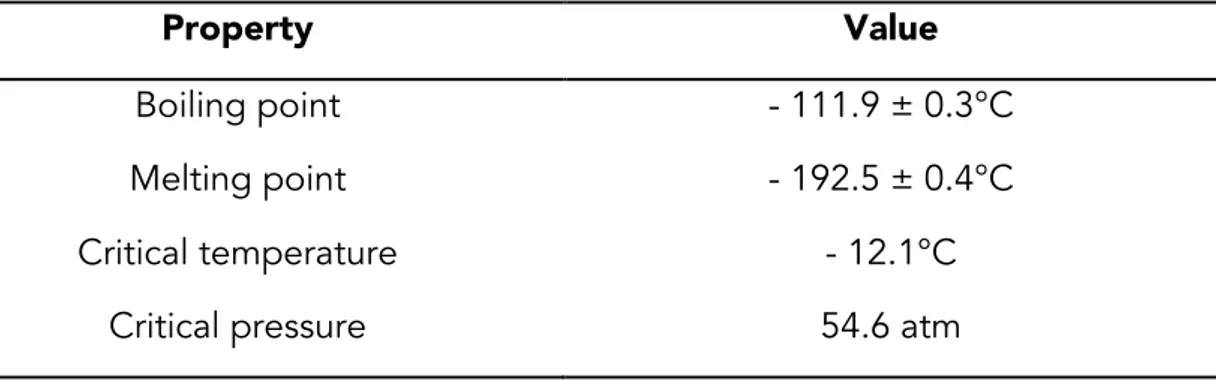
From a chemical point of view, ozone (O3; Figure 10), a triatomic form of
oxygen, is an allotrope of this element. Its major physical properties are given in Table 2.
Ozone results from the rearrangement of atoms when oxygen molecules (O2)
are subjected to high-voltage electric discharge. It is formed in the stratosphere, in photochemical smog and by UV sterilization lamps, high voltage electric arcs, and gamma radiation plants (Mustafa, 1990).
Table 2. Major physical properties of pure ozone (Guzel-Seydim et al., 2004).
Property Value
Boiling point - 111.9 ± 0.3°C
Melting point - 192.5 ± 0.4°C
Critical temperature - 12.1°C
Critical pressure 54.6 atm
Ozone is a bluish gas at room temperature, of peculiar odour, with an energetic oxidizing action by virtue of its high redox potential (+2.07 V; Table 3, Guzel-Seydim et al., 2004), which conveys bactericidal and viricidal properties (Kim et al., 1999; Kim & Yousef, 2000).
Figure 10. Resonance structures of the ozone molecules. Table 3. Oxidizing agents and their oxidation potential.
Oxidizing agent Oxidation potential (mV)
Fluorine 3.06 Ozone 2.07 Permanganate 1.67 Chlorine dioxide 1.50 Hypochlorus acid 1.49 Chlorine gas 1.36
Ozone exerts its bactericidal action by attacking the glycoproteins and/or glycolipids that make up cell membranes of the microorganism, destroying them (Figure 11).
Figure 11. Bactericidal effect of ozone (Khadre et al., 2001).
In fact, in the presence of unsaturated organic compounds (i.e. membrane lipids), ozone can give rise to cycloaddition reactions (Criegee mechanism) leading to the formation of particular compounds called ozonides (Figure 12). The mechanism of ozonolysis (Figure 13) was described by Criegee in 1975 (Criegee, 1975). First step is a 1,3 dipolar cycloaddition of ozone to the olefin leading to the malozonide (1) (Criegee intermediate), which is very unstable and decomposes to give a zwitterion (2) and a carbonyl compound (3). In the presence of a reactive solvent, such as water or alcohol, the zwitterion interacts with the solvent to give hydroperoxides (4) in high yield, since the concentration of the solvent far exceeds that of any other substances with which the zwitterion may react. Ozonides (5), dimeric (6) or polymeric peroxides may be by-products. When the solvent is inert, the zwitterion must react either with itself or with carbonyl compound. Reaction with carbonyl compound (3) to form a monomeric ozonide (5) as the major product and
polymeric ozonides as minor products usually predominates if (3) is an aldehyde (Almeida et al., 2013). The zwitterion (2) generally dimerizes to form (6) or polymerizes when (3) is a ketone, less susceptible to nucleophilic attack (Bailey, 1978).
Figure 12. Reaction between unsaturated fatty acid (7) and ozone (Almeida et al., 2013).
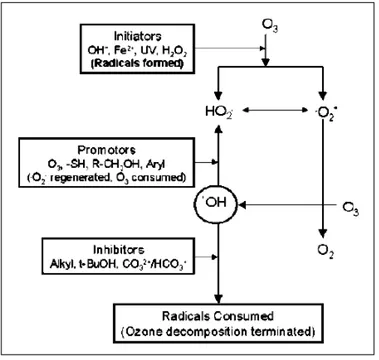
From a general point of view, the ozone molecule acts as dipole with electrophilic and nucleophilic properties (Khadre et al., 2001). It is relatively unstable in aqueous solutions, decomposing continuously, but slowly, to oxygen according to a pseudo first-order reaction. According to Staehelin & Hoign (1985), ozone decomposes following a multistep mechanism, including initiation, promotion, and inhibition reactions (Figure 14).
Figure 14. Mechanism of ozone decomposition in aqueous solutions (Khadre et al., 2001).
Organic and inorganic compounds in aqueous solutions react with ozone in one of the two following pathways:
(b) Decomposition of ozone in water into a radical (for example, OH•), which
reacts with the compound (M):
Molecular ozone reactions are selective and limited to unsaturated aromatic and aliphatic compounds.
In addition to the ozonolysis, oxidation of sulfhydryl groups, which are abundant in microbial enzymes, may explain rapid inactivation of microorganisms and bacterial spores by ozone. Besides, ozone reacts with polysaccharides slowly, leading to breakage of glycosidic bonds and formation of aliphatic acids and aldehydes (Bablon et al., 1991a). Reaction of ozone with primary and secondary aliphatic alcohols may lead to formation of hydroxy-hydroperoxides, precursors to hydroxyl radicals, which in turn react strongly with the hydrocarbons (Anbar & Neta, 1967).
The action of ozone on amino acids and peptides is significant especially at neutral and basic pH. Ozone attacks the nitrogen atom or the R group or both. Ozone reacts slowly with saturated fatty acids, while quickly with nucleobases, especially thymine, guanine, and uracil. Reaction of ozone with the nucleotides releases the carbohydrate and phosphate ions.
2.
E
XP
ER
IM
EN
TA
L S
EC
TIO
N
2.1 Plant material & experimental design
Samples of Grechetto grapes (Vitis vinifera, L; vintage 2012) were collected from a 14-year-old experimental vineyard of the CRA- Research Unit for Enology, located in Velletri (Rome) in the Lazio region (Italy) (41°40’30” N latitude, 12°50’42” E longitude) at 355 m a.s.l. Grapes were harvested at technological maturity (sample name: GH) between 20 and 21°Brix and with a value of titratable acidity around 1 g tartaric acid/L. Then, bunches were carefully selected, placed in perforated plastic boxes, in a cold room (T = 10 ± 1°C) at 90% relative humidity and removed soon after the end of the treatments (12 hours). The following atmosphere treatments were applied (exposure time: 12 hours; three replicates for each treatment; Figure 15): (i) air continuous flow (GC); (ii) a continuous flow of 1.5 g/h of ozone in air (GO) ; (iii) a continuous flow of 1.5 g/h of ozone in 100% nitrogen flow (GNO). The specific ozone flow value was chosen in accord with previous treatment on wine grapes. A generator of ozone (PC Eng., Uggiate Trevano, Como, Italy) was employed to produce gaseous ozone, while nitrogen was generated by a 100% nitrogen tank (Rivoira, Terni, Italy). After the treatment samples were kept in normal atmosphere for one day at room temperature. The treatments were carried out in three stainless steel containers (volume = 1 m3), tightly
closed for the treatment time, and placed in three different cold rooms. Initially and at the end of the experiment, selected berries (300 from each box of each treatment, sampled by different bunches) of a similar size and from the central part of the bunch, were detached, and stored at −20 °C for the phytochemical extraction, while fresh berries were used for the proximate analysis.
2.2 Analysis of grape’s quality attributes
Berries were weighted, washed, deprived of seeds, homogenized, and the homogenate samples were analysed for total soluble solid (TSS) content using a digital refractometer (Refracto 30 PX, Mettler Toledo, Milan, Italy); data are given as °Brix. The method for analysis of titratable acidity (TA) was based on titration of the acids present in the berries juice with sodium hydroxide (0.1 N). Data are given as g tartaric acid/L, since this is the dominant organic acid in grapes. The pH value was measured using a digital pH-meter (785 DMP, Methrom, Milan, Italy). The dry matter (DM) of the berries was measured drying them in an oven at 105°C until reaching a constant weight.
Total browning was evaluated by measuring the absorbance at 420 nm (A420) and normalized to the total polyphenol content (TPC) according to Boselli et al. (2010). Every analysis was replicated three times.
2.3 Extraction of grape’s bioactive compounds
Grapes were extracted to determine phytochemical content (e.g. total flavans: FLC, total polyphenols: TPC) and antiradical capacity (AC). Berries (15 g) were deprived of seeds, placed in 50-mL tubes and homogenized at high speed with 15 mL of a hydro alcoholic solution (methanol: water = 80:20, v/v) acidified with 0.1% HCl (v/v) using an Ultra-Turrax mixer (Ultra-Turrax, Model T25; Jancke & Kunkel, IKA-Works, Germany). Each homogenization (three replicates) lasted 15 s with intervals of 30 s. The homogenization was carried out in an ice bath. Then, the mixture underwent to an ultrasound-assisted extraction for 30 min. The resulting extracts were then centrifuged at 6792 g, for 15 min at 4°C. Pellets were extracted once again in the same manner. Then, the supernatants were collected together and immediately analysed.
2.4 Analysis of bioactive compounds
Total soluble polyphenol content (TPC) of extracts were determined according to Carbone et al. (2011c). Briefly, grape extract (50 mL) was mixed with 250 mL of Folin-Ciocalteu reagent (previously diluted to 1:1 ratio with double distilled water) and incubated for 3 min at room temperature (RT), then 750 mL of Na2CO3 solution (10% w/v) was added. After incubation at RT for 90 min, the
absorbance of the solution was read at 765 nm using an UV-Vis spectrophotometer (Evolution 300, THERMO Scientific, Italy). Gallic acid was used as a standard. The concentration of total phenolic compounds was
expressed as mg of gallic acid equivalents (GAE)/g (DM) using the regression equation obtained from the standard gallic acid calibration curve (Figure 16). Total flavan-3-ol content (FLC) was determined according to Carbone et al. (2011c). Briefly, to 0.5 mL of grape extract 3 mL vanillin (4% in methanol, w/v) was added followed by 1.5 mL of conc. HCl and incubated for 15 min at 20°C. The absorbance was measured at 500 nm. FLC was expressed as mg catechin equivalents (CAE)/g (DM) using the regression equation obtained from the standard catechin calibration curve (Figure 17).
Figure 16. Calibration curve of gallic acid.
y = 0.0013x + 0.0179 R² = 0.99493 0 0.1 0.2 0.3 0.4 0.5 0.6 0.7 0.8 0 100 200 300 400 500 600 A BS 765 n m Gallic acid (ppm)
Figure 17. Calibration curve of catechin.
2.5 In vitro antioxidant properties of grape’s extracts 2.5.1. Free radical scavenging capacity (DPPH• method)
The radical scavenging power of the analysed samples was assessed by measuring their ability to scavenge synthetic radicals (e.g. DPPH• and ABTS•+;
Figures 18 and 19, respectively).
The DPPH• quenching capacity was estimated spectrophotometrically according to Carbone et al. (2011c).
y = 0.004x + 0.0035 R² = 0.9972 0 0.2 0.4 0.6 0.8 1 1.2 0 50 100 150 200 250 300 A BS 500 n m Catechin (ppm)
Figure 18. Absorption spectra of DPPH• and oxidation of DPPH radicals (http://www.intechopen.com/source/html/43985/media/image4.jpeg).
Figure 19. ABTS chemical reaction (Boligon et al., 2014).
Briefly, an aliquot of the DPPH• solution (0.5 mL; 0.48mM) was diluted in 1.0 mL of methanol, and 1.0 mL of grape extracts at various concentrations was added. The mixture was shaken vigorously and allowed to stand for 30 min in the dark. The decrease in absorbance was measured at 515 nm against a blank (using methanol to replace the extract) in an UV-Vis spectrophotometer (Evolution 300, THERMO Scientific, Italy), at RT. All the measurements were
made in triplicate. Percentage scavenging of the DPPH free radical was measured using the equation:
Percentage scavenging = ABS0−ABS1/ABS1 × 100
where ABS0 = absorbance of control and ABS1 = absorbance in the presence of
the sample. EC50 was calculated according to Sanchez-Moreno et al. (1998),
from a dose-inhibition curve obtained with different amounts of grape extracts (Figure 20).
Figure 20. Example of % residual DPPH• calculated at the steady state as a function of the antioxidant quantity (mg dry grape extract).
y = 9.5641x-1.253 R² = 0.98988 0 10 20 30 40 50 60 70 80 90 100 0 0.5 1 1.5 2 2.5 3 3.5 % r emai n in g D P P H • at th e s te ad y state Grape extract (mg DM)
2.5.2 Free radical scavenging capacity (ABTS•+ method)
ABTS•+ stock solution (daily prepared) was produced by reacting a 7.0 mM
aqueous solution of ABTS with aqueous 2.45 mM potassium persulfate (final concentration). The mixture was allowed to stand in the dark at room temperature for 12 h before use. Then, the working solution was prepared by dissolving the ABTS radicalized solution above in ethanol (1:90, v/v) to reach an absorbance of 0.700 ± 0.002 at 734 nm at room temperature. Extracts (20 mL) were added to 980 mL of ABTS radical solution. The mixture was incubated in darkness in a 37 °C water bath for 10 min, and the absorption at 734 nm was measured by an UV-Vis spectrophotometer (Evolution 300, THERMO Scientific, Italy) in reference to a blank. EC50 values were calculated based on
dose-response curves (Figure 21).
Figure 21. Example of % residual ABTS+• calculated at the steady state as a function of the antioxidant quantity (mg dry grape extract).
y = -416.94x + 95.263 R² = 0.99533 0 10 20 30 40 50 60 70 80 90 100 0.00 0.05 0.10 0.15 0.20 0.25 % r emai n in g A BTS + at th e s te ad y state Grape extract (mg DM)
2.6 Chromatographic analysis of phenolic compounds using photodiode array detection (DAD)
Polyphenols were separated and identified by an analytical high performance liquid chromatography (HPLC) system (Agilent 1100 series, Agilent, Italy) equipped with a photodiode array detector (DAD; Agilent Technologies, Italy). DAD was simultaneously set at 280 nm (benzoic acids and flavan-3-ols), 320 nm (hydroxycinnamic acids) and 370 nm (flavonols). Besides, UV-Vis spectra were recorded over the range 200-700 nm. The separation protocol was slightly adapted from a previous one (Zhang et al., 2012). Briefly, the separation was done on a Zorbax SB C18 column (Agilent, 4.6 x 250 mm; 5 mm particle size, set at 30°C), and used in combination with the following binary gradient: 10-12% B for 16 min, 12-38% for 9 min, 38-70% B for 7 min, 70-85% B for 8 min and 85-10% B for 10 min. The time of post-run for reconditioning was 5 min. The following mobile phase was used (flow rate: 0.7 mL/min): solvent A: water with 0.1% (v/v) formic acid (FA); solvent B: 30% acetonitrile, 10% methanol, 59.90% water and 0.1% FA. The injection volume was 20 mL and samples were membrane-filtered (Millipore PTFE 0.45 mm, Milan, Italy) before HPLC analysis. The different phenolic compounds were identified by their retention time, spectral data as compared to individual standards and according to literature data and by the method of standard addition to the samples. Analytical data were evaluated using a software-management system of chromatographic data (Chemstation 32.1, Agilent Technologies). 10-point calibration curves based on external standard solutions (0 – 100 ppm) were obtained for quantification.
2.7Analysis of lipid peroxidation
Lipid peroxidation was determined by measuring the content of malondialdehyde (MDA; Figure 22) as described by Du & Bramlage (1992) with
some modifications. Three milliliters of 0.67% thiobarbituric acid (TBA) in 10% trichloroacetic acid (TCA) was added to one milliliter of the crude extract sample solution in a test tube. The solution was heated at 95°C for 20 min, immediately cooled and then centrifuged at 6792 g for 10 min, and the absorbance of supernatant read at 532 nm. The value of non-specific absorption at 600 nm was subtracted. The results were recorded as thiobarbituric acid reactive substances (TBARS), which represent MDA equivalents. The amount of MDA was calculated from the extinction coefficient 155 mM/cm and expressed as nanomoles/g DM.
Figure 22. Mechanism of MDA formation during lipid peroxidation (Grintzalis et al., 2013).
2.8 Metabolite profiling of grape extracts by GC-MS
Grape extract investigations were then complemented with untargeted GC-MS analyses of the same polar extracts previously analyzed by targeted HPLC. GC-MS analysis was performed using an Agilent 7890 A system equipped with a Programmable Temperature Vaporization injector (PTV), and with a quadrupole mass spectrometer (5975 C, Agilent, USA) with Electron Ionization (EI) mode operated at 70eV. The advantages of PTV injection (i.e. for aqueous samples) over other techniques consist in decreased analyte discrimination during injection step, better recoveries of thermo degradable compounds, and less pronounced adverse effects of non-volatiles present in the sample on the injection process. Chromatographic separation was performed on HP-5MS capillary column (30 m x 0.25 mm I.D., 0.25 μm film thickness, Agilent, USA). Helium was used as the carrier gas with a constant flow of 1 mL/min. The oven temperature program was: 5 min at 40°C, from 40°C to 200°C at 2°C/min, hold for 15 min, from 200°C to 280°C at 1°C/min, hold for 1 min. The GC column was equilibrated for 3 min prior to each analysis. Total GC running time was 181 minutes. Ten microliters of each grape extract were injected with PTV injector, following the injection program shown in Table 4.
Table 4. PTV injector program.
Mode Solvent vent
Inlet temperature 70°C
Initial time 0.2 min
Rate 1 720°C
Final temperature 280°C
Final time 4 min
Vent flow 50 mL/min
Vent pressure 7 psi
Vent time 0.19 min
The transfer line temperature was held at 280 °C. Ion source temperature was set at 230°C, while the temperature of quadrupole was set at 150°C. The mass spectrometer (MS) data were collected in full scan mode (mass range: 30 – 600 mu, 2.57 scan/sec). All samples were analyzed in triplicate. The coefficient of variation of the analysis was < 5%. Recorded data profiles from GC-MS analysis were exported to the Agilent Mass Hunter (MH) Qualitative Analysis B.06.00 software package, where all data pretreatment procedures including deconvolution, noise reduction, baseline correction and peak alignment were carried out and artifacts such as column bleeding and solvent peaks were removed.
For metabolite identification, peaks were matched against customized reference spectrum database (NIST11; only compounds with a quality match ≥ 80% in at least three independent samples were chosen) and when possible by comparing the mass spectra and retention indices with those of authentic reference compounds. Semi-quantitative data (and expressed in terms of log10 transformed peak area response, normalized to sample weight) were
calculated from total ion chromatogram (TIC), assuming no differences in response factor for all compounds quantified.
2.9Statistical analysis
Statistical analysis was performed with SPSS 20.0 software (SPSS, Inc., Chicago, Illinois). Data were reported as means ± standard error of the mean (SE, where not specified differently) of three independent experiments with three replicates. An exploratory data analysis was made to check the data normal distribution (Shapiro-Wilkinson test) and the equality of variances (Levene’s test). To reduce the impact of any detected outliers in the data, we replaced them with the mean plus two standard deviations (Field, 2009). Data violated ANOVA assumptions, even after their mathematical transformation. In light of the obtained results, we analysed not-normal distributed data through the Kruskal-Wallis non parametric test, while significant mean differences were established using the Mann-Whitney test for independent and non parametric procedures (p < 0.008 for Bonferroni’s correction, where not specified differently; Field, 2009). Spearman’s correlation coefficient (rS) was used to
determine the correlation among variables in the non-parametric analysis (p < 0.01). Principal component analysis (PCA) was used to establish the relationships among all the variables under study and to discriminate between different postharvest treatments. It was performed using the data correlation matrix and Varimax rotation between the samples.
3.
R
ES
U
LT
S &
D
ISC
U
SS
IO
N
3.1 Fruit quality attributes
In the present study, no alterations in the wine grape quality features due to ozone treatments occurred (Table 4), in agreement with the findings reported by other authors (Skog and Chu 2001; Salvador et al. 2006; Tzortzakis et al. 2007).
Table 5. Effect of different postharvest treatments on the quality of the grapes (mean ± SE).
Sample Dry Matter TSS TA pH MDA
(%) (°Brix) (gL-1) (nmolg-1)
GH 21.8±0.2b 20.7±0.2b 1.04±0.06a 3.39±0.03b 93±3a GC 19.3±0.6a 18.4±0.6a 1.26±0.01b 3.12±0.01a 106±4b GO 21.5±0.3b 20.8±0.3b 1.03±0.04a 3.32±0.03b 97±4a GNO 21.4±0.2b 19.9±0.2b 1.07±0.03a 3.25±0.04b 97±2a TSS: total soluble solids. TA: titratable acidity is expressed in g/L of tartaric acid. MDA: malondialdehyde content = nanomoles MDA/g (on dry weight basis). Different letters in column indicate the significant differences in the mean at the p < 0.008 level (Bonferroni’s correction).
Particularly, no significant differences were found in dry matter, TSS, TA, and pH of grapes treated with ozone, regardless of the atmosphere, air or nitrogen, compared to the fresh samples. In contrast, GC samples showed a significant lower content of dry matter and TSS, a lower value of pH and higher value of TA than those exposed to ozone-enriched atmospheres (GO and GNO; Table 5). GC samples also showed an unexpected higher weight loss (20% vs 10%) than the one of the other ozonated samples. The behaviour of berries (decrease of sugars, increase in acidity and peroxidation index) kept in cold storage without ozone treatment is surprising because grape is considered
tolerant to low temperature but the rapid thermal excursion from the harvest temperature (30°C in our case) down to 10°C has likely induced a cold stress. This phenomenon has been observed in grapes by Cirilli et al. (2012) during postharvest dehydration, with a significant overexpression of genes dedicated to the synthesis of polyphenols and it is something occurring even in the vineyard due to the sensibility of polyphenolic fraction to temperature (Spayd et al. 2002; Cohen et al. 2012). Confirming a potential transient thermal stress, beyond the rapid decrease of sugars content likely due to an immediate need of energetic substrate (increase of respiration) for the thermal stress and water loss, GC samples showed a membrane peroxidation index, determined by means of the malondialdehyde content, significantly higher than the other samples analysed (Table 5). Thus, the thermal stress could be associated to an oxidative stress as reported by Wismer (2003). In this regard, it has been shown that an oxidative stress can be induced in harvested grapes as well as in other fruit during cold storage (Imahori et al., 2008; Rosales et al., 2013). Yuan et al. (2014) pointed out that several antioxidant enzymes, including ascorbate peroxidase (spots 5, 25 and 51), glutathione S-transferase (spot 35) and superoxide dismutase (spot 57) were up regulated after exposure to low temperature. Furthermore, it has been shown that the lipid composition of the membrane of the plant tissue, and consequently its physical properties, are influenced by low temperature and by the oxidation state of the membrane (Dong et al., 2012). Conversely to that observed for GC samples, ozone-treated berries, even though kept at the same temperature of GC samples, did not show significant changes in the chemical traits (Table 5). For these samples, it is assumed that exposure to ozone could inhibit grape’s respiration as reported for peach by Yang and Rao (2006) and cucumber by Li et al. (2014).
This effect was more pronounced for GNO samples, where the replacement of oxygen by nitrogen in the atmosphere surrounding the berry could have reduced significantly the respiration or even induced an anaerobic respiration. Moreover, membrane lipid peroxidation was not affected by ozone, either when the fumigation was done in air or nitrogen (Table 5). These findings are very surprising because ozone is known for its strong oxidant action. In fact, it is a very unstable molecule that decomposes either spontaneously, producing hydroxyl radicals and other free radical species, or in contact with oxidizable surfaces, such as cell wall and plasma membranes, finding there suitable reactive sites (Forney, 2003).
Chilling stress in plant cell is due mainly to a change of the ratio between unsaturated to saturated fatty acids making the membrane more susceptible to ion leakage. It is known that the effect of ozone on fatty acids is to produce ozonides, long chain molecules, very unstable, which modify the fluidity of the lipid. Probably, the modification of the lipid layers of the membrane due to the ozone treatments could have induced cell resistance to cold stress as shown by less weight loss since it is known that chilling injury favours water loss (Cohen et al., 1994). Further on, the observed oxidation of phenolics in ozone-treated samples (see below) could have prevented the peroxidation of membrane lipids (Robards et al., 1999). However, in order to clarify the ozone oxidant effect, further studies would be needed employing different ozone concentrations and times of treatment.
3.2 Polyphenols, flavan-3-ols and antiradical capacity
Cold storage (GC samples) produced a statistically significant (p < 0.008) increment of TPC if compared to those of grapes at harvest and ozonated samples (Table 6).
Table 6. Influence of different postharvest treatments on the phytochemical content and antiradical capacity of Grechetto grapes (mean ± SE).
Sample TPC FLC EC50a EC50b
GH 17.5±0.3b 1.43±0.04b 0.49±0.01c 0.58±0.03c GC 23.1±0.9c 1.7±0.1b 0.32±0.02a 0.37±0.02a GO 17.1±0.6b 1.3±0.1bc 0.39±0.03b 0.43±0.02b GNO 13.0±0.7a 1.09±0.06ac 0.47±0.03c 0.55±0.01c
TPC: total phenolic content = mg gallic acid equivalentsg-1 (on dry weight basis). FLC: total flavan content = mg catechin equivalentsg-1 (on dry weight basis). aEC50 = mg of grapes (on dry weight basis) required to obtain 50% DPPH˙ scavenging. bEC50 = mg of grapes (on dry weight basis) required to obtain 50% ABTS+
˙ scavenging. Different letters in a column indicate the significant differences in the mean at the p < 0.008 level (Bonferroni’s correction).
According to Toivonen (2003) and Wismer (2003), low temperature is a causative agent of oxidative stress in postharvest of fruit and vegetables, and it appears to enhance levels of antioxidants as observed in the present study. In agreement with what has been discussed above about grape quality traits, the hypothesized transient thermal stress associated to an immediate need of energetic substrate (increase respiration) induced by low temperature, may be responsible for the increase in phenylpropanoid metabolism and thus in the accumulation of phenolics in cold stored grapes (Saltveit, 1999). Conversely, ozone-fumigated grapes showed a great reduction of both TPC and FLC compared to cold storage (GO: -25.8% and -21.1%, for TPC and FLC respectively), which was greater for grapes exposed to ozone in pure nitrogen (-43.5% and -34.3%, for TPC and FLC respectively). The significant higher decrease in the phytochemical content observed for ozone-treated samples could be due to the strong redox potential of ozone (+2.07 eV; Torres et al., 2011). However, in case of anaerobic atmosphere (pure nitrogen), we would
have expected a lower oxidation of phytochemicals, due to the absence of molecular oxygen (+1.23 eV), and in this sense the observed data are surprising. Since the loss regards mainly the phenolic acids, we could suppose that the lack of oxygen, reducing the ethylene biosynthesis, has halted the synthesis of phenolic acids acting on phenylalanine ammonia-lyase (PAL), which is ethylene-dependent. Summarising, while cold stress induces the synthesis of polyphenols, ozone plays an oxidative role buffering this synthesis; however, if the ozone treatment is done in pure nitrogen, beyond a slight oxidation, a reduction in the synthesis of phenolic acids is observed. According to literature data, the effects exerted by ozone on the fruit quality during storage are in some cases contradictory and strictly dependent on several factors such as the ozone concentration, time of exposure, storage temperature and finally the nature of regulatory mechanisms underlying their ripening process (i.e. climacteric or not) (Horvitz & Cantalejo, 2014). In particular with regard to table grapes, the authors underlined that the effect of ozone on phenolics seems to be related to the time of exposure and the class of phenolic compounds considered. Regarding wine grapes, De Sanctis (2013) reported a positive effect of ozone (concentration: 1.5 g/h, time of exposure: 16 hours) on the phenolic content of Sauvignon blanc grapes. Moreover, the author pointed out a link between the phenolic content and the degree of grape ripeness, while other authors highlighted the influence of the degree of ripeness on susceptibility to oxidative stress (Toivonen, 2003). The antiradical potential of grapes was evaluated in the present study by means of two different in vitro assays: the DDPH• and ABTS•+ scavenging methods (Table 6). Cold storage
enhanced AC of grapes respect to that at harvest, followed by ozone in air treatment, while no significant differences were recorded between GH and GNO samples. In this case, the lower TPC of GNO samples compared to that