Proceedings of the 9th Biennial ASME Conference on Engineering Systems Design and Analysis ESDA08 July 7-9, 2008, Haifa, Israel
ESDA2008-59307
CMM MEASUREMENT VARIABILITY ANALYSIS: A COMPARISON BETWEEN TWO
METROLOGICAL LABORATORIES MEASURING THREE INDUSTRIAL
WORKPIECES
Francesco Aggogeri University of Brescia
Department of Mechanical and Industrial Engineering Via Branze, 38 25123, Brescia (Italy) [email protected] Emanuele Barini Politecnico di Torino
Department of Production Systems and Business Economics
Corso Duca degli Abruzzi, 24 10129, Torino (Italy) [email protected]
Raffaello Levi Politecnico di Torino
Department of Production Systems and Business Economics
Corso Duca degli Abruzzi, 24 10129, Torino (Italy) [email protected]
ABSTRACT
Quality may be defined as a set of requirements a system should satisfy in order to meet customer’s needs. Control of these requirements assures satisfaction of relevant standards, and consequently the performance levels of a manufacturing/transactional stream. In this context it is fundamental to define control procedures and reliable measurement systems adequate for adopting improvement action as soon as anomalies and dysfunctions are detected. This paper deals with a study of measurement variability occurring during practical exploitation of CMMs (Coordinate Measuring Machines).
These measurement systems are designed to probe selected points of workpiece surface, and compare the relevant coordinates or derived quantities with specified values; capability and versatility of CMMs justify their widespread use in industry. Evaluation of CMM measurement variability is however often awkward owing to a number of factors, such as e.g. measurement task, environment, operator and measurement procedures.
A round robin exercise involving two industrial laboratories was planned in order to address these issues. Three typical machine tool parts were circulated among participants,
who were asked to measure linear dimensions as well as tolerances at specified locations, according to an agreed upon schedule.
Results of measurements, performed by experienced CMM industrial users, were analyzed in order to bring out discrepancies, and suggest remedial actions in the light of information gathered. Several factors involving metrological as well as other aspects were observed to cause major discrepancies, yielding in turn information on where to look for potential sources of trouble. Conclusions were drawn in terms of operating procedure, leading to improved information on origin and components of variability.
1. INTRODUCTION
The inherent volatility and ever increasing competition typical of modern markets, and quest for customer satisfaction, make reliable quality control systems mandatory for manufacturing companies.
In this light a practical study was planned concerning variability of mechanical measurements performed with CMMs, involving two metrological laboratories in a round robin exercise in order to check three workpieces representative of a given industrial environment. CMMs are mainly used for
off-line inspection, usually performed by positioning a variety of probes in a three-dimensional space, and pick up coordinates pertaining to selected surfaces of a workpiece, in order to identify features and departures from specification.
CMMs come in a variety of shapes and sizes to fit a broad range of requirements, bridge or gantry types being among those most used by manufacturers of medium to large size mechanical components.
An actual industrial problem stimulated the present study, namely how to obtain reliable, readily reproducible data, when a given piece is measured on different CMMs in different environments. Ever increasing market globalization entails localization of substantial parts of production stream in different places of the globe, forcing continuous improvement of quality control activities and optimization of measurement systems, in order to ensure effective interchangeability of parts produced by different suppliers, a key factor in fulfillment of global project requirements.
Understanding, managing and controlling measurement variability is a major issue in the never ending quest for reducing rejection of sound pieces, and acceptance of nonconforming ones.
In fact, tolerance verification standards [1] state that conformity is declared, and a product accepted, whenever measurement result fall within the tolerance band deducted of uncertainty at both ends; non conformity is declared, and rejection occurs, whenever measurement results fall outside of the tolerance band augmented by uncertainty at both ends [2,3]. The correct estimation of measurement uncertainty, mainly dominated by the variability of the measurement process, is a difficult operation as can be outlined from the results of several international intercomparison but it is mandatory for all of those companies who want to comply with ISO standards [4]. Reproducibility analysis, covers necessarily only a subset of sources contributing to overall variability, as some may come to light a posteriori only.
Task dependent factors impacting variability are related to specific measurement procedures, ambient conditions, operator’s experience, part geometry and/or workpiece measured features. Therefore a priori estimation of uncertainty, according to statistical criteria and expert assessment as mandated by GUM [5], may not always agree with a posteriori evaluation based upon experimental evidence, in terms of measurements performed under conditions closely approximating those of actual operation.
In this light a round robin exercise was planned and carried out concerning three pieces, characterized by basic dimensions and geometrical tolerances typical of the industrial environment concerned, circulated among two metrological laboratories, recognized as leaders in their field.
Gathering information concerning problems, potentialities and guidelines for practical improvement of CMM work in a machine tool producing district was one of the aims of this work.
2. VARIABILITY AND UNCERTAINTY IN CMM MEASUREMENTS
As demonstrated by several international intercomparisons, performed on both length measurements (distance between ball plates sphere centers, gauge blocks or step gauges ) and geometrical and dimensional tolerances, the evaluation of the CMM’s measurement uncertainty is problematic [6-9].
Experimental results of industrial applications show a worst landscape mainly due to the toughness of the measurement missions; they are generally related to geometric tolerances verification on manufactured workpieces performed with several machines setups, a limited amount of sampled points and all the other complications that real life cases demonstrate. The main reason of this difficulty is the high level of versatility of CMM: as they can measure most of the dimensional characteristic of workpieces, they are complex systems which measurement setup, strategy, evaluation software and the measurand as well, highly interact to contribute to the measurement variability so to the measurement uncertainty.
It is fair to say that the measurement variability, understood as reproducibility, is not the only factor affecting the uncertainty but it is one of the largest as can be derived from the literature.
The categorization of uncertainty factors reported in literature starts from pretty the same uncertainty contributors classified in a different way by researchers: Trapet et al. [10] collected the factors with respect to a gnoseological point of view dividing them in the ones are generally accessed by the measurement and those that are commonly estimated. The first class pertains to uncertainties related to probing errors (random, changing and articulation) and geometrical parameters, while in the second, he collected errors such as: long term changes of systematic errors, model imperfections, drift.
Salsbury [11] chose to collect the uncertainty factors with respect to the source: probe components, part components, repeatability define his model. Wilhelm et al. [12] described an extensive an precise framework where the factors are divided into five categories with respect to the source of the uncertainty: hardware, workpiece, sampling strategy, fitting and evaluation algorithms and extrinsic factors (i.e reproducibility). One of the important feature of this model is the explicit interactions between factors that do not belong to the same class showing clearly that only a task specific uncertainty model might be adequate. From the end-user point of view the boundaries that defines those categories are faint. Whenever an acceptance control is performed, the measurement is carried out in reproducibility conditions: changing in machines, probing system, measurement strategies are completely uncontrolled producing variability that hardly can be keep into account and strictly condensed in one category.
Starting from those categorizations different approaches were developed to face the problem of uncertainty assessment.
The rigorous application of GUM is limited to the case where the analytical relationship between the measurand as a function of measured parameters can be clearly express and approximate with an acceptable loss in accuracy. This cases are not so frequent in real life applications and only few have been analyzed and presented, in particular regarding circular features [13,14]. This approach requires a large contribution from experts to quantify correctly and in effective way (without a large number of experimental trials) the uncertainty of each contributor.
The method commonly applied for the uncertainty estimation is the “substitution method” defined in ISO 15530-3 Standard [15]. This method consists on the use of the CMM only for comparative measurement with respect to a calibrated artifact equal in all characteristics to the measured object. In such a case the CMM’s uncertainty contributors are diminished by the accuracy component while terms related to the dissimilarity of the calibrated artifact from the measured object have to be kept into account. Owing to the simplicity its application is widespread, even in those field where a calibrated artifact is really hard to realize such as gear verification [16] and good results have been obtained for freeform surfaces [17] as well. This procedure is also effective as metrological confirmation but, as can be intended comparative measurement carries do not have advantages only. One of the most important drawback is related to the calibration of the object; it is needed to be done, in the case of complex geometry or measurand, by other CMM with lower uncertainty with respect to the first one and different uncertainty evaluation models (i.e simulation methods). Another disadvantage is the limitation to the CMM operability because any other measurement is allowed except those calibrated on the reference artifact. In any case the measurement reproducibility must be controlled because any factor that differs from the measurement on the calibrated artifact to the measured part lead to an increase of the measurement uncertainty.
Computer simulations are the next frontier for uncertainty assessment not only for CMM but for a large number of measurement instruments for which the GUM approximations are too stringent. Several methods have been developed from researchers: “Expert CMM” [18], “Virtual CMM” [10] “Simulation by constraints” [19], “Virtual Instrument” [120] and some application of the general theory of Monte Carlo simulation have been applied [21]. all of these methods model the CMM and the measurement process and the simulation of those two allows to propagate the uncertainty from the source to the measurement results. All of these methods demonstrates good performances with respect to multiple measurement strategies [22] and their mayor issue is the preservation of the CMM operability. Some of them can be run off-line to simulate a measurement process and its uncertainty before making any real measurement.
Even in these cases one of the main problem is the estimation of the measurement reproducibility: variability due
to environmental factors is kept under control when the measurements are performed in controlled rooms and continuous and accurate check of the CMM parameters is carried out but this is not the case in industrial environment. It must be noticed that interactions between factors are not considered to be significant. It is fair to say that it might be because of the protected environment but in the case of the use of CMM on shop floors this may not: for example thermal phenomena and their implications, even if extensively studied are still key points to be considered [23-25].
Starting from these assumption several researchers tried to find a comprehensive framework to that keeps into account the interactions between measurement parameters. Design of experiments and the analysis of variance are correct tools to manage this problem. Varghese et al. [26] investigated, in simulated environment, the influence of sample density, measurement error, form characteristic and sampling scheme on form fitting algorithms (least squares, minimax and minimum circumscribed circle) in the case of circular feature. They used the results coming from the 24 factorial experiment to generate a error compensation model for each form algorithm that is specifically affected from the sampling scheme. Piratelli-Filho et al. [27] selected a modified L9 Taguchi array to understand the influence of position in X, Y and Z axes, length of the ball bar and orientation in the work volume on the scatter of measurement error. The results showed a large influence of orientation and length of the standard artifact as the interaction between them. With a simulation study, Sun et al. [28] focused their attention on accuracy and uncertainty of CMM measurement using an elaborated factorial plan that involved fitting algorithms, sampling size and sampling method. Their interesting results were efficiently presented as sort of a guide to help the operator to reach those two objective setting the parameters in appropriate way. Starting to explore the world of unusual surfaces, Aguirre et al. [29] worked on torus developing a 6 factors factorial plan. They demonstrated that fitting algorithm, and approach of evaluating the characteristics of torus, were the only main effects that were significant, as well as the interactions between the sample size and the fitting algorithm; type of torus (male, female) and approach; sample size, fitting algorithm and approach. Tang et al. [30] quantified the large influence of scanning probe on measurement uncertainty. Finally Feng et al. [31] showed, using a fractional 25-1 central factorial design interactions between measurement speed and the face factor of the tip.
3. PROJECT BACKGROUND
In order to identify major factors affecting measurement results, the first step of the project was aimed at selecting some typical parts, suitable for highlighting real problems arising in the course of metrological activities.
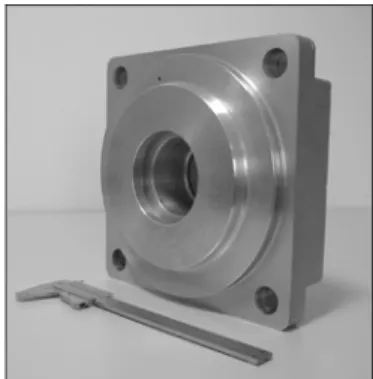
Three machine components were accordingly chosen, which a manufacturing company in the area would be likely to control routinely in its metrological laboratory. These typical machine tool components – a sleeve (M1), a spindle (M2) and a
platform (M3) with a bushing, shown in Figure 1 (a, b, c) - are characterized in terms of basic dimensions (e.g. length, diameter) and geometrical tolerances (e.g. symmetry, concentricity).
In this context dimensions and related accuracies are fundamental to define the performance of manufacturing processes, and prevent machine malfunctions resulting in parts deviating from specifications.
Fig. 1 (a): The audit pieces: a sleeve (Master 1)
Two metrological laboratories were involved, namely a calibration center (C), entrusted to provide reference values for each required dimension or geometrical tolerance, and a CMM constructor (M), who routinely validates CMMs in a properly controlled environment.
Fig. 1 (b): The audit pieces: a spindle (Master 2)
Thus comparison of results of two benchmarks, supported by robust statistical analysis, was aimed at.
Participating laboratories were asked to measure the pieces according to their current operating rules and procedures, in order to bring to light discrepancies arising from measurement activities.
Fig. 1 (c): The audit pieces: a platform (Master 3)
A short form list of measurements required for each piece is shown in Table 1.
CMM operators were asked to qualify their machines, and repeat/replicate measurements as they deemed necessary to define a reliable value for the different tasks. Thus the calibration center (C) decided to apply one replication per three repetitions, while the CMM constructor (M) three replications per five repetitions, as shown in Table 2.
Basic dimension/geometrical
tolerance
Master 1 Master 2 Master 3
Diameter 4 7 5
Perpendicularity 1 - 2 Concentricity 3 - 4
Circular runout - 3 -
Symmetry - 2 -
Tab. 1: List of measurements required for each machine tool component
Repetition indicated the measurement activities deployed in the same day, while replication defined the number of days involved in the measurements.
According to an established common procedure, in every trial operators were asked to remove and put back the piece on the table in the same position. All measurements were performed in air conditioned laboratories (20 ± 0.5 °C), allowing ample soaking time to reach uniform temperature, in order to rule out substantial thermal effects.
Laboratory No. # of replications
No. # of
repetitions Note Calibration
center (C) 1 3 One day
CMM
constructor (M) 3 5 Mo.– We. – Fr. Tab. 2: Number of replications and repetitions per laboratory; the
complete measurement procedure is performed during a replication while only the specific measurement is re-examined
during a repetition
Both laboratories used the same model of CMM, Mitutoyo Legex 9106, shown in Figure 2. The fixed bridge structure and precision air bearings, resting on rigid guide ways, ensure adequate stability of motion and measuring accuracy.
Suitable for complex small and medium size workpieces for which high dimensional accuracy is specified, capacity is defined by an operating volume with x = 905 mm, y = 1005 mm and z = 605 mm.
The constructor states the maximum permissible error of indication of this CMM for size measurements as MPEE = (0.48
+ L/1000) µm, verified following ISO 10360/2, and guarantees rated performance within a temperature range of 18 to 22°C.
Fig. 2: The CMM used for the round robin exercise, Legex 9106
4. EXPLORATORY ANALYSIS
The first step of the exploratory analysis involved a visual evaluation of collected data, stratified per day. In fact the CMM constructor laboratory (M) developed the measurement activities on the first, middle and last day of the week; thus identifying some trends among sources of problems.
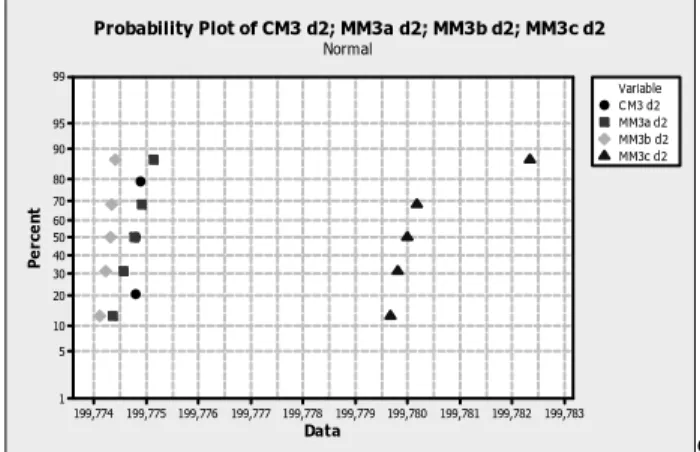
Probability plots show a substantial effect of the “day” factor, both for basic sizes and geometrical tolerances, as shown in Figure 3. For instance, considering Master 3 (Figure 3a), the third replication (Friday) of measurements for M laboratory could impact significantly on the final results of d2 diameter. In the same way Figure 3b shows a substantial effect of the last day of the week on the collected data for the geometrical tolerances of Master 2, such as symmetry td4.
Data Pe rc e n t 199,783 199,782 199,781 199,780 199,779 199,778 199,777 199,776 199,775 199,774 99 95 90 80 70 60 50 40 30 20 10 5 1 Variable CM3 d2 MM3a d2 MM3b d2 MM3c d2 Probability Plot of CM3 d2; MM3a d2; MM3b d2; MM3c d2
Normal
Fig. 3a: Comparison of dimensional tolerance d2 measured on component Master 3 (M3) by two laboratories (C, M) with respect
to the day (a, b, c), showing substantial systematic effects (mm) Data also show the presence of some outliers for laboratory M, probably due to repositioning of the pieces on the table in the same nominal position for every trial. This
aspect underlines the fundamental role of the operator during the measurement activities. Lack of an exacting, detailed procedure can be a significant source of variability. Absence of outliers for laboratory C, who deployed measurement activities in one day, is peculiar.
The second step in preliminary evaluation was a comparison of the collected data between two laboratories, in order to assess possible significant differences. Boxplots were drawn using calibration center’s average as reference for each basic dimension and geometrical tolerance. Accordingly Figure 4 shows boxplots for each measurement as differences between all collected data and the reference value, namely the average provided by C, thus highlighting all substantial discrepancies between C and M, and related measurement problems. Basic dimensions show substantial agreement among laboratories, the reference values are contained within the variability of the measurements performed by M laboratory and the accuracy of CMM is still to be considered. Data Pe rc e n t 0,07 0,06 0,05 0,04 0,03 0,02 0,01 0,00 99 95 90 80 70 60 50 40 30 20 10 5 1 Variable CM2 td4s MM2atd4s MM2btd4s MM2ctd4s Probability Plot of CM2 td4s; MM2atd4s; MM2btd4s; MM2ctd4s
Normal
Fig. 3b: Comparison of geometrical tolerance td4 measured on component Master 2 (M2) by two laboratories (C, M) with respect
to the day (a, b, c), showing substantial systematic effects (mm)
Da ta LAB M1D d4 M1D d3 M1D d2 M1D d1 M C M C M C M C 0,00 -0,02 -0,04 -0,06 -0,08 -0,10 Boxplot of M1D d1; M1D d2; M1D d3; M1D d4 vs LAB
Figure 4. Comparison among laboratories (C, M) measuring basic dimensions (d1, d2, d3, d4) of component Master 1 (M1); substantial agreement can be outlined, CMM’accuracy must be
Figure 4 highlights some particular problems only in measuring diameter d2 (Master 1) for laboratory M. In fact d2 is an internal diameter of the sleeve; some difficulties were possible in the choice of the probe, leading to increased variability. However several discrepancies are noted for geometrical tolerances (Figure 5), suggesting the need of further analysis.
5. ANOVA
Further analysis of results was performed in order to clarify the impact on measurement variability of different factors; four were identified worth of inclusion in ANOVA. The first factor was the type of piece (PRT: sleeve, spindle or platform).
Operators highlighted different complexity of the Masters during measurement activities, in particular concerning correct clamping procedure on CMM table, and problems related to checking geometrical tolerances.
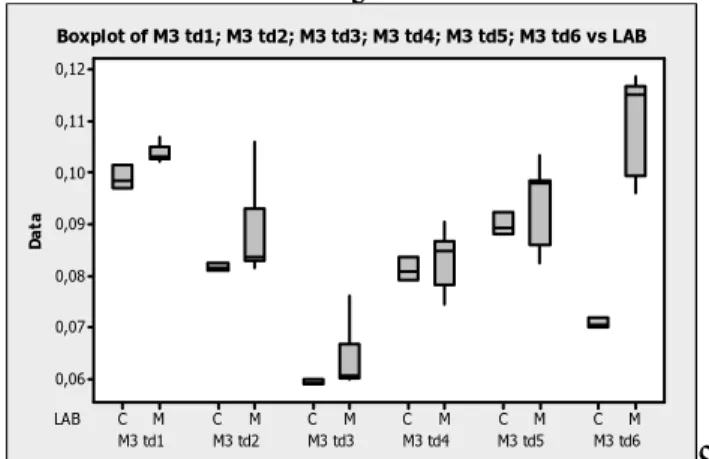
Da ta LAB M3 td6 M3 td5 M3 td4 M3 td3 M3 td2 M3 td1 M C M C M C M C M C M C 0,12 0,11 0,10 0,09 0,08 0,07 0,06 Boxplot of M3 td1; M3 td2; M3 td3; M3 td4; M3 td5; M3 td6 vs LAB
Figure 5. Comparison among laboratories (C, M) measuring geometrical tolerances(td1, td2, td3, td4) of component Master 4
(M4); spread and skewness suggest further investigations The second clearly identified source of variability was the metrological laboratories (CT). They are benchmarks for CMM field, nevertheless a different experience and procedures were supposed. The measurement type (MES) (size or geometrical tolerance) represented a further element likely to contribute to global variability of the system. Accuracy obtained in measuring a diameter rather may differ substantially with that concerning evaluation of concentricity, see e.g. Figure 4. The last factor considered concerned measured features (SET: 4 levels) nested in PRT, such as e.g. in order to assess whether discrepancies exist in checking internal, or external diameters.
Analysis of results of what may be summarily described as a four factor nested factorial design [32], PRT×MES×SET×CT with 3×2×4×2 = 48 combinations, considered among others response DIFF, representing differences between readings and nominal values. Log transform to achieve approximate normality and simplify substantially interpretation of results was resorted to. Table 3 shows a summary of the analysis of variance, underlining significant single and combined effects of measurement type, piece and measured feature (nested in type
of piece) on the response. Substantial contributions due to interactions between measurement type / piece and measurement type / measured feature may be observed, confirming and further explaining observations gathered in the course of exploratory analysis. Part complexity and feature measured provide a significant contribution to measurement scatter. In order to deal with such a problem a structured procedure should be defined, identifying critical dimensions and/or geometrical tolerances to be dealt with using particular care. Source DF SS MS F P CT 1 1,4259 1,4259 3,22 0,100 MEAS 1 4,4330 4,4330 10,00 0,009 PRT 2 23,2900 11,6450 26,28 0,000 SET(PRT) 9 16,6878 1,8542 4,18 0,015 CT*MEAS 1 0,0003 0,0003 0,00 0,979 CT*PRT 2 0,1816 0,0908 0,20 0,818 CT*SET(PRT) 9 1,8989 0,2110 0,48 0,863 MEAS*PRT 2 11,9232 5,9616 13,45 0,001 MEAS*SET(PRT) 9 35,1729 3,9081 8,82 0,001 Error 11 4,8748 0,4432 Total 47 99,8885 S = 0,665706 R-Sq = 95,12% R-Sq(adj) = 79,15%
Tab. 3: Summary of ANOVA pertaining to response DIFF, differences between readings and nominal values; single factors
i.e. measurement type (MES), part (PRT: sleeve, spindle and platform), measured features (SET: 4 levels) nested in PRT , are
significant as their interactions
Assessment of measurement variability, concerning particularly the third replication of laboratory M, was the object of further examination, based upon a mixed factorial design in three factors, namely piece (PRT: sleeve, spindle and platform) replication (SET: C, M1, M2, M3) and measured feature (ZONE: 4 levels) nested in PRT. Responses chosen were differences between readings and median value for basic dimensions (D. Median), and geometrical tolerances (T. Median). Median was selected as a measure of central tendency far more robust to outliers than arithmetical average, and almost as efficient for small sample sizes as in the case at hand. Tables 4 and 5 present a summary of ANOVA results for response D. Median and T. Median.
Analysis of Variance for D.Median
Source DF SS MS F P PRT 2 230687 115343 6,51 0,005 SET 3 62465 20822 1,18 0,337 ZONE(PRT) 9 1182506 131390 7,42 0,000 PRT*SET 6 104291 17382 0,98 0,457 Error 27 478140 17709 Total 47 2058089 S = 133,075 R-Sq = 76,77% R-Sq(adj) = 59,56% Tab. 4: Summary of ANOVA pertaining to response D. Median; significant factors are part (PRT: sleeve, spindle and platform),
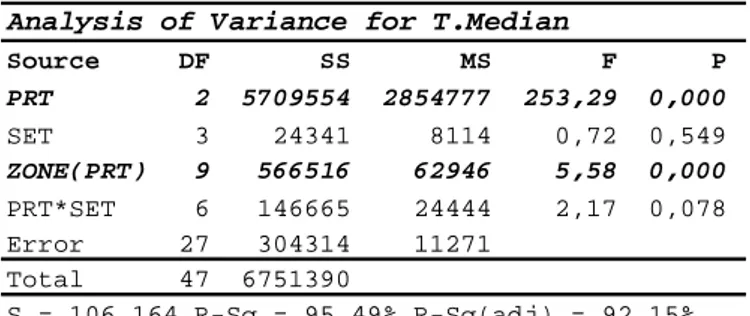
The analysis shows important effects of piece (PRT) and measured feature (ZONE) factors on both responses, confirming results of Table 3, and underlining the need to give these factors proper consideration.
Analysis of Variance for T.Median
Source DF SS MS F P PRT 2 5709554 2854777 253,29 0,000 SET 3 24341 8114 0,72 0,549 ZONE(PRT) 9 566516 62946 5,58 0,000 PRT*SET 6 146665 24444 2,17 0,078 Error 27 304314 11271 Total 47 6751390 S = 106,164 R-Sq = 95,49% R-Sq(adj) = 92,15%
Tab. 5:Summary of ANOVA pertaining to response T. Median; significant factors are part (PRT: sleeve, spindle and platform),
and measured feature (ZONE: 4 levels) nested in PRT 6. DISCUSSION
Measurement variability is just a component of measurement uncertainty but its correct estimation is essential for a correct uncertainty assessment. Actual uncertainty estimation methods, coming out from many effort from TC213 ISO Committee, are can hardly consider directly the interactions between uncertainty sources, leaving on the field a large amount of variability especially in the case of applications outside metrological rooms.
The study addresses a problem of concern in industry: how to achieve reliable, accurate measurements, and agreement among different metrological laboratories when they check the same size or geometrical tolerance. It may dramatically affect costs and/or production lead-times, particularly when manufacturing takes place in several sites located far away, as typical of today’s global economy.
Further considerations concerning CMM measurement variability are in order. When undertaking analysis of the measurement variability problem, ISO/TR 14253 – 2 [33] that identifies the main causes of measurement uncertainty [34] must be given due consideration. A substantial source of lack of agreement among measurements may be traced to environmental conditions, mainly temperature (and its variations) [35], humidity, vibrations or possible dust of equipments [36]. While in this project these factors were substantially ruled out, since almost ideal conditions were within reach in measurement laboratories, this may well not be the case in other situations. The importance of monitoring and controlling environmental conditions of the metrological room, of ensuring proper soaking time for the piece to reach uniform temperature, and of cleanliness in order to prevent even minute speckles of dust or lint to interfere with measurement, was however underscored in a preliminary part of the study.
Another significant source of variability [37] may be traced to a lack of accuracy of the measurement system and equipments. In this round robin exercise both laboratories used
a Legex Mitutoyo, ensuring proper stability and adequate measuring accuracy for complex small and medium size workpieces. A high accuracy CMM CNC operation is made possible by rigorous analysis of all possible error-producing factors, and elimination or minimization of their effects, thus ensuring marginal contribution only of the CMM proper to measurement error. The importance of measurement strategy (number of touched points, probe kinematics and dynamics) on the definition of the variability cannot be overemphasized.
However often control acceptance departments have to check pieces without the benefit of key information on supplier’s control processes, and adopt under these conditions the best measurement strategy leading reliable results. In order to reproduce such a situation, no suggestion were given to participating laboratories concerning procedures or measurement strategies, asking them instead only to perform a meaningful set of measurements for industrial workpieces.
Operator’s choices and strategies may definitely affect both measurement variability and final results, as underlined in ANOVA tables. Therefore CMM operators were involved in a brainstorming session, aimed at highlighting difficulties faced during the round robin exercise, and discuss suggestions on how to improve the situation. Several problematic aspects were mentioned, concerning inter alia poor communication with designers, designer’s mistakes, and sheer lack of capacity of matching some requirements.
Some examples describe typical critical situations. Checking of dimension c1, a virtual diameter pertaining to a female taper of Master 2 (Figure 6), may lead to substantial measurement difficulties, and a likely inflation of variability. In order to avoid incurring into such problems designers and CMM operators should agree upon an alternative dimension just as apt to verify the functional feature at hand, and definitely easier to check.
Fig. 6: Master 2: problems and difficulties incurred during measurements
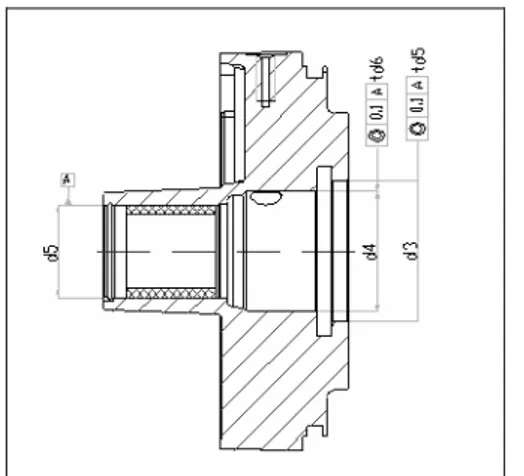
CMM operators met also problems when measuring on Master 3 geometrical tolerances td5 and td6, requiring surface A as reference, (Figure 7). It could well be a designer’s
blunder; surface A does not provide readily a proper reference, its length being too small. Maybe a modification to drawing took place, e.g. introduction of the bushing, without updating references.
These considerations support the results of statistical analysis. By and large data show a good agreement between the laboratories for basic sizes (diameters); on the other hand, substantial problems surface concerning geometrical tolerances. Both part complexity and measured features have a significant impact on the quality of the results.
A pragmatic analysis of measurement variability concerning CMM is addressed in this example. A priori identification of major sources of variability, and measures to contain their effects, should cover a study of measurement methods and conditions, and integrating the main processes of a manufacturing stream such as design and control activities.
Fig. 7: Master 3: problems and difficulties incurred during measurements
The involvement of the metrological laboratories highlights representative aspects of what happens in the industrial context. Along with a good agreement of results concerning basic sizes (diameters), estimates of geometrical tolerances exhibit substantial scatter, leading to substantial probability of wrong results in acceptance tests.
Coming to sources of measurement variability, environmental conditions, poor qualification of operators and inadequacy of CMMs may be ruled out in the case at hand. ANOVA points out to part complexity, measured features and their interaction may contribute substantially to overall variability. As stated by CMM operators, poor communication with design department, or mistakes on technical drawings may negatively affect measurement accuracy.
A pragmatic analysis exploiting statistical tools helped to pinpoint critical geometrical tolerances of a piece, on which designers and CMM operators should cooperate in order to upgrade the performance of measurement systems [38]. Improvement of communications across departments helps to ensure early awareness of measurement problems, a prerequisite for addressing them properly.
This paper is dedicated in fond memory of our colleague, mentor and friend Prof. Enzo Gentili, whose untimely death is deeply regretted.
7. REFERENCES
[1] ISO 14253-1, 1998, Geometrical Product Specifications (GPS) – Inspection by measurement of workpieces and measuring instruments – Part 1: Decision rules for proving conformance or non-conformance with specification, International Organization for Standardization, Geneva.
[2] UNI EN ISO 10360-2, (2001) Geometrical Product Specifications (GPS) - Acceptance and reverification tests for coordinate measuring machines (CMM) - Part 2: CMMs used for measuring size, Geneva.
[3] Romano D., Vicario G., (2002) Baseline Uncertainty in Geometric Tolerance Inspection by Coordinate Measuring Machines: the Case of Position Tolerance with Maximum Material Condition, ENBIS Second Annual Conference on Business and Industrial Statistics, Rimini.
[4] ISO 9000-9004, 2000, Quality Management Systems and supporting documents, ANSI/ASME, New York. [5] Guide to the Expression of Uncertainty in
Measurements, ISO, Geneva 1995.
[6] Jusko, O., Salsbury, J.G., Kunzmann, H., 1999, Results of the CIRP-form intercomparison 1996-1998, Annals of the CIRP, 48/1:413-417.
[7] Hansen H.N., and De Chiffre L., 1999, “An industrial comparison of coordinate measuring machines in Scandinavia with focus on uncertainty statements”. Precision Engineering 23, p. 185-195.
[8] Balsamo, A., et al., 1997, Results of the CIRP Euromet intercomparison of ball plate-based techniques for determining CMM parametric errors, Annals of the CIRP, 46/1:463-467.
[9] [9] Meneghello, R., De Chiffre, L., Balsamo, A., 2001, Precision of Coordinate Measurements in Industry: AUDIT ITALIANO, Proc. 2nd Euspen Intl. Conf., 346-349, Turin, Italy.
[10] Trapet, E., Waldele, F., 1996, The Virtual CMM Concept, In Advanced Mathematical Tools in Metrology II, World Scientific, 238-247.
[11] Salsbury, J.G., 1995, A Simplified Methodology for the Uncertainty Analysis of CMM Measurements, Tech. Paper, Conf. On Precision Metrology/Applying Imaging and Sensoring, Society of Manufacturing Engineers, Indianapolis, IN, IQ95- 155:1-22.
[12] Wilhelm, R.G., Hocken R. and Schwenke H., Task specific uncertainty in coordinate metrology, Keynote paper, Annals of CIRP, Vol. 50/ 2 (2001), pp. 553–563. [13] Phillips, S.D., Borchardt, B., Estler, W. T., Buttress, J., 1998, The estimation of measurement uncertainty of small circular features measured by coordinate measuring machines, Precision Engineering, 22:87-97.
[14] Barbato, G., Barini, E. M., Valutazione dell'incertezza nelle misure ottenute con Macchine di Misura a Coordinate (CMM) - note pratiche, TUTTO_MISURE, 2006, Vol. 4
[15] ISO/TS 15530-3:2004 Geometrical Product Specifications (GPS) -- Coordinate measuring machines (CMM): Technique for determining the uncertainty of measurement -- Part 3: Use of calibrated workpieces or standards, Geneva.
[16] Sammartini, M., and De Chiffre, L.: 1998, “A task specific gauge for pitch measurement of cylindrical gears”, 6th ISMQC (IMEKO)
[17] Savio, E., De Chiffre, L., 2001, ”An Artifact for Traceable Free Form Measurements on Coordinate Measuring Machines”, Precision Engineering (in press)
[18] Balsamo, A., Di Ciommo M., Mugno R., B. I., Rebaglia, E., Ricci, R., Grella, 1999, Evaluation of CMM uncertainty through Monte Carlo simulations, Annals of the CIRP, 48/1:425-428.
[19] Phillips, S.D., et al., 1997, The Calculation of CMM Measurement Uncertainty via the Method of Simulation by Constraints, Am. Soc. for Precision Engineering, 16:443-446.
[20] Haitjema, H., van Dorp, B., Morel, M., and Schellekens, P.H.J., 2001, “Uncertainty estimation by the concept of virtual instruments”, Proc. SPIE 4401 Recent Developments in Traceable Dimensional Measurements', J.E. Decker and N. Brown, Eds., SPIE. [21] Schwenke, H., Siebert, B.R.L. , Wäldele, F.,
Kunzmann H., 2000, Assessment of uncertainties in dimensional metrology by Monte Carlo simulation: proposal of a modular and visual software, Annals of the CIRP, 49/1:395-398.
[22] ISO/CD TS 15530-2 Geometrical Product Specifications (GPS) -- Coordinate measuring machines (CMM): Technique for determining the uncertainty of measurement -- Part 2: Use of multiple measurements strategies in calibration artefacts. [23] Balsamo, A., Marques, D., Sartori, S., 1990, A Method
for Thermal-deformation Corrections of CMMs, Annals of the CIRP, 39/1:557-561.
[24] Kruth, J.-P., Van Herck, P., Van den Bergh, C., Schacht, B., 2000, A Parametric Model for Compensation of the Temperature Dependent Geometry of a Coordinate Measuring Machine, Proc. 2nd Intl. Seminar on Increasing Machine Tool Performance, La Baule, France.
[25] Kruth, J.-P., Van den Bergh, C., Van Herck, P., 2001, Correcting Steady-State Temperature Influences on Coordinate Measuring Machines, J. Mfg. Sys., 19/6:365-374.
[26] Varghese, P.; Zhang, C.; Wang, H.-P. A design of experiment approach to the selection of CMM form-fitting algorithms International Journal of Production
Research Vol.34 Issue.10 2755-2765 1996 ISSN 00207543
[27] Piratelli Filho, A., Giacomo, B.D., Evaluation Of Coordinate Measuring Machines Performance Using Design Of Experiments. In: XV Inational Measurement Confederation - IMEKO, 1999, Osaka, Japan. v. 8. p. 23-29.
[28] A.Y. T. Sun, S. Anand, J. S. Y. Tang, CMM inspection and uncertainty analysis of form tolerances, International journal of production research, 2002, vol. 40, no. 9.
[29] Aguirre-Cruz, J.A.; Raman, S. Torus form inspection using coordinate sampling Transactions of the ASME. Journal of Manufacturing Science and Engineering Vol.127 Issue.1 84-95 2005 ISSN 10871357.
[30] Tang, Shih-Yi James; Sun, Albert Y.T. Characterizing the uncertainty of CMM measurements using Design of Experiments (DOE), International Journal of Industrial Engineering : Theory Applications and Practice Vol.9 Issue.4 418-431 2002 ISSN 10724761. [31] C. J. Feng, A. L. Saal, J. G. Salsbury, A. R. Ness,
G.C.S. Lin, (2007) Design and analysis of experiments in CMM measurement uncertainty study, Precision Engineering 31 94–101.
[32] Montgomery D.C., (2000) Design and Analysis of Experiments, 4th ed., J. Wiley, New York.
[33] ISO 14253-2, (1998) Geometrical product specification (GPS) - Inspection by measurement of workpieces and measuring equipment. Part II: Guide to estimation of uncertainty in GPS measurement, in calibration of measuring equipment and in product verification, Geneva.
[34] Bush K., Kunzmann H., Wäldele F., (1985) Calibration of Coordinate Measuring Machines, Precision Engineering, 7, No. 3, 139-144.
[35] Kruth, J.P., Vanherck, P., Van den Bergh, C., (2000) Thermal Compensation for a CMM on Interferometer Measurements and Testing its Applicability with a Thermal Stable Artefact, Proc. 33rd International MTDR Conference, Springer, 223-229.
[36] Phillips, S.D., CMM Calibration Terminology and Concepts, National Institute of Standards and Technologies, Gaithersburg.
[37] Bialas S., Osanna P.H., Tamre M., Weckenmann A., (2001) Geometrical Product Specifications, Hummienny Z. (ed), Warsaw University of Technology.
[38] Aggogeri F., Barini E., Gentili E., Levi R., (2007) Measurement variability with CMMs in industry: a case study. Proc. 8th Lamdamap International Conference, Cardiff, 44-53.