Full Terms & Conditions of access and use can be found at
http://www.tandfonline.com/action/journalInformation?journalCode=koni20
ISSN: (Print) 2162-402X (Online) Journal homepage: http://www.tandfonline.com/loi/koni20
Bone marrow endothelial cells sustain a
tumor-specific CD8
+
T cell subset with suppressive
function in myeloma patients
Patrizia Leone, Giuseppe Di Lernia, Antonio Giovanni Solimando, Sebastiano
Cicco, Ilaria Saltarella, Aurelia Lamanuzzi, Roberto Ria, Maria Antonia
Frassanito, Maurilio Ponzoni, Paolo Ditonno, Franco Dammacco, Vito
Racanelli & Angelo Vacca
To cite this article: Patrizia Leone, Giuseppe Di Lernia, Antonio Giovanni Solimando, Sebastiano Cicco, Ilaria Saltarella, Aurelia Lamanuzzi, Roberto Ria, Maria Antonia Frassanito, Maurilio Ponzoni, Paolo Ditonno, Franco Dammacco, Vito Racanelli & Angelo Vacca (2018): Bone marrow endothelial cells sustain a tumor-specific CD8+ T cell subset with suppressive function in myeloma patients, OncoImmunology
To link to this article: https://doi.org/10.1080/2162402X.2018.1486949
View supplementary material
Published online: 22 Oct 2018.
Submit your article to this journal
ORIGINAL RESEARCH
Bone marrow endothelial cells sustain a tumor-specific CD8
+T cell subset with
suppressive function in myeloma patients
Patrizia Leone a, Giuseppe Di Lerniaa, Antonio Giovanni Solimandoa, Sebastiano Ciccoa, Ilaria Saltarellaa,
Aurelia Lamanuzzia, Roberto Riaa, Maria Antonia Frassanitoa, Maurilio Ponzonib, Paolo Ditonnoc, Franco Dammaccoa,
Vito Racanelli a*, and Angelo Vaccaa*
aDepartment of Biomedical Sciences and Human Oncology, Unit of Internal Medicine“Guido Baccelli”, University of Bari Medical School, Bari, Italy; bPathology Unit & Leukemia Unit, San Raffaele Hospital Scientific Institute, Milan, Italy;cHematology Unit, IRCCS“Giovanni Paolo II”, Bari, Italy
ABSTRACT
Endothelial cells (EC) line the bone marrow microvasculature and are in close contact with CD8+T cells
that come and go across the permeable capillaries. Because of these intimate interactions, we investi-gated the capacity of EC to act as antigen-presenting cells (APC) and modulate CD8+T cell activation
and proliferation in bone marrow of patients with multiple myeloma (MM) and monoclonal gammo-pathy of undetermined significance. We found that EC from MM patients show a phenotype of semi-professional APC given that they express low levels of the co-stimulatory molecules CD40, CD80 and CD86, and of the inducible co-stimulator ligand (ICOSL). In addition, they do not undergo the strong switch from immunoproteasome to standard proteasome subunit expression which is typical of mature professional APC such as dendritic cells. EC can trap and present antigen to CD8+T cells, stimulating a
central memory CD8+T cell population that expresses Foxp3 and produces high amounts of IL-10 and
TGF-β. Another CD8+T cell population is stimulated by professional APC, produces IFN-γ, and exerts
antitumor activity. Thus, two distinct CD8+ T cell populations coexist in the bone marrow of MM
patients: the first population is sustained by EC, expresses Foxp3, produces IL-10 and TGF-β, and exerts pro-tumor activity by negatively regulating the second population. This study adds new insight into the role that EC play in MM biology and describes an additional immune regulatory mechanism that inhibits the development of antitumor immunity and may impair the success of cancer immunotherapy.
ARTICLE HISTORY
Received 22 February 2018 Revised 4 June 2018 Accepted 6 June 2018
KEYWORDS
Bone marrow; CD8 T cells; endothelial cells; multiple myeloma; MGUS; plasma cells; tumor immune evasion
Introduction
Multiple myeloma (MM) is a lethal plasma cell malignancy that is often preceded by a preneoplastic phase termed monoclonal gammopathy of undetermined significance (MGUS).1 The mechanisms by which MGUS progresses into full-blown MM are incompletely understood. It has been recently recognized that both patients with MGUS and those with MM have, in the bone marrow, tumor-specific CD8+T cells that are, however, unable to limit the expansion of the malignant plasma cells.2-5
Tumor-specific CD8+T cells flooding into the bone marrow initially encounter endothelial cells (EC) that line the bone marrow microsinusoids. Trafficking of CD8+T cells between blood and bone marrow is facilitated by the discontinuous base-ment membrane and the EC fenestrations of sinusoids.6During their trafficking, CD8+T cells have intimate contact with EC, but the implications of this contact are so far unknown.7
Besides the canonical “professional” antigen-presenting cells (pAPC; e.g., dendritic cells), EC are one of the few cell types that have been shown to express both HLA class I and II along with co-stimulatory molecules such as CD40, CD80, CD86 and ICOSL, which are necessary for presenting peptide
antigens to CD4+and CD8+T cells (reviewed in8). EC express the protein machinery for endogenous antigen processing, including proteasome subunits (delta, zeta, MB1, LMP2, LMP7, and LMP10), chaperons and peptide transporters. In some studies, EC have also been shown to trap and cross-present exogenous antigens to activated CD8+T cells, indu-cing in them a regulatory phenotype (Foxp3+, IL-10+, TGF-β+).9-14 Whether tumor-specific CD8+ T cell responses to
plasma cells are regulated by bone marrow EC is not currently understood, and any potential effect of EC on these responses remains essentially unexplored.
In this study, we analyzed the frequency as well as the phenotypic and functional features of EC and CD8+T cells from MM and MGUS patients, and explored the immunolo-gic effects of the interaction between EC and tumor-specific CD8+T cells within the bone marrow.
Results
To understand the immunological role that EC play in tumor-specific CD8+ T cell responses during the MGUS-to-MM CONTACTVito Racanelli [email protected] Department of Biomedical Sciences and Human Oncology, University of Bari Medical School, Policlinico -11, Piazza G. Cesare, 70124 Bari, Italy
*Vito Racanelli and Angelo Vacca have contributed equally to this work and should be considered co-last authors Color versions of one or more of the figures in the article can be found online atwww.tandfonline.com/koni.
Supplemental data for this article can be accessedhere.
progression, we explored a variety of features and functions of these cells from the bone marrow of 20 patients with MGUS and 20 patients with newly diagnosed, symptomatic MM. First, we identified EC and CD8+ T cells and established their relative location within the bone marrow compartment. To this aim, tissue sections from the iliac crest of MGUS and MM patients were immunostained for CD8 and CD34 and analyzed by optical microscopy. EC from both groups were found to line permeable capillaries and be often in direct contact with T cells (Figure 1A). We then quantified EC and CD8+T cells in the two groups. To this aim, freshly isolated bone marrow mononuclear cells
(BMMC) were immunostained and analyzed by flow cytome-try. EC frequency was determined as the proportion of live cells that were CD45−, CD105+and CD309+(Figure 1B). CD8+T cell frequency was determined as the proportion of live cells that were CD3+CD8+(Figure 1C). The mean percentage of EC was significantly (P = 0.0180) lower in MGUS (0.44% ± 0.31%) than in MM (0.91% ± 0.73%) patients (Figure 1D). Conversely, the mean percentage of CD8+ T cells was significantly (P = 0.0157) higher in MGUS (11.13% ± 4.80%) than in MM (7.31% ± 5.16%) patients (Figure 1F). Absolute numbers of EC (P = 0.0140) and CD8+ T cells showed similar trends
Figure 1.EC and CD8+T cells in bone marrow. (A) Representative photomicrographs of bone marrow biopsies from MGUS and MM patients stained for CD8 (brown)
and CD34 (pink). (B-G) Frequency of EC and CD8+T cells in bone marrow samples from 20 MGUS and 20 MM patients. (B,C) Flow cytometry strategies: gating was done sequentially on live cells, on CD45−cells, and then on CD105+CD309+cells to identify EC (B), or it was done on live cells, on CD3+cells, and then on CD8+cells
to identify CD8+T cells (C). Representative plots from one patient for each group. (D-E) EC cells expressed as percentages (D) and in absolute numbers (E). (F-G) CD8+ T cells expressed as percentages (F) and in absolute numbers (G). (H) Memory markers of CD8+T cells, expressed as percentages of cells expressing CD45RA and CCR7
(Figure 1E,G). Altogether, these results suggest that as the frequency of EC increases, that of CD8+T cells decreases in bone marrow during the MGUS-to-MM progression.
The phenotype of bone marrow CD3+CD8+ T cells was also analyzed regarding the expression of CD45RA and CCR7 (Figure 1H). In both MGUS and MM patients, a prevalence of CCR7− cells was observed. These cells were found to be almost equally divided between CD45RA+ (effector cells) and CD45RA− (effector memory cells). CD45RA+CCR7+ (naive) and CD45RA−CCR7+ (central memory) cells repre-sented smaller populations in the bone marrow. Altogether, these results document that bone marrow from MM and MGUS patients contains a CD8+T cell population that con-sists mainly of effector and effector memory cells.
We next analyzed the expression by EC of molecules potentially involved in the processing and presentation of antigens to CD8+ T cells. To this aim, freshly prepared BMMC were immunostained for EC markers along with HLA class I molecules, the co-stimulatory molecules CD40, CD80 and CD86, the inducible co-stimulator ligand (ICOSL), and the lymphocyte function-associated antigen 3 (LFA-3). Flow cytometric analysis revealed that the majority of EC expressed HLA class I antigens (92.40% ± 6.09% in MGUS, 91.27% ± 5.40% in MM;Figure 2A) and that the positive cells in MGUS and MM samples had similar expression levels of these antigens (6.08% ± 4.68% in MGUS, 6.56% ± 4.65% in MM) (Figure 2B). Regarding ICOSL, both the mean percen-tage of positive cells and the expression levels were signifi-cantly higher in MM than in MGUS samples (P = 0.0344 and P = 0.0245) (Figure 2A-B). Cells expressing LFA-3 were abundant in both MGUS (83.15% ± 15.16%) and MM (91.21% ± 8.78%) samples, but LFA-3 expression levels were significantly higher in MM samples (4.13% ± 2.61% in MGUS and 6.22% ± 2.45% in MM,P = 0.0322) (Figure 2A,B). Low percentages of cells were positive for the co-stimulatory mole-cules, with similar levels between groups for CD40 and CD80 but a significantly higher percentage of CD86-positive cells in MM samples (Figure 2C); a similar pattern emerged for the expression levels of the co-stimulatory molecules in the posi-tive cells (Figure 2D). These results demonstrate that ex vivo EC have a phenotype of semi-professional APC, given that they express low levels of costimulatory molecules.
With a view to performing functional assays requiring higher number of cells, expression of these molecules was also analyzed on EC grown in vitro to understand whether and how these cells differ from theirex vivo counterpart. To this aim, immunostaining and flow cytometry were performed on EC that had been immunomagnetically purified from 3-week-old adherent BMMC cultures and expanded for four passages. Cells were cultured in the absence or presence of two cytokines relevant for MM progression, namely IL-6 and VEGF. In cells cultured without cytokines, the percentages and expression levels of positive cells for ICOSL, LFA-3, CD80, CD86, and CD40 appeared to be substantially reduced compared with those observed ex vivo, for both MGUS and MM, while for HLA class I there did not seem to be any change (Figure 2G–L). The addition of IL-6 or VEGF increased levels of all investigated molecules, but only the combined stimulation by the two cytokines was able to restore
the same pattern of expression foundex vivo for all molecules. Overall these results demonstrate that the semi-professional phenotype of EC can be preserved after in vitro expansion with IL-6 and VEGF.
We also examined levels of standard proteasome and immunoproteasome subunits in EC from the two study groups. Freshly prepared BMMC were immunostained for surface EC markers and intracellularly stained for proteasome subunits. Flow cytometric analysis of protein levels, expressed in MESF (molecular equivalents of soluble fluorochrome) units, revealed that the standard proteasome subunits delta and zeta were lower in MM than in MGUS samples (P = 0.0337 and P = 0.0208, respectively), with no significant difference for MB1. In contrast, the immunoproteasome sub-units LMP2 (P = 0.0499), LMP7 and LMP10 were higher in MM than MGUS samples (Figure 3A). Expression levels of proteasome subunits were then used to calculate ratios between the immunoproteasome and standard proteasome subunits; this was done for each patient and averaged for each group. The three ratios, namely LMP2/delta, LMP7/ MB1, and LMP10/zeta, were all higher in EC from MM than MGUS patients (Figure 3C). Overall these findings indi-cate that EC from MM patients are similar to immature DC as regards their subunit proteasome profile.
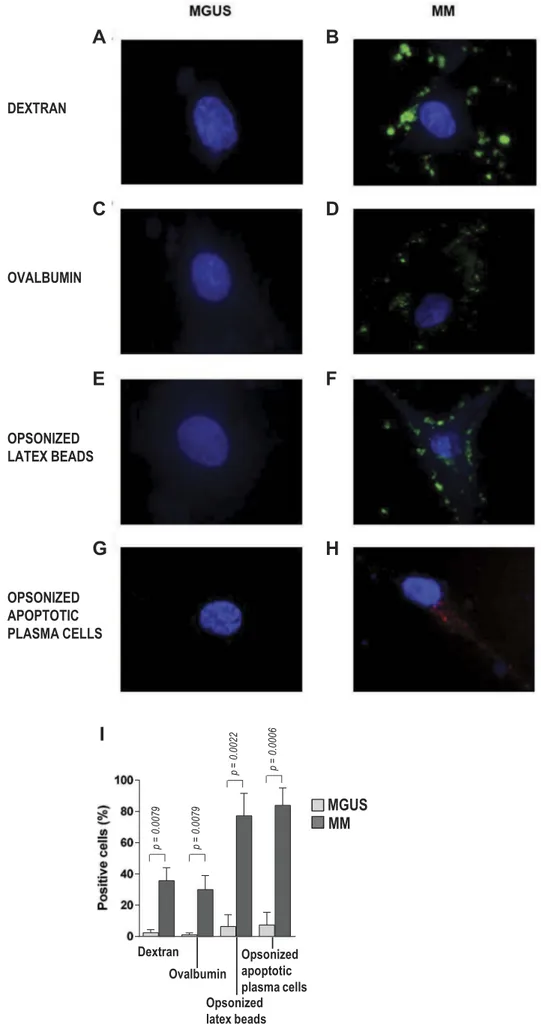
We next assessed the ability of EC from MGUS and MM patients to internalize foreign particles in a phagocytosis assay. To this aim, purified, expanded EC were incubated with fluorescently labeled targets, including dextran, ovalbu-min, opsonized latex beads, and opsonized, apoptotic, PKH26-labeled plasma cells (Figure 4). Fluorescence micro-scopy and flow cytometry revealed that EC from MGUS patients were poorly efficient in engulfing the foreign parti-cles, whereas EC from MM patients showed strong phagocytic activities, especially towards opsonized latex beads and opso-nized apoptotic plasma cells (P = 0.0022 and P = 0.0006; MM vs MGUS). Phagocytosis was negligible in control samples incubated on ice (data not shown). These results indicate that bone marrow EC from MM (but not MGUS) patients have phagocytic capacity similar to that of immature DC, and suggest a link between the bone marrow microenvironment during myeloma progression and regulation of the phagocy-tosis process in EC.
We then analyzed the ability of bone marrow EC to present their phagocytized tumor plasma cell antigens to CD8+T cells by measuring EC-induced cytokine production by CD8+ T cells. To this aim, in vitro-expanded bone marrow EC from MM patients were cultured with autologous bone marrow CD8+T cells in the presence of autologous opsonized apop-totic plasma cells. After 6 days, flow cytometry revealed that the percentage of IFN-γ+ T cells was negligible (3.71% ± 1.34%), while those of IL-10+ and TGF-β+ cells averaged above 25% (Figure 5A,B). Similar results emerged from the count of spot-forming units (Figure 5C). No cyto-kine production was observed when EC and CD8+ T cells were cultured without opsonized apoptotic plasma cells (data not shown). To determine whether the observed CD8+T cell cytokine profile depended on EC, the experiment was repeated replacing EC with autologous DC. This time an opposite cytokine pattern was observed, where the frequency
of IFN-γ-producing cells (67.34% ± 22.46%) was significantly (P = 0.0002) higher than that of IL-10-producing (3.20% ± 1.41%) or TGF-β-producing (0.70% ± 0.28%) cells (Figure 5D–F). These findings indicate that inhibitory
cytokines are produced by CD8+ T cells when they are exposed to EC.
To determine if the EC-induced and DC-induced cytokine production profiles identified two distinct subsets of bone Figure 2.Surface phenotype of bone marrow EC. (A,C) Percentages and (B,D) expression levels in positive cells reported in units of MESF. Mann-Whitney test. P-values are shown only for statistically significant comparisons. (E-F) Representative overlay plots show isotype control (white) and the expression of the indicated molecule (light gray) in (E) MGUS and (F) MM patients. (G,I) Percentages and (H,L) expression levels in positive cells reported in units of MESF of in vitro-expanded EC upon stimulation with IL-6, VEGF or both. Wilcoxon signed rank test.
marrow CD8+T cells (or two different cytokine responses by the same CD8+T cells), we investigated their phenotypes in terms of memory and regulatory markers. IL-10- and TGF-β-producing CD8+ T cells were Foxp3+ and CD45RA−CCR7+ (Figure 6A), whereas IFN-γ-producing CD8+ T cells were Foxp3− and CD45RA−CCR7− (Figure 6B). Comparison of cultures containing only CD8+ T cells and autologous EC with those containing CD8+T cells, autologous EC and auto-logous opsonized apoptotic plasma cells (oaPC) showed that the percentages of CD8+IL-10+CD45RA−CCR7+ and of CD8+IL-10+Foxp3+ cells were significantly lower (P = 0.023, P = 0.039, respectively) in the first (Figure 6C,D). These results suggest that EC support the proliferation of the above-described CD8+ T cell subsets. This ability was con-firmed in a T cell proliferation assay that measured the incor-poration of EdU, a thymidine analog, into DNA of CD8+T cells cultured for 6 days with in vitro-expanded autologous bone marrow EC (Figure 6E,F). This assay showed that the CD8+T cell growth response was significantly greater in the presence than in the absence of autologous oaPC (P = 0.0286). Overall, these findings indicate that two tumor antigen-experienced CD8+ T cell populations harbor in the bone marrow of MM patients: one central memory population that produces IL-10 and TGF-β, and one effector memory population that produces IFN-γ. Whereas the first one is stimulated by EC, the second one is stimulated by DC. To confirm, at the epitope level, the observed capacity of EC to sustain a central memory population producing IL-10 and TGF-β, we cultured EC from selected HLA-A*0201-positive MM patients with autologous CD8+T cells in the presence of an established myeloma-associated HLA-A*0201-restricted antigen, namely the NY-ESO-1157–165 peptide. After 6 days,
we harvested CD8+ T cells and expanded them with
polyclonal stimulus (anti-biotin particles preloaded with bio-tinylated CD2, CD3 and CD28 antibodies). Flow cytometry of the resulting NY-ESO-1157–165–specific CD8+ T cell
popula-tion revealed that the majority of these cells stained positively for intracellular IL-10, TGF-β, and Foxp3 and were CD45RA−CCR7+(Figure 6G), in agreement with the previous experiments. Cytokine production was inhibited by blocking the HLA class I molecules with a specific mAb (data not shown), indicating the HLA class I-restricted nature of the antigen presentation by EC.
We also examined the capacity of EC to promote the proliferation of NY-ESO-1-specific CD8+ T cells. To this aim, in vitro-expanded bone marrow EC were cultured with autologous bone marrow CD8+ T cells in the absence or presence of NY-ESO-1157–165 peptide or control peptides
(influenza matrix58-66 and HIV-1 gag p1776-84), and T cell
proliferation was assayed after 6 days. The CD8+ T cell response to EC stimulated with the tumor peptide
NY-ESO-1157–165 was significantly higher than controls (P = 0.0286)
(Figure 6H,I), indicating that EC are able to expand tumor-specific CD8+T cells (NY-ESO-1157–165peptide-specific CD8+
T cells).
Finally, we tested the ability of the central memory CD8+T cells expressing Foxp3 and producing IL-10 and TGF-β to suppress effector memory CD8+ T cells producing IFN-γ. To this aim, DC were cultured with autologous CD8+T cells alone (control) or with EC-exposed autologous CD8+T cells in the presence or absence of autologous oaPC. After 6 days, the T cell proliferation assay showed that EC-exposed CD8+T cells had little effect on T cell growth when oaPC were lacking, while they displayed a marked suppressive function when stimulated by oaPC. The addition of neutralizing anti-IL-10 mAb, but not of the corresponding isotype control, abrogated suppression Figure 3.Proteasome components in bone marrow EC. (A) Graphs show expression levels in positive cells reported in units of MESF in MGUS (light gray) and MM (dark gray) patients. Mann-Whitney test. (B) Representative dot plots gated on EC according toFigure 1. The percentage of EC from MGUS and MM patients expressing delta and LMP2 are depicted. (C) Graphs show immunoproteasome/standard proteasome subunit MESF ratios in MGUS and MM patients. Mann-Whitney test.
Figure 4.Phagocytosis by bone marrow EC. (A-H) Representative photomicrographs of EC from MGUS patients (left panels) and MM patients (right panels) that have engulfed,in vitro, green fluorescent dextran, green fluorescent ovalbumin, green fluorescent latex beads, or opsonized red fluorescent fragments of apoptotic plasma cells. (I) Quantification of phagocytotic cells, expressed as the percentage of fluorescent live cells. Mann-Whitney test.
(Figure 6J). These results strongly support the idea that EC-exposed CD8+T cells function as regulatory cells that require specific antigen for their activation, but once activated they act in an antigen-nonspecific manner via IL-10.
Discussion
Although it is well established that EC are crucial for survival and growth of tumor plasma cells and that bone marrow angiogenesis is a recognized hallmark of the MGUS-to-MM progression,15,16 there was no evidence so far that EC could directly activate plasma cell tumor-specific CD8+T cells. Our study provides this evidence, demonstrating that primary EC have the phenotypic signature and molecular machinery for trapping, processing and presenting tumor plasma cell-derived antigens on HLA class I molecules. This in turn leads to the stimulation of a subset of central memory CD8+
T cells with a strong capacity to suppress the proliferation of effector memory CD8+T cells. Altogether, the process allows MM to escape antitumor T cell responses.
Our study confirms and extends previous observations from our group and others that the clinical progression of MGUS to MM is not caused by the deletion of antitumor CD8+ T cells from the tumor bed, because these cells can be expanded in vitro if properly activated by pAPC.2-5 Moreover, and more importantly, our study provides evi-dence for a novel mechanism to explain why antitumor CD8+ T cells fail in vivo to eradicate tumor plasma cells, adding a new entry to the list of immune surveillance-evasion strategies. Indeed, we found that two distinct but interdependent CD8+T cell populations coexist in the bone marrow of MM patients: the first population is stimulated by pAPC (such as DC), produces IFN-γ, and exerts anti-tumor activity; the second is stimulated by EC in an Figure 5.Cytokine production by bone marrow CD8+T cells from MM patients. CD8+T cells were stimulated by autologous EC (A-C) or DC (D-F) in the presence of autologous opsonized apoptotic plasma cells. (A,D) Representative flow cytometric plots. (B,E) Percentages of IFN-γ-, IL-10- and TGF-β-producing CD8+T cells. (C,F)
antigen-specific fashion, produces IL-10 and TGF-β, and exerts pro-tumor activity by negatively regulating the activ-ity of the first population.
Bone marrow microvessel density has emerged as an inde-pendent prognosis factor in MM.17Because we found that the number of EC, their skewing towards an immunoproteasome Figure 6.Phenotype, proliferation and suppressor activity of EC-exposed CD8+T cells (from 4 MM patients). (A) Representative flow cytometry plots showing the
regulatory (IL-10+Foxp3+, TGF-β+Foxp3+) and central memory (CD45RA−CCR7+) phenotypes of CD8+ T cells stimulated by autologous EC in the presence of autologous opsonized apoptotic plasma cells (oaPC). (B) Representative plots showing the effector memory (IFN-γ+CD45RA−CCR7−) phenotype of CD8+ T cells
stimulated by autologous DC in the presence of oaPC. Percentages of (C) CD8+IL-10+CD45RA−CCR7+ and (D) CD8+IL-10+Foxp3+T cells after stimulation with autologous EC without or with oaPC; Wilcoxon signed-rank test. (E-F) Representative plots and percentages of CD8+T cells that proliferated upon stimulation with
autologous EC and oaPC. Mann-Whitney test. (G) Representative plots showing the regulatory (IL-10+Foxp3+, TGF-β+Foxp3+) and central memory (CD45RA−CCR7+) phenotypes ofin vitro-expanded, HLA-A2 NY-ESO-1157–165peptide-specific bone marrow CD8+T cells upon incubation with autologous bone marrow EC. (H-I)
Representative plots and percentages of CD8+T cells that proliferated upon stimulation with autologous EC, alone or in the presence of NY-ESO-1157–165, influenza matrix58-66or HIV-1 gag p1776–84peptide; Mann-Whitney test. (J) Four independent experiments showing that EC-exposed CD8+T cells (EC-expCD8) suppress tumor
plasma cell-specific CD8+T cell proliferation by autologous DC only when stimulated with oaPC but not when left unstimulated. In some wells, anti-IL-10 mAb or isotype control was added. E indicates effector cells; N, naïve cells; Em, effector memory cells; and Cm, central memory cells.
assembly (profile), and their ability to trap exogenous antigens are higher in MM than in MGUS patients, it is likely that the EC-mediated expansion of regulatory CD8+T cells increases during the transition from MGUS to MM and that new vessel formation in bone marrow parallels MM evasion from T cell immune surveillance.
Some interesting speculations can be formulated from our findings. The biology of the exogenous antigen acquisition process by EC is not fully elucidated, but it seems to be enhanced by some form of apoptotic cell opsonization. This process may be antibody-dependent, as seen here. It may also be lactadherin-dependent, as already demonstrated for the phagocytosis of aged erythrocytes and apoptotic melanoma cells by angiogenic EC of tumor-bearing mice18 and for the phagocytosis of acute promyelocytic leukemia cells by macro-phages and EC.19
Either way, EC are considered non-professional phagocytes that can become capable of phagocytosis following adhesion to matrix or under the influence of cytokines. In particular, angiogenesis promotes EC to express on their surface theαv
-integrins that facilitate the growth and survival of nascent vessels and at the same time favors the phagocytic ability of EC.20The type I and II IFN released in the microenvironment during pathological circumstances enhances the expression of the phagocytic receptor Fcγ.21,22It is also possible that some of the phagocytic EC are actually EC-like macrophages, i.e. macrophages that have acquired EC markers and formed capillary-like structures under the influence of MM plasma cell-derived cytokines.23
Once exogenous antigens are acquired by EC, these anti-gens may follow two different pathways for degradation and peptide loading on HLA class I molecules: a cytosolic pathway (TAP-dependent and proteasome-dependent)24-28or a vacuo-lar pathway (TAP- and proteasome-independent).29 Regardless of the specific pathway, the consequence of this cross-presentation is induction of tumor plasma cell-specific CD8+ T cells.30 These are central memory T cells that are regulatory because of the incomplete or weak signal received by EC, suggesting a role of EC as semi-professional APC. Additional studies are required to understand the molecular mechanisms responsible for the induction of this regulatory CD8+T cell subset within bone marrow of MM patients.
Many studies have characterized the antigen presentation function of EC with a preferential activation of memory CD8+ T cells (reviewed in13). It is consistent with differences in the anatomic location of antigen recognition by naïve and mem-ory T cells and with the observations that memmem-ory CD8+T cells need less stringent signals for their activation. Moreover, studies in mice have demonstrated that EC can activate and induce the generation of CD4+ regulatory T cells in a way dependent on programmed death-1 and IL-10.31,32
In conclusion, our study defines a new role that EC play in the creation of an immune-suppressive tumor microenvironment within bone marrow. We provide evidence that bone marrow EC act as APC and cause harmful effects on anti-tumor T cell responses by sustaining a central memory CD8+T cell popula-tion with regulatory funcpopula-tion. This evidence suggests that cellu-lar and molecucellu-lar events traditionally considered to pertain to
either angiogenesis or immunosuppressive mechanisms are mutually dependent in a tumor setting. In other words, the same cell population can simultaneously promote angiogenesis and mediate immunosuppression. This knowledge has implica-tions for the design of new strategies to treat MM and may in part explain therapeutic failures, as the field has conventionally targeted only one of these mechanisms. Our study encourages testing the combination of conventional cancer immunothera-pies with vascular-targeting treatments.
Materials and methods
Study subjects and biological samples
The aim of this study was to understand the immunological role that EC play in tumor-specific CD8+ T cell responses during the MGUS-to-MM progression. Paired peripheral blood and bone marrow samples were obtained from 40 patients with newly diagnosed monoclonal gammopathies. Patients were classified as having MGUS (n = 20) or sympto-matic MM (n = 20) according to the International Myeloma Working Group criteria.33 Sampling of bone marrow con-sisted of aspiration followed by biopsy of the posterior iliac crest. Clinical laboratory testing included HLA typing for all patients. The study protocol was approved by the University of Bari Medical School Ethics Committee and conformed to the good clinical practice guidelines of the Italian Ministry of Health. Written informed consent was obtained from each subject in accordance with the Declaration of Helsinki.
Tissue and cell preparations
Bone marrow tissue was fixed, decalcified, and routinely pro-cessed into 4-µm sections. Peripheral blood and bone marrow mononuclear cells (PBMC and BMMC, respectively) were isolated by Ficoll-Paque Plus (GE Healthcare Life Sciences) density gradient centrifugation. CD8+ T cells, dendritic cells (DC), and tumor plasma cells were purified from BMMC or PBMC by automated magnetic sorting using, respectively, anti-CD8 microbeads, Blood Dendritic Cell Isolation Kit II, and anti-CD138 microbeads (Miltenyi Biotec). EC were iso-lated by automated magnetic cell sorting with anti-CD31 microbeads (Miltenyi Biotec) from adherent BMMC that had been cultured for 3 weeks in Dulbecco’s Modified Eagle Medium (DMEM) supplemented with 10% FBS, 2 mM L-glutamine, 100 U/mL penicillin, and 100μg/mL streptomy-cin (all from Sigma-Aldrich). All sorted cell populations exhibited >95% purity as revealed by flow cytometry on immunostained cells. Purified EC were grown and expanded for four passages in fibronectin-coated culture dishes (BD Falcon) in endothelial basal medium (EBM-2, Lonza) contain-ing 5% FBS with or without 25 ng/mL rIL-6 (R&D Systems) and/or 10 ng/mL VEGF (Miltenyi Biotec).
Tumor plasma cells from patients were opsonized by incu-bation with anti-syndecan-1 mAb (1 µg/mL; Serotec) for 30 minutes at 4°C and then made apoptotic by five freeze-thaw cycles. Total cell disruption was confirmed with trypan blue staining.
Immunostaining and labeling of tissues and cells
Bone marrow sections were double stained for CD8 and CD34 using commercial monoclonal antibodies (mAb) (Supplementary Table 1) and an enzymatic double-staining immunohistochemistry kit (Dako). Cells were stained for sur-face and intracellular molecules as described previously4using both commercial mAb (Supplementary Table 1) and non-commercial mAb provided by S. Ferrone (Boston, USA). These non-commercial mAb were directed against protea-some subunits delta, MB1 and zeta (mAb SY-5, SJJ-3 and NB1, respectively) and immunoproteasome subunits LMP2, LMP7 and LMP10 (mAb SY-1, HB2 and TO-7, respectively). These mAb, whose production and characterization have already been reported,34were labeled with FITC and used as described previously.5For EC identification, we chose the EC markers CD105 and CD309 because CD105 is upregulated in actively proliferating EC, CD309 is essential for the functions of vascular EC, and both are associated with tumor neoangiogenesis.35-39 NY-ESO-1157–165 HLA-A*0201
PE-con-jugated pentamer was purchased from Proimmune and used according to the vendor’s instructions.
Microscopy and flow cytometry
Stained bone marrow sections were analyzed with a Zeiss Axioskop 40 microscope equipped with a Zeiss AxioCam MRc digital camera. Fluorescent stained cells were directly visualized under a Nikon TE2000 inverted microscope with an epifluorescence source, or they were analyzed on an FC500 flow cytometer using CXP software (Beckman Coulter) or FlowJo software. Protein expression levels were defined as the percentage of cells staining positively on flow cytometry and were also quantified in units of molecular equivalents of soluble fluorochrome (MESF)5,40 in order to reduce signifi-cantly inter-test variability. For cells stained with pentamers, the level of nonspecific binding was calculated from the back-ground signal observed in cells from four HLA-A*0201-nega-tive patients. In particular, the cutoff for pentamer-posiHLA-A*0201-nega-tive signals was set as the average background signal plus 3 SD.
Phagocytosis assay
Labeled targets for phagocytosis included FITC-labeled oval-bumin (Thermo Fisher Scientific, cat. no. O23020), FITC-labeled dextran (Thermo Fisher Scientific, cat. no. D1821), and FITC-labeled rabbit-IgG-opsonized latex beads (Cayman Chemical, cat. no. 400291). Additionally, labeled targets were prepared from tumor plasma cells, by staining with the PKH26 (red) lipophilic dye mini kit (Sigma-Aldrich, cat. no. 089K0781), followed by opsonization and making them apoptotic.
For the phagocytosis assay, 5 × 10⁴ immunomagnetically purified EC (expanded in the presence of IL-6 and VEGF for four passages) were incubated at 37°C with: 1 mg/mL FITC-labeled dextran (1 hour); 1 mg/mL FITC-labeled oval-bumin (1 hour); 100 μl/mL FITC-labeled opsonized latex beads (20 hours); or 5 × 10⁴ opsonized, apoptotic, PKH26-labeled plasma cells (20 hours). Negative control
incubations were done on ice. All incubations were done in 500μL EBM-2 containing IL-6 and VEGF in chambered cell culture slides (BD Falcon). After incubation, EC were washed twice with PBS + 0.5% FBS and incubated with 0.1 mg/mL 4,6 diamidino-2-phenylindole (DAPI; Sigma-Aldrich) for 10 min at room temperature. The uptake of labeled targets was visualized by fluorescence microscopy and quantified by flow cytometry, with phagocytotic cells being expressed as the percentage of live cells that were fluorescent.
Antigen presentation assays
Antigen-presenting cells consisted of EC or DC exposed to antibody-coated apoptotic plasma cells or to synthetic pep-tide. Antigen presentation assays were performed by slightly modifying a previously described protocol.4 Briefly, 2–5 × 10⁴/well EC or DC were cultured with 5–12.5 × 10⁴/ well autologous CD8+ T cells (EC/DC:CD8+ T cell ratio of 1:2.5) and, when antigen loading was required, also with one of the following: 2–5 × 10⁴/well opsonized autologous apop-totic tumor plasma cells (EC/DC:138-cell ratio of 1:1); 10 µg/ mL influenza A matrix protein (MP) peptide MP58-66
(Proimmune); 10 µg/mL HIV gag p1776-84 peptide
(Proimmune); or 10 µg/mL NY-ESO-1157–165 peptide
(Proimmune). These assays were done in 200μL TexMACS medium (Miltenyi Biotec) containing 10% FBS in 96-well round-bottom plates. Cells were grown at 37°C in a humidi-fied atmosphere containing 5% CO2.In some wells, the
HLA-ABC–specific mAb TP25.99.8.425 was added at 10 µg/mL. After 6 days, cytokine production by CD8+T cells was ana-lyzed by immunofluorescence staining and flow cytometry, or the cells were tested in T cell proliferation and ELISpot assays (IFN-γ ELISpot kit, IL-10 ELISpot kit, and TGF-β ELISpot kit, all from R&D Systems).
T cell proliferation assay
CD8+T cells were cultured for 6 days without or with auto-logous EC as described in the antigen presentation assay. In the last 18 hours, 5-ethynyl-2’-deoxyuridine (EdU, Life Technologies) was added to a final concentration of 2.5 µM to label newly synthesized DNA. Then, cells were harvested, washed in PBS containing 1% BSA, stained with FITC-con-jugated anti-CD8 mAb, fixed with Click-iT fixative (Life Technologies), and permeabilized with Click-iT saponin-based permeabilization buffer (Life Technologies). Staining of EdU-containing DNA was performed with a Click-iT Plus EdU Alexa Fluor 647 Flow Cytometry Assay Kit (Life Technologies).
Generation of EC-exposed antigen-specific CD8+T cells
CD8+T cells were cultured and expanded with autologous EC and the NY-ESO-1157–165peptide, as described in the antigen
presentation assay. After 6 days, CD8+T cells were harvested and stimulated with anti-biotin MACSiBead particles loaded with biotinylated anti-CD2/CD3/CD28 antibodies (Miltenyi Biotec; bead-to-cell ratio, 1∶2) in 200 μL TexMACS medium
supplemented with 10% FBS, 100 U/mL penicillin, and 100 μg/mL streptomycin in 96-well round-bottom plates. Cells were incubated at 37°C in a humidified atmosphere contain-ing 5% CO2. The medium was replaced with fresh culture
medium containing 20 U/mL rIL-2 (Miltenyi Biotec) on days 4, 7, 11, and 14; on day 7, the fresh culture medium also contained 10 ng/mL rIL-7 (Miltenyi Biotec). Cultures were restimulated on day 7. On day 14, cells were harvested and analyzed by flow cytometry for phenotype and cytokine production.
Suppression assay
DC purified from peripheral blood mononuclear cells (PBMC) of MM patients (5 × 10⁴/well) were cultured with autologous purified CD8+T cells (5 × 10⁵/well; T/DC cell ratio, 10:1) alone or with autologous EC-exposed CD8+T cells, with or without opsonized apoptotic plasma cells (5 × 10⁴/well). In some wells, neutralizing anti-IL-10 antibody (JES3-9D7, eBioscience) or iso-type control antibody was added at the beginning of the assay. Cells were grown at 37°C in 200μL RPMI 1640 supplemented with 10% FBS, 2 mM L-glutamine, 100 U/mL penicillin, and 100 μg/mL streptomycin in 96-well round-bottom plates for 6 days. In the last 18 hours, EdU was added and cells were processed as described in the T cell proliferation assay. Data were expressed as the percentage of inhibition of T cell proliferation compared with that observed with only DC and autologous CD8+T cells.
Statistical analysis
Statistical analyses were performed using Prism (GraphPad Software). Nonparametric statistics were preferred because much of the data was not normally distributed. Tests included the Mann-Whitney test and Kruskal-Wallis test for compar-isons of groups, and the Wilcoxon signed rank test for com-parison of matched samples. P-values are shown only for statistically significant comparisons. A value ofP < 0.05 was taken to indicate significance.
Acknowledgments
The authors are grateful to Dr. Soldano Ferrone (Department of Surgery, Massachusetts General Hospital, Harvard Medical School, Boston, USA) for generously providing mAb against proteasome subunits. Valerie Matarese provided scientific editing on a late draft.
Disclosure statement
The authors have no financial conflict of interest.
Funding
This work was supported by the Associazione Italiana per la Ricerca sul Cancro (AIRC) through an Investigator Grant (no. 20441 to VR) and by Fondo di Sviluppo e Coesione 2007–2013 – APQ Ricerca Regione Puglia “Programma regionale a sostegno della specializzazione intelligente e della sostenibilità sociale ed ambientale - FutureInResearch”. The spon-sors of this study are public or nonprofit organizations that support science in general; they had no role in gathering, analyzing, or interpret-ing the data.
Author contributions
P.L. and V.R. conceived and designed the study. A.V. contributed to study design. G.D.L., A.S., S.C., I.S., A.L., R.R., M.A.F., M.P., and P.D. were involved in the collection, analyses and interpretation of the data. P. L. and V.R. wrote the manuscript. F.D. and A.V. contributed to the interpretation of the results and revised the manuscript. All authors reviewed the report, approved the draft submission, and agreed to be accountable for all aspects of this study.
ORCID
Patrizia Leone http://orcid.org/0000-0002-0904-1074
Vito Racanelli http://orcid.org/0000-0002-8639-1940
References
1. Kyle RA, Rajkumar SV.2008. Multiple myeloma. Blood 111:2962– 2972. doi:10.1182/blood-2007-10-078022.
2. Dhodapkar MV, Krasovsky J, Olson K. 2002. T cells from the tumor microenvironment of patients with progressive myeloma can generate strong, tumor-specific cytolytic responses to auto-logous, tumor-loaded dendritic cells. Proc Natl Acad Sci U S A 99:13009–13013. doi:10.1073/pnas.202491499.
3. Dhodapkar MV, Krasovsky J, Osman K, Geller MD. 2003. Vigorous premalignancy-specific effector T cell response in the bone marrow of patients with monoclonal gammopathy. J Exp Med 198:1753–1757. doi:10.1084/jem.20031030.
4. Leone P, Berardi S, Frassanito MA, Ria R, De Re V, Cicco S, Battaglia S, Ditonno P, Dammacco F, Vacca A, et al. 2015. Dendritic cells accumulate in the bone marrow of myeloma patients where they protect tumor plasma cells from CD8+ T-cell killing. Blood 126:1443–1451. doi: 10.1182/blood-2015-01-623975.
5. Racanelli V, Leone P, Frassanito MA, Brunetti C, Perosa F, Ferrone S, Dammacco F.2010. Alterations in the antigen proces-sing-presenting machinery of transformed plasma cells are asso-ciated with reduced recognition by CD8+ T cells and characterize the progression of MGUS to multiple myeloma. Blood 115:1185– 1193. doi:10.1182/blood-2009-06-228676.
6. Di Rosa F, Gebhardt T. 2016. Bone marrow T cells and the integrated functions of recirculating and tissue-resident memory T cells. Front Immunol 7:51. doi:10.3389/fimmu.2016.00051. 7. Mazo IB, Honczarenko M, Leung H, Cavanagh LL, Bonasio R,
Weninger W, Engelke K, Xia L, McEver RP, Koni PA, et al.2005. Bone marrow is a major reservoir and site of recruitment for central memory CD8+ T cells. Immunity 22:259–270. doi:10.1016/j.immuni.2005.01.008.
8. Lichtman A. Endothelial antigen presentation. In: Wc A, editor. Endothelial biomedicine. New York: Cambridge University Press;
2007. p. 1098–1107.
9. Bagai R, Valujskikh A, Canaday DH, Bailey E, Lalli PN, Harding CV, Heeger PS.2005. Mouse endothelial cells cross-present lym-phocyte-derived antigen on class I MHC via a TAP1- and protea-some-dependent pathway. J Immunol 174:7711–7715. doi:10.4049/jimmunol.174.12.7711.
10. Epperson DE, Pober JS. 1994. Antigen-presenting function of human endothelial cells. Direct activation of resting CD8 T cells. J Immunol 153:5402–5412.
11. Hochst B, Schildberg FA, Bottcher J, Metzger C, Huss S, Turler A, Overhaus M, Knoblich A, Schneider B, Pantelis D, et al.2012. Liver sinusoidal endothelial cells contribute to CD8 T cell toler-ance toward circulating carcinoembryonic antigen in mice. Hepatology 56:1924–1933. doi:10.1002/hep.25844.
12. Limmer A, Ohl J, Kurts C, Ljunggren HG, Reiss Y, Groettrup M, Momburg F, Arnold B, Knolle PA.2000. Efficient presentation of exogenous antigen by liver endothelial cells to CD8+ T cells results in antigen-specific T-cell tolerance. Nat Med 6:1348– 1354. doi:10.1038/82161.
13. Razakandrainibe R, Pelleau S, Grau GE, Jambou R.2012. Antigen presentation by endothelial cells: what role in the pathophysiology of malaria? Trends Parasitol 28:151–160. doi:10.1016/j. pt.2012.01.004.
14. Wheway J, Obeid S, Couraud PO, Combes V, Grau GE.2013. The brain microvascular endothelium supports T cell proliferation and has potential for alloantigen presentation. PLoS One 8:e52586. doi:10.1371/journal.pone.0052586.
15. Kawano Y, Moschetta M, Manier S, Glavey S, Gorgun GT, Roccaro AM, Anderson KC, Ghobrial IM. 2015. Targeting the bone marrow microenvironment in multiple myeloma. Immunol Rev 263:160–172. doi:10.1111/imr.12233.
16. Ribatti D, Nico B, Vacca A.2015. Multiple myeloma as a model for the role of bone marrow niches in the control of angiogenesis. Int Rev Cell Mol Biol 314:259–282.
17. Giuliani N, Storti P, Bolzoni M, Palma BD, Bonomini S. 2011. Angiogenesis and multiple myeloma. Cancer Microenviron 4:325– 337. doi:10.1007/s12307-011-0072-9.
18. Fens MH, Mastrobattista E, de Graaff AM, Flesch FM, Ultee A, Rasmussen JT, Molema G, Storm G, Schiffelers RM. 2008. Angiogenic endothelium shows lactadherin-dependent phagocy-tosis of aged erythrocytes and apoptotic cells. Blood 111:4542– 4550. doi:10.1182/blood-2007-06-094763.
19. Xie R, Gao C, Li W, Zhu J, Novakovic V, Wang J, Ma R, Zhou J, Gilbert GE, Shi J. 2012. Phagocytosis by macrophages and endothelial cells inhibits procoagulant and fibrinolytic activity of acute promyelocytic leukemia cells. Blood 119:2325–2334. doi:10.1182/blood-2011-06-362186.
20. Andersen MH, Graversen H, Fedosov SN, Petersen TE, Rasmussen JT.2000. Functional analyses of two cellular binding domains of bovine lactadherin. Biochemistry 39:6200–6206. doi:10.1021/bi992221r.
21. Li Y, Lee PY, Kellner ES, Paulus M, Switanek J, Xu Y, Zhuang H, Sobel ES, Segal MS, Satoh M, et al. 2010. Monocyte surface expression of Fcgamma receptor RI (CD64), a biomarker reflect-ing type-I interferon levels in systemic lupus erythematosus. Arthritis Res Ther 12:R90. doi:10.1186/ar3017.
22. Shi Y, Fan X, Deng H, Brezski RJ, Rycyzyn M, Jordan RE, Strohl WR, Zou Q, Zhang N, An Z.2015. Trastuzumab triggers phago-cytic killing of high HER2 cancer cells in vitro and in vivo by interaction with Fcgamma receptors on macrophages. J Immunol 194:4379–4386. doi:10.4049/jimmunol.1402891.
23. Scavelli C, Nico B, Cirulli T, Ria R, Di Pietro G, Mangieri D, Bacigalupo A, Mangialardi G, Coluccia AM, Caravita T, et al.
2008. Vasculogenic mimicry by bone marrow macrophages in patients with multiple myeloma. Oncogene 27:663–674. doi:10.1038/sj.onc.1210691.
24. Ackerman AL, Giodini A, Cresswell P. 2006. A role for the endoplasmic reticulum protein retrotranslocation machinery dur-ing crosspresentation by dendritic cells. Immunity 25:607–617. doi:10.1016/j.immuni.2006.08.017.
25. Kovacsovics-Bankowski M, Rock KL.1995. A phagosome-to-cyto-sol pathway for exogenous antigens presented on MHC class I molecules. Science 267:243–246. doi:10.1126/science.7809629. 26. Ackerman AL, Kyritsis C, Tampe R, Cresswell P. 2003. Early
phagosomes in dendritic cells form a cellular compartment suffi-cient for cross presentation of exogenous antigens. Proc Natl Acad Sci USA 100:12889–12894. doi:10.1073/pnas.1735556100. 27. Guermonprez P, Saveanu L, Kleijmeer M, Davoust J, Van Endert
P, Amigorena S. 2003. ER-phagosome fusion defines an MHC
class I cross-presentation compartment in dendritic cells. Nature 425:397–402. doi:10.1038/nature01911.
28. Houde M, Bertholet S, Gagnon E, Brunet S, Goyette G, Laplante A, Princiotta MF, Thibault P, Sacks D, Desjardins M. 2003. Phagosomes are competent organelles for antigen cross-presenta-tion. Nature 425:402–406. doi:10.1038/nature01912.
29. Campbell DJ, Serwold T, Shastri N.2000. Bacterial proteins can be processed by macrophages in a transporter associated with anti-gen processing-independent, cysteine protease-dependent manner for presentation by MHC class I molecules. J Immunol 164:168– 175. doi:10.4049/jimmunol.164.1.168.
30. Leone P, Shin EC, Perosa F, Vacca A, Dammacco F, Racanelli V.
2013. MHC class I antigen processing and presenting machinery: organization, function, and defects in tumor cells. J Natl Cancer Inst 105:1172–1187. doi:10.1093/jnci/djt184.
31. Bedke T, Pretsch L, Karakhanova S, Enk AH, Mahnke K.2010. Endothelial cells augment the suppressive function of CD4+ CD25+ Foxp3+ regulatory T cells: involvement of programmed death-1 and IL-10. J Immunol 184:5562–5570. doi:10.4049/ jimmunol.0902458.
32. Krupnick AS, Gelman AE, Barchet W, Richardson S, Kreisel FH, Turka LA, Colonna M, Patterson GA, Kreisel D. 2005. Murine vascular endothelium activates and induces the generation of allo-geneic CD4+25+Foxp3+ regulatory T cells. J Immunol 175:6265– 6270. doi:10.4049/jimmunol.175.10.6265.
33. International Myeloma Working G.2003. Criteria for the classi-fication of monoclonal gammopathies, multiple myeloma and related disorders: a report of the International Myeloma Working Group. Br J Haematol 121: 749–757. doi:10.1046/ j.1365-2141.2003.04355.x.
34. Bandoh N, Ogino T, Cho HS, Hur SY, Shen J, Wang X, Kato S, Miyokawa N, Harabuchi Y, Ferrone S. 2005. Development and characterization of human constitutive proteasome and immuno-proteasome subunit-specific monoclonal antibodies. Tissue Antigens 66:185–194. doi:10.1111/j.1399-0039.2005.00462.x. 35. Burrows FJ, Derbyshire EJ, Tazzari PL, Amlot P, Gazdar AF, King SW,
Letarte M, Vitetta ES, Thorpe PE.1995. Up-regulation of endoglin on vascular endothelial cells in human solid tumors: implications for diagnosis and therapy. Clin Cancer Res 1:1623–1634.
36. Miller DW, Graulich W, Karges B, Stahl S, Ernst M, Ramaswamy A, Sedlacek HH, Muller R, Adamkiewicz J.1999. Elevated expres-sion of endoglin, a component of the TGF-beta-receptor complex, correlates with proliferation of tumor endothelial cells. Int J Cancer 81:568–572. doi:10.1002/(SICI)1097-0215(19990517) 81:4<568::AID-IJC11>3.0.CO;2-X.
37. Nassiri F, Cusimano MD, Scheithauer BW, Rotondo F, Fazio A, Yousef GM, Syro LV, Kovacs K, Lloyd RV. 2011. Endoglin (CD105): a review of its role in angiogenesis and tumor diagnosis, progression and therapy. Anticancer Res 31:2283–2290.
38. Olsson AK, Dimberg A, Kreuger J, Claesson-Welsh L. 2006. VEGF receptor signalling - in control of vascular function. Nat Rev Mol Cell Biol 7:359–371. doi:10.1038/nrm1911.
39. Wikstrom P, Lissbrant IF, Stattin P, Egevad L, Bergh A. 2002. Endoglin (CD105) is expressed on immature blood vessels and is a marker for survival in prostate cancer. Prostate 51:268–275. doi:10.1002/pros.10083.
40. Mizrahi O, Ish Shalom E, Baniyash M, Klieger Y. 2018. Quantitative flow cytometry: concerns and recommendations in clinic and research. Cytometry B Clin Cytom 94:211–218. doi:10.1002/cyto.b.21515.