Full Terms & Conditions of access and use can be found at
https://www.tandfonline.com/action/journalInformation?journalCode=tjas20
Italian Journal of Animal Science
ISSN: (Print) 1828-051X (Online) Journal homepage: https://www.tandfonline.com/loi/tjas20
Genetic Relationships Among Five Zebu Breeds
Naturalized in America Accessed with Molecular
Markers
Axel Villalobos-Cortés, Amparo Martínez, Jose L. Vega-Pla, Vincenzo Landi,
Jorge Quiroz, Jose R. Marques & Juan V. Delgado
To cite this article:
Axel Villalobos-Cortés, Amparo Martínez, Jose L. Vega-Pla, Vincenzo Landi,
Jorge Quiroz, Jose R. Marques & Juan V. Delgado (2015) Genetic Relationships Among Five Zebu
Breeds Naturalized in America Accessed with Molecular Markers, Italian Journal of Animal Science,
14:2, 3280, DOI: 10.4081/ijas.2015.3280
To link to this article: https://doi.org/10.4081/ijas.2015.3280
©Copyright A. Villalobos-Cortés et al. Published online: 17 Feb 2016.
Submit your article to this journal Article views: 413
View related articles View Crossmark data
Genetic relationships among
five zebu breeds naturalized
in America accessed with
molecular markers
Axel Villalobos-Cortés,1
Amparo Martínez,2
Jose. L. Vega-Pla,3
Vincenzo Landi,2Jorge Quiroz,4
Jose R. Marques,5
Juan V. Delgado2 1
Laboratorio Agrobiotecnología, Instituto de Investigación Agropecuaria, Panama
2
Departamento de Genetica, Universidad de Cordoba, Spain
3
Laboratorio Cria Caballar, Fuerzas Armadas de España, Madrid, Spain
4
Campo Experimental Huimanguillo, Instituto Nacional de Investigaciones Forestales Agricolas y Pecuarias, Mexico City, Mexico
5
Embrapa Amazônia Oriental, Pará, Brazil
Abstract
This study aims to analyze the within-breed genetic diversity and determine the genetic relationships among the most important zebu populations introduced in the American conti-nent from Asia. Gyr (GYR), Red Sindhi (SIN), Nellore (NEL), Guzerat (GUZ) and the synthet-ic Brahman (BRH) breeds have been estab-lished especially in American tropical regions. Estimates of genetic structure and diversity were carried out within and among the five populations studied. The results of within-breed genetic diversity showed medium to high medium values of diversity in all genetic
parameters [observed heterozygosity
(Ho)=0.622±0.022; expected heterozygosity
(He)=0.662±0.023; number of alleles
(Na)=5.71±1.63; and allelic richness
(Ar)=4.097±0.958]. The lowest value of Ho was
observed in NEL (0.569±0.019) and the high-est in BRH (0.688±0.015). Lowhigh-est value of He
was also observed in NEL (0.612±0.024) and the highest in BRH (0.700±0.020). Gyr, GUZ and NEL showed high estimations of inbreed-ing, 9.98, 7.92 and 6.83% respectively. Values of Na varied between 4.93±1.52 in GUZ and
7.04±1.99 in BRH and the Ar values ranged
between 3.687±0.895 in NEL and 4.42±1.91 in SIN. On the other hand, although phenotypi-cally, the five breeds are clearly distinguish-able, the genetic analysis of structure and kin-ship demonstrates a total independence
among GYR, GUZ and NEL, while BRH and Red Sindhi show a closed relationship. These facts support that GYR, GUZ and NEL have had a diverse origin but also different models of introgression in America. Brahman and SIN could be explained by the intervention of the Sindhi ancestors in the formation of the American synthetic Brahma.
Introduction
The domestication of cattle, both Bos taurus and Bos indicus, from its precursor, aurochsen wild (Bos primgenius) was of great importance in the history of mankind, leading to extensive modifications, such as type of food, behaviour and socio-economic structure of many popula-tions from approximately 11,000 years ago (Clutton-Brock, 1999). Genetic divergence between Bos taurus and Bos indicus popula-tions suggest that there were two independent domestication processes in different geo-graphical areas and from two distinct groups of aurochsen (Bradley et al., 1998). In the partic-ular case of Bos indicus, archaeological evi-dence suggests that domestication probably occurred in the Indus Valley (now Pakistan), with a major proportion of these breeds in India and later secondary introduction in Africa (Beja-Pereira et al., 2006). Most part of the cattle Bos indicus imported into the United States, Mexico, and Brazil was composed of breeds that originated in India and to a lesser extent, in the region of Pakistan.
Guzerat (GUZ), Nelore (NEL) and Gyr (GYR) breeds have had the greatest influence in the United States, Mexico and Brazil cattle with Asiatic origin (Sanders, 1980). Until mid-1920, most Zebu in the United States were of the NEL type. Thus, these contributed greatly to the formation of the American Brahman (BRH), though some pure bulls were also used in the large BRH herds, after 1925. It is impor-tant to emphasize that the cattle from which the Gray Brahman descends, came from Brazil during the 1920 decade. The Grey Brahman is, unlike the GYR, GYR, Red Sindhi (SIN) and NEL, a synthetic breed, mix GUZ, NEL, with some influence from other Zebu breeds and some Europeans breeds (Sanders, 1980).
The basic approach in the zebu populations is its use in cross-breeding, where their contri-bution is the adaptation to the tropical climate; however, in some Latin American countries they are used as direct meet producers. They have also developed dairy fitness lines such as GYR dairy from Brazil (Ardila, 2010).
The introduction of cattle in America has
not followed a stable process for all breeds. Some of them, as shown by mitochondrial DNA (Ginja et al., 2010), were introduced through backcrossing on authoctonus breeds of European origin, that functioned as a mother base. In other cases, the introduction was car-ried out with small groups that subsequently spread, suffering the consequent bottleneck.
The autosomal microsatellites are molecular markers generally recommended to estimate within and among populations genetic diversi-ty, to investigate the relationships between among breeds and set conservation priorities (Lenstra et al., 2012). In addition to its own value in assessing the genetic diversity and the structure of domestic breeds, microsatel-lites are useful in the analysis of conservation, since this is expected to be linked with genes associated with important features, including the adaptation (Hall et al., 2012; Medugorac et al., 2011). The aim of this paper is to analyze the within-breed American Zebu genetic diver-sity accessed with microsatellite markers and identify the genetic relationships among popu-lations of GYR, BRH, SIN, GUZ and NEL, estab-lished in the American continent.
Materials and methods
A database of 1525 pairs of alleles of 113 available randomized samples of five Zebu breeds, GYR (23), BRH (36), SIN (11), GUZ (15) and NEL (28), was analyzed. The data-base was obtained from the sample bank BIOBOVIS consortium, established within the
Corresponding author: Dr. Axel Villalobos-Cortés, Laboratorio Agrobiotecnología, Instituto de Investigación Agropecuaria, Carretera Panamericana, km 214, Provincia de Herrera, Panama.
Tel. +507.9761265.
E-mail: [email protected] Key words: Zebu, Conservation; Biodiversity; Genetic structure; Molecular markers. Received for publication: 20 January 2014. Accepted for publication: 24 January 2015. This work is licensed under a Creative Commons Attribution NonCommercial 3.0 License (CC BY-NC 3.0).
©Copyright A. Villalobos-Cortés et al., 2015 Licensee PAGEPress, Italy
Italian Journal of Animal Science 2015; 14:3280 doi:10.4081/ijas.2015.3280
Network CONBIAND (http://www.uco.es/con-biand/Bienvenida.html) and deposited in the applied molecular genetics laboratory PAI AGR-218 group, of the University of Cordoba, Spain.
A panel of 27 microsatellite markers select-ed from the recommendations made by the
Food and Agriculture Organization/
International Society of Animal Genetics (FAO/ISAG) was used to conduct studies of the bovine genetic biodiversity (FAO, 2011). The analysis of the database was performed in the Bio-informatic Laboratory of Agro-biotechnolo-gy, Institute of Agricultural Research of Panama’s analysis unit. The estimates of the genetic diversity within breed were obtained by calculating the observed heterozygosity (Ho) and unbiased expected heterozygosity
(He), the average number of alleles (Na) per
breeds with the programme GENETIX 4.05.2 (Belkhir et al., 2003). The value of f by popula-tion (Weir and Cockerham, 1984) was calculat-ed by the programme Genepop v 4.2 (Raymond and Rousset, 1995) and the allelic richness (Ar) over all loci by breeds, it was calculated
with FSTAT v 2.9.3 (Goudet, 2001). The balance deviations of Hardy-Weinberg were evaluated by the Genalex 6.5 software (Peakall and Smouse, 2012) and Bonferroni sequential cor-rection was applied to obtain the critical value for multiple test on 27 pairs loci per population (Rice, 1989). A factorial correspondence analy-sis was performed by the program Genetix v. 4.02 (Belkhir et al., 2003). To determine the structure and genetics differentiation among populations, an analysis of molecular variance was performed (AMOVA), estimating the
com-ponents of variance among groups
(FST=sa+sb/st), by software ARLEQUIN 3.01
(Excoffier et al., 2005). The average number of migrants per population was also calculated (Nm) and statistical F of Wright (1965) and Weir and Cockerham (1984) using the pro-gramme GENETIX v. 4.02. Genetic distances were calculated (Reynolds et al., 1983) using
the programme POPULATIONS 1.2.28
(Langella, 2002). With the matrix obtained a distance tree was developed (NeighborNet) with the programme SPLITSTREE v 4.0 (Bryant and Moulton, 2004; Huson and Bryant, 2006).
The version 2.3.4 of the programme STRUC-TURE (Pritchard et al., 2000) was used to iden-tify the structure of the K population involved in this research.
Results and discussion
The results of within-breed diversity of zebu populations evaluated are shown in Table 1.
Medium to high values are observed in all
esti-mates (on average, Ho=0.622±0.022;
He=0.662±0.023; Na=5.71±1.63;
Ar=4.097±0.958), the lowest values of Ho were
observed in NEL (0.569±0.019) and the high-est in BRH (0.688±0.015). In a similar way, the lowest values of He were observed in NEL
(0.612±0.024) and the highest in BRH (0.700±0.020), the latter being considered as high (Ott, 1992). Values of high f were observed, in GYR, GUZ and NEL with 9.98, 7.92 and 6.83% respectively (P<0.05), when the maximum acceptable level of inbreeding with-in which there is no negative effect on the pro-duction capacity is 6.25% and the critical level is 12.5% (Parland et al., 2007). Higher values of f (16.42%) were found by Cervini et al. (2006) in NEL of various regions of Brazil. Egito et al. (2007) reported in Brazil f values of 10.61, 12.14 and 11.40% in NEL, GYR and GUZ, respectively. Chaudarhi et al. (2009) working with the Zebu breeds of India, Gaolao and Kenkatha reported 21.21% and 22.48% of f respectively.
Various factors have been associated with the increased value of f in populations, such as the levels of inbreeding, selection hitchhiking, presence of null alleles and the appearance of substructure or Wahlund effect (Nei, 1987; Sodhi et al., 2006). A medium value of Na of
5.71±0.15 was observed, varying between 4.93±1.52 in GUZ and 7.04±1.99 in BRH and the Ar varied little between breeds, ranging
3.687±0.895 in NEL and 4.42±1.91 in SIN, averaging 4.07±0.96. The values of Na are
sim-ilar to those found in other Zebu populations as reported by Mukeshet al. (2004) in India, with values of 5.2, 6.5 and 5.9 in the Sahiwal, Hariana and Deoni breeds, respectively. However, Chaudarhi et al. (2009) report Na of
9.52 and 7.92 in the Bos indicus Gaolao and Kenkatha cattle, respectively. Data of Arfound
in this group of breeds is similar to those
reported in Bos taurus Latin American native breeds, with 4.67±0.51 (Delgado et al., 2012). The high values of f found in most of the breeds studied in the present paper (except for SIN) could be attributed to the effects of the genetic improvement programmes to which they have been subjected for many years. If control programmes of mating were not estab-lished to prevent the increase of inbreeding, there could be a detrimental effect on the pro-ductivity of these populations, as observed in other breeds such as the Brown Swiss (da Silva et al., 2001). Studies of the breeds GYR by Aidar De Queiroz et al. (2000), and NEL by Garnero et al. (2008) both in Brazil, demon-strated that there is a decrease in live weight at different ages in inbred animals compared with non-inbred animals which supports our findings in these breeds.
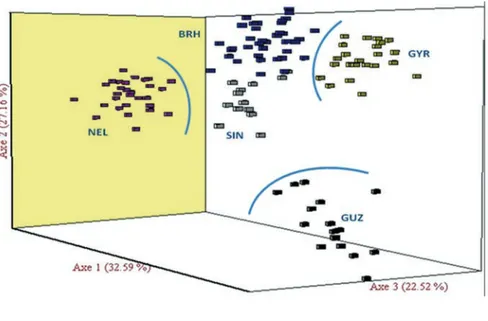
The results of the correspondence analysis (Figure 1) indicated that the first three axes explain 82.27% of the variability. The first axis accounted for 32.59% of the variability, sepa-rating NEL from the other breeds; the second axis accounted for 27.16% of the variability, separating GUZ from the other breeds and the third component accounted for 22.52% of the total variability, separating GYR from other breeds. All populations were presented in sep-arate groups but BRH and SIN breeds were found in closest cloud data. This can be explained by a divergent genesis of NEL, GUZ and GYR breeds in its American naturalization process, which might be more homogeneous and independent of maternal Creole freely Iberian origin for BRH and SIN, thus maintain-ing an apparent common origin.
AMOVA results indicated that the percent-age of variation within groups was 93.17% and the differences between groups were 6.83%. This value agrees with the differentiation val-ues reported among breeds by Cañón et al. (2001) and Villalobos et al. (2010) in Bos
Genetic relationships among zebu breeds
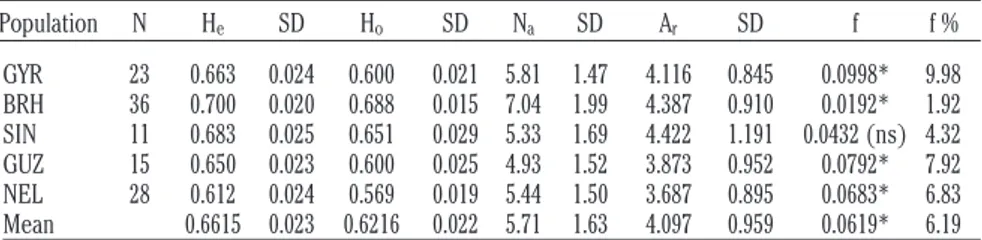
Table 1. Estimates and respective standard deviations of five zebu contemporary breeds expected and observed heterozygosity, average number of alleles, allelic richness, and the F-statistic f with its percentage.
Population N He SD Ho SD Na SD Ar SD f f % GYR 23 0.663 0.024 0.600 0.021 5.81 1.47 4.116 0.845 0.0998* 9.98 BRH 36 0.700 0.020 0.688 0.015 7.04 1.99 4.387 0.910 0.0192* 1.92 SIN 11 0.683 0.025 0.651 0.029 5.33 1.69 4.422 1.191 0.0432 (ns) 4.32 GUZ 15 0.650 0.023 0.600 0.025 4.93 1.52 3.873 0.952 0.0792* 7.92 NEL 28 0.612 0.024 0.569 0.019 5.44 1.50 3.687 0.895 0.0683* 6.83 Mean 0.6615 0.023 0.6216 0.022 5.71 1.63 4.097 0.959 0.0619* 6.19
He, expected heterozygosity; SD, standard deviation; Ho, observed heterozygosity; Na, number of alleles; Ar,allelic richness; f, inbreed-ing coefficient of Wright; GYR, Gyr; BRH, Brahman; SIN, Red Sindhi; GUZ, Guzerat; NEL, Nelore. *Significant for the method of Fisher; ns, not significant.
rus breeds and sufficient to consider an evi-dent genetic separation among the breeds studied here, as stated in international con-ventions (FAO, 2007). The values of FST (Table
2, below the diagonal) correspond to the value of genetic differentiation by pairs of breeds, ranging from a low of 0.036, pair BRH/GYR to 0.106 pair GUZ/GYR. Nm values are also pre-sented in Table 2 (above the diagonal); the lowest values of Nm were observed in the pair GUZ/NEL (3.03) and the highest in the pair BRH/SIN (10.80), which corroborates our hypothesis about the different models of nat-uralization followed by the studied breeds.
Reynolds genetic distances (Table 3) of the five breeds ranged from 0.046 in the pair SIN/BRH to 0.154 in the pair NEL/GUZ. The NEL population was the most distanced from all the zebu populations in this study. The dendrogram of distances presented (Figure 2) shows NEL and GYR breeds related in a cluster, GUZ in another separate cluster and SIN and BRH, sharing a different cluster. Within studies of bovine genetic diversity and applying the methodology described above, Martínez et al. (2012) and Villalobos et al. (2012) observed that the five Zebu popula-tions at stake presented values of Q>0.84 and shared the same cluster in different calculat-ed values of K, when comparcalculat-ed with other populations of Bos taurus, probably masking the intrarracial realationships associated only to the Zebu populations.
The method based on Bayesian clustering models allowed us to evaluate with higher resolution the genetic structure of the five zebu (Figure 3).
The results for K=2 indicate a clear separa-tion between NEL and other Zebu breeds con-firming other observations in the AFC and the analysis of genetic distances of Reynolds. When K=3, NEL and GUZ separated from the rest of Zebu strains. Similar to what was observed on axis 1 of AFC, GUZ breed shows a separation compared to other breeds on axis 2, adding both (NEL and GUZ) 59.75% of the total inertia. K=4, value considered the opti-mal number of ancestral populations of American zebu as calculated by Evanno et al. (2005), shows that the remaining breeds were mostly related to BRH and SIN, confirm-ing the observed data in the cloud in the AFC. The same pattern of behaviour was observed at Reynolds dendrogram of distances. Similarly, observing the values of Nm and FST
revealed that these two populations will have the highest gene flow in relation to other breeds (10.80) and one of the lowest values of genetic differentiation; therefore it can be inferred that there would still be some
repre-sentation of alleles of the two breeds that still share, since the Brahman breed was created in the nineteenth century (Sanders, 1980) or recent crossbreed made between the two pop-ulations. However, though phenotypically the five breeds have clearly different characteris-tics, the value of K=4 (Figure 3) represents the optimum value of ancestral populations.
When the value of K reached the value of 5, all populations within the study are fully separat-ed. This phenomenon could be attributed to the synthetic origin of the Brahman breed originated from the Guzerat, Gyr, Nelore and Red Sindhi breeds themselves involved in the present study.
Table 2. Values of average number of migrants (above the diagonal) and the F-statistic FST
(below the diagonal) of five zebu contemporary populations.
Population GYR BRH SIN GUZ NEL GYR - 7.340 4.930 4.200 3.820 BRH 0.036 - 10.800 5.110 4.390 SIN 0.074 0.042 - 5.270 3.370 GUZ 0.106 0.071 0.071 - 3.030 NEL 0.075 0.060 0.099 0.102
-GYR, Gyr; BRH, Brahman; SIN, Red Sindhi; GUZ, Guzerat; NEL, Nelore.
Table 3. Reynolds genetic distance matrix of five contemporary zebu breeds.
GYR BRH SIN GUZ NEL GYR - 0.065 0.102 0.112 0.123 BRH - 0.046 0.087 0.101 SIN - 0.095 0.134 GUZ - 0.154 NEL
-GYR, Gyr; BRH, Brahman; SIN, Red Sindhi; GUZ, Guzerat; NEL, Nelore.
Figure 1. Factorial analysis of correspondences of five contemporary zebu breeds. GYR, Gyr; BRH, Brahman; SIN, Red Sindhi; GUZ, Guzerat; NEL, Nelore.
Conclusions
The zebu populations GYR, GUZ and NEL have shown a clear genetic differentiation, jus-tified by a diverse origin and by a different model of introgression in America. Brahma and SIN have shown a strong genetic relation, probably due to the intervention of the Sindhi ancestors in the formation of the American synthetic Brahma. The other populations showed values above the acceptable maximum inbreeding, which put them in the risk of hav-ing a negative impact on productive capacity.
References
Aidar De Queiroz, S., Galvão De Albuquerque, L., Aparecida Lanzoni, N., 2000. Efeito da endogamia sobre características de cresci-mento de bovinos da raça Gir no Brasil. Rev. Bras. Zootecn. 29:1014-1019. Ardila, A., 2010. Programa de mejoramiento
genético para características económicas en razas cebuinas lecheras. Rev. Med. Vet.-Toulouse 19:11-20.
Beja-Pereira, A., Caramelli, D., Lalueza-Fox, C., Vernesi, C., Ferrand, N., Casoli, A., Goyache, A.F., Royo, L.J., Conti, S., Lari, M., Martini, A., Ouragh, L., Magid, A., Atash, A., Zsolnai, A., Boscato, P., Triantaphylidis, C., Ploumi, K., Sineo, L., Mallegni, F., Taberlet, P., Erhardt, G., Sampietro, L., Bertranpetit, J., Barbujani, G., Luikart, G., Bertorelle, G., 2006. The origin of European cattle: evidence from modern and ancient DNA. P. Natl. Acad. Sci. USA 103:8113-8118.
Belkhir, K., Borsa P., Chikhi, P., Raufaste, N., Bonhomme, F., 2003. Genetix: logiciel sous WindowsTMpour la génétique des
popula-tions. Version 4.05. Université de Montpellier, France.
Bradley, D.G., Loftus, R.T., Cunningham, P., Machugh, D.E., 1998. Genetics and domes-tic cattle origins. Evol. Anthropol. 6:79-86. Bryant, D., Moulton, V., 2004. Neighbor-Net: an
agglomerative method for the construction of phylogenetic networks. Mol. Biol. Evol. 21:255-265.
Cañón, J., Alexandrino, P., Bessa, I., Carleos, C., Carretero, Y., Dunner, S., Ferran, N., Garcia, D., Jordana, J., Laloë, D., Pereira, A., Sanchez, A., Moazami-Goudarzi, K., 2001. Genetic diversity measures of local European beef cattle breeds for conserva-tion purposes. Genet. Sel. Evol. 33:311-332. Cervini, M., Henrique-Silva, F., Mortari, N.,
Genetic relationships among zebu breeds
Figure 3. Proportion of admixtures of five contemporary zebu populations when K=2 to K=5 through programme structure based on Pritchard et al. (2000) and plotted using the Distruct programme by Rosenberg (2004).
Figure 2. Neighbour Net tree built from distances of Reynolds of five contemporary zebu breeds.
Matheucci, E., 2006. Genetic variability of 10 microsatellite markers in the characteriza-tion of Brazilian Nellore cattle (Bos indicus) Genet. Mol. Biol. 29:486-490.
Chaudarhi, M.V., Parmar, S.N.S., Joshi, C.G., Bhong, C.D., Fatima, S., Thakur, M.S., Thakur, S.S., 2009. Molecular characteriza-tion of Kenkatha and Gaolao (Bos indicus) cattle breeds using microsatellite markers. Anim. Biodivers. Conserv. 32:2.
Clutton-Brock, J., 1999. A natural history of
domesticated mammals. Cambridge
University Press, Cambridge, UK. da Silva, A.J., Martins Filho, R., Magnabosco, C.,
Bozzi, R., Lima, F., 2001. Efeitos da endoga-mia sobre características de reprodução, crescimento e valores genéticos aditivos de bovinos da raça Pardo-Suíça. Rev. Bras. Zootecn. 30:83-92.
Delgado, J.V., Martínez, A.M., Acosta, A., Alvarez, L.A., Armstrong, E., Camacho, E., Cañón, J., Cortés, O., Dunner, S., Landi, V., Marques, J.R., Martín-Burriel, I., Martínez, O.R., Martínez, R.D., Melucci, L., Muñoz, J.E., Penedo, M.C.T., Postiglioni, A., Quiróz, J., Rodellar, C., Sponenberg, P., Uffo, O., Ulloa-Arvizu, R., Vega-Pla, J.L., Villalobos, A., Zambrano, D., Zaragoza, P., Gama, L.T., Ginja C., 2012. Genetic characterization of Latin-American Creole cattle using microsatellite markers. Anim. Genet. 43:2-10.
Egito, A., Paiva, S.R., Albuquerque, M.M., Mariante, A.S., Almeida, L.D., Castro, S.R., Grattapaglia, D., 2007. Microsatellite based genetic diversity and relationships among ten Creole and commercial cattle breeds raised in Brazil. BMC Genet. 8:83. Evanno, G., Regnaut, S., Goudet, J., 2005.
Detecting the number of clusters of individ-uals using the software STRUCTURE: a sim-ulation study. Mol. Ecol. 14:2611-2620. Excoffier, L., Laval, G., Schneider, S., 2005.
Arlequin (version 3.0): an integrated soft-ware package for population genetics data analysis. Evol. Bioinform. 1:47-50. FAO, 2007. The state of the world’s animal
genet-ic resources for food and agrgenet-iculture. Available from: http://www.fao.org/docrep /010/a1250e/a1250e00.htm
FAO, 2011. Molecular genetic characterization of animal genetic resources. Available from: h t t p : / / w w w . f a o . o r g / d o c r e p / 0 1 4 / i2413e/i2413e00.htm
Garnero, A., Berruti, A., Marcondes, C.R., Martins, E.N., Lobo, R.B., Araújo, R.O.Y., Gunski, R.J., 2008. Endogamia en rodeos seleccionadores de la raza Nellore en Brasil. Available from: http://www.lrrd.org /lrrd20/10/garn20159.htm
Ginja, C., Penedo, M.C.T., Melucci, L., Quiroz, J., Martínez López, O.R., Revidatti, M.A., Martínez-Martínez, A., Delgado, J.V., Gama, L.T., 2010. Origins and genetic diversity of New World Creole cattle: inferences from mitochondrial and Y chromosome polymor-phisms. Anim. Genet. 41:128-141. Goudet, J., 2001. FSTAT: a program to estimate
and test gene diversities and fixation indices (version 2.9.3). Available from: http://www2.unil.ch/popgen/softwares/fstat. htm
Hall, S.J.G., Lenstra, J.A., Deeming, D.C., The
European Cattle Genetic Diversity
Consortium, 2012. Prioritization based on neutral genetic diversity may fail to con-serve important characteristics in cattle breeds. J. Anim. Breed. Genet. 129:218-225. Huson, D.H., Bryant, D., 2006. Application of phylogenetic networks in evolutionary stud-ies. Mol. Biol. Evol. 23:254-267.
Langella, O., 2002. Population 1.2.28. Logiciel de génétique des populations. Laboratoire Populations, génétique et évolution. CNRS UPR 9034 Ed., Gif-sur-Yvette, France. Lenstra, J.A., Groeneveld, L.F., Eding, H.,
Kantanen, J., Williams, J.L., Taberlet, P., Nicolazzi, E.L., Sölkner, J., Simianer, H., Ciani, E., Garcia, J.F., Bruford, M.W., Ajmone-Marsan, P., Weigend, S., 2012. Molecular tools and analytical approaches for the characterization of farm animal genetic diversity. Anim. Genet. 43:483-502. Martínez, A.M., Gama, L.T., Cañón, J., Ginja, C.,
Delgado, J.V., Dunner, S., Landi, V., Martín-Burriel, I., Penedo, M.T., Rodellar, C., Vega-Pla, J.L., Acosta, A., Álvarez, L.A., Camacho, E., Cortés, O., Marques, J.R., Martínez, R., Martínez, R.D., Melucci, L., Martínez-Velázquez, G., Muñoz, J.E., Postiglioni, A., Quiroz, J., Sponenberg, P., Uffo, O., Villalobos, A., Zambrano, D., Zaragoza, P., 2012. Footprints of Iberian cattle in America 500 years after the arrival of Columbus. PLoS ONE 7:e49066.
Medugorac, I., Veit-Kensch, C.E., Ramljak, J., Brka, M., Markovi , B., Stojanovi , S., Bytyqi, H., Kochoski, L., Kume, K., Grünenfelder, H.-P., Bennewitz, J., Förster, M., 2011. Conservation priorities of genetic diversity in domesticated metapopulations: a study in taurine cattle breeds. Ecol. Evol. 1:408-420. Mukesh, M., Sodhi, M., Bhatia, S., Mishra, P.,
2004. Genetic diversity of Indian native cat-tle breeds as analysed with 20 microsatellite loci. J. Anim. Breed. Genet. 121:416-424. Nei, M., 1987. Molecular evolutionary genetics.
Columbia University Press, New York, NY, USA.
Ott, J., 1992. Strategies for characterizing highly
polymorphic markers in human gene map-ping. Am. J. Hum. Genet. 51:283-290. Parland, S., Kearney, J.F., Rath, M., Berry, D.P.,
2007. Inbreeding trends and pedigree analy-sis of Irish dairy and beef cattle populations. J. Anim. Sci. 85:322-331.
Peakall, R., Smouse, P.E., 2012. GenAlEx 6.5: genetic analysis in Excel. Population genet-ic software for teaching and research-an update. Bioinformatics 28:2537-2539. Pritchard, J.K., Stephens, M., Donnelly, P., 2000.
Inference of population structure using multilocus genotype data. Genetics 155:945-959.
Raymond, M., Rousset, F., 1995. GENEPOP (ver-sion 3.1d): population genetics software for extract test and ecumenicism. J. Hered. 86:248-249.
Reynolds, J., Weir, B., Cockerham, C.C., 1983. Estimation of the coancestry coefficient: basis for a short-term genetic distance. Genetics 105:767-779.
Rice, W.R., 1989. Analysing tables of statistical tests. Evolution 43:223-225.
Rosenberg, N., 2004. DISTRUCT: a program for the graphical display of population Structure. Mol. Ecol. Notes 4:137-138. Sanders, J.O., 1980. History and development of
Zebu cattle in the United States. J. Anim. Sci. 50:1188-1200.
Sodhi, M., Mukesh, M., Prakash, B., Ahlawat, S.P.S., Sobti, R.C., 2006. Microsatellite DNA typing for assessment of genetic variability in Tharparkar breed of Indian zebu (Bos indicus) cattle, a major breed of Rajasthan. J. Genet. 85:165-170.
Villalobos, A.I., Martínez, A.M., Escobar, C., Vega-Pla, J.L., Delgado, J.V., 2010. Study of genetic diversity of the Guaymi and Guabala bovine populations by means of microsatellites. Livest. Sci. 131:45-51.
Villalobos, A.I., Martínez, A.M., Vega-Pla, J., Landi, V., Quiroz, J.R., Martínez López, R., Sponenberg, P., Armstrong, E., Zambrano, D., Ribamar Marques, J., Delgado, J.V., 2012. Relaciones entre los bovinos criollos pana-meños y algunas razas criollas de Latinoamérica. Pesqui. Agropecu. Bras. 47:1637-1646.
Weir, B.S., Cockerham, C.C., 1984. Estimating F-statistics for the analysis of population structure. Evolution 38:1358-1370. Wright, S., 1965. The interpretation of
popula-tion structure by F-statistics with special regard to systems of mating. Evolution 19:395-420.