DOI 10.1140/epjc/s10052-017-5090-4 Regular Article - Experimental Physics
Measurement of D-meson production at mid-rapidity
in pp collisions at √s = 7 TeV
ALICE Collaboration⋆
CERN, 1211 Geneva 23, Switzerland
Received: 19 February 2017 / Accepted: 20 July 2017
© CERN for the benefit of the ALICE collaboration 2017. This article is an open access publication
Abstract The production cross sections for prompt charmed mesons D0, D+, D∗+ and D+s were measured at mid-rapidity in proton–proton collisions at a centre-of-mass energy √s = 7 TeV with the ALICE detector at the Large Hadron Collider (LHC). D mesons were reconstructed from their decays D0 → K−π+, D+ → K−π+π+, D∗+ → D0π+, D+s → φπ+→ K−K+π+, and their charge conju-gates.With respect to previous measurements in the same rapidity region, the coverage in transverse momentum ( pT) is extended and the uncertainties are reduced by a factor of about two. The accuracy on the estimated total cc produc-tion cross secproduc-tion is likewise improved. The measured pT -differential cross sections are compared with the results of three perturbative QCD calculations.
1 Introduction
In high-energy hadronic collisions heavy quarks are pro-duced by hard scatterings between partons of the two incom-ing hadrons. The production cross section of hadrons with charm or beauty quarks is calculated in the framework of Quantum Chromodynamics (QCD) and factorised as a con-volution of the hard scattering cross sections at partonic level, the parton distribution functions (PDFs) of the incom-ing hadrons and the non-perturbative fragmentation func-tions of heavy quarks to heavy-flavour hadrons. Factorisation is implemented in terms of the squared momentum trans-fer Q2(collinear factorisation) [1] or of the partonic trans-verse momentum kT [2]. The hard scattering cross section is expanded in a perturbative series in powers of the strong coupling constant αs. State-of-the-art calculations based on collinear factorisation implement a perturbative expansion up to next-to-leading order (NLO) in αs, such as the general-mass variable flavour number scheme (GM-VFNS) [3–5], or next-to-leading order in αs with all-order resummation of the logarithms of pT/mQ (FONLL) [6,7], where pTand
mQ are the heavy-quark transverse momentum and mass,
⋆e-mail:[email protected]
respectively. Calculations based on kT factorisation exist only at leading order (LO) in αs [2,8,9]. All these calcu-lations provide a good description of the production cross sections of D and B mesons in proton–proton (and proton– antiproton) collisions at centre-of-mass energies from 0.2 to 13 TeV over a wide pT range at both central and for-ward rapidities (see e.g. [10] and references therein). In the case of charm production the uncertainties of the theoreti-cal theoreti-calculations, dominated by the perturbative stheoreti-cale uncer-tainties, are significantly larger than the experimental ones [11–21]. However, it was recently pointed out that in ratios of cross sections at different LHC energies and in different rapidity intervals the perturbative uncertainty becomes sub-dominant with respect to the uncertainty on the PDFs [22], thus making the measurement sensitive in particular to the gluon PDF at values of Bjorken-x down to 10−5when the D-meson pTapproaches 0. This represents a strong motivation for pursuing precise measurements of D-meson production in pp collisions at LHC energies. Charm hadroproduction measurements are also required for cosmic-ray and neutrino astrophysics, where high-energy neutrinos from the decay of charmed hadrons produced in particle showers in the atmo-sphere constitute an important background for neutrinos from astrophysical sources [23–26].
In the context of the heavy-ion programme at the LHC, D-meson measurements in pp collisions represent an essential reference for the study of effects induced by cold and hot strongly-interacting matter in the case of proton–nucleus and nucleus–nucleus collisions (see e.g. the recent reviews [10, 27]). In addition, the cc production cross section per nucleon– nucleon collision is a basic ingredient for the determination of the amount of charmonium production by (re)generation in a quark-gluon plasma [28–30], a mechanism that is supported by J/ψ measurements in nucleus–nucleus collisions at the LHC [31,32]. A precise measurement of the cc production cross section in pp collisions would enable a more stringent comparison of model calculations with data.
In this article, we report the measurement of the pro-duction cross sections of prompt D0, D+, D∗+ and D+s
mesons (as average of particles and anti-particles), and of their ratios, in pp collisions at the centre-of-mass energy √s
= 7 TeV using the ALICE detector at the LHC. The mea-surements cover mid-rapidity (|y| < 0.5) and the intervals 0 < pT<36 GeV/c for D0mesons, 1 < pT <24 GeV/c for D+and D∗+mesons, and 2 < pT <12 GeV/c for D+s mesons. The measurements cover complementary intervals in pT and rapidity with respect to those published by the ATLAS (3.5 < pT < 100 GeV/c, |η| < 2.1 [13]) and LHCb (0 < pT < 8 GeV/c, 2 < y < 4.5 [19]) Collabo-rations at the same centre-of-mass energy. In comparison to previous ALICE publications based on the same data sample [14,16,17], the present results have a significantly extended
pT coverage (for example, the previous coverage for D0 mesons was 0–16 GeV/c) and total uncertainties reduced by a factor of about two. These improvements have several sources: (i) changes in the detector calibration, alignment and track reconstruction algorithm, which resulted in bet-ter pTresolution, thus higher signal-to-background ratio; (ii) optimization of the D-meson selection procedure; (iii) refine-ments in the estimation of the systematic uncertainties, which is now more data-driven; (iv) a data sample with 20% larger integrated luminosity.
The article is organised as follows: the data sample and the analysis procedure are described in Sect.2, the estimation of the systematic uncertainties is discussed in Sect.3and the results are presented and compared to theoretical calculations in Sect.4.
2 Analysis
A complete description of the ALICE experimental setup and of its performance can be found in [33,34]. D mesons were reconstructed at mid-rapidity from their decay products, using the tracking and particle identification capabilities of the ALICE central barrel detectors located within a large solenoidal magnet, providing a field B = 0.5 T parallel to the beam line (z axis of the ALICE reference frame). The innermost detector, the Inner Tracking System (ITS), is used to track charged particles within the pseudorapidity interval |η| < 0.9 as well as for primary and secondary vertex recon-struction. It consists of six cylindrical layers equipped with Silicon Pixel Detectors (SPD), Silicon Drift Detectors (SDD) and Silicon Strip Detectors (SSD) from inner to outer layers. The ITS provides a resolution on the track impact parameter
d0to the primary vertex in the transverse plane (rϕ) better than 75 µm for transverse momentum pT >1 GeV/c. As compared to previous publications based on the same data sample [14,16], the alignment of the ITS sensor modules was improved and a new procedure for the calibration of the drift velocity and of the non-uniformities of the drift field in the SDD was used. The Time Projection Chamber (TPC)
provides track reconstruction as well as particle identifica-tion via the measurement of the specific ionisaidentifica-tion energy loss dE/dx. The Time-Of-Flight detector (TOF) extends the charged particle identification capabilities of the TPC via the measurement of the flight time of the particles from the interaction point. The event collision time is measured with the T0 detector, which consists of two arrays of Cherenkov counters located at+350 cm and −70 cm along the beam line, or, for the events with sufficiently large multiplicity, it is estimated using the particle arrival times at the TOF [35]. The V0 detector, used in the online trigger and offline event selection, consists of two arrays of 32 scintillators each, cov-ering the pseudorapidity intervals−3.7 < η < −1.7 and 2.8 < η < 5.1, placed around the beam vacuum tube on either side of the interaction region. A minimum-bias (MB) trigger was used to collect the data sample, by requiring at least one hit in either of the V0 counters or in the SPD (|η| < 2). Events were selected off-line by using the tim-ing information from the V0 and the correlation between the number of hits and track segments in the SPD detector to remove background due to beam–gas interactions. Only events with a primary vertex reconstructed within±10 cm from the centre of the detector along the beam line were used for the analysis. The analysed data sample consists of about 370 million MB events, corresponding to an integrated lumi-nosity Lint= (6.0 ± 0.2) nb−1, collected during the 2010 pp run at √s= 7 TeV.
D mesons were reconstructed via their hadronic decay channels D0 → K−π+ (with branching ratio, BR= 3.93 ± 0.04%), D+ → K−π+π+ (BR = 9.46 ± 0.24%), D∗+(2010)→ D0π+(strong decay with BR= 67.7 ± 0.5%) with D0→ K−π+and Ds+→ φπ+with φ→ K−K+(BR = 2.27±0.08%), together with their charge conjugates [36]. D-meson candidates were defined using pairs or triplets of tracks with the proper charge-sign combination. Tracks were required to have|η| < 0.8, pT >0.3 GeV/c, at least 70 associated TPC space points (out of a maximum of 159), χ2/ndf < 2 in the TPC (where ndf is the number of degrees of freedom involved in the track fit procedure), and at least one hit in either of the two layers of the SPD. For the soft pion produced in D∗+decay, also tracks reconstructed only with the ITS, with at least four hits, including at least one in the SPD, and pT>80 MeV/c were considered. With these track selection criteria, the acceptance in rapidity for D mesons drops steeply to zero for|y| > 0.5 at low pTand|y| > 0.8 at
pT>5 GeV/c. A pT-dependent fiducial acceptance cut was therefore applied on the D-meson rapidity,|y| < yfid(pT), with yfid(pT)increasing from 0.5 to 0.8 in the transverse momentum range 0 < pT<5 GeV/c according to a second-order polynomial function, and yfid= 0.8 for pT>5 GeV/c. D0, D+and D+s mesons have mean proper decay lengths
cτ of about 123, 312 and 150 µm, respectively [36]. Their decay vertices are therefore typically displaced by a few
hun-dred µm from the primary vertex of the interaction. Geo-metrical selections on the D-meson decay topology were applied to reduce the combinatorial background. The selec-tion requirements were tuned so as to provide a large sta-tistical significance for the signal and to keep the selection efficiency as high as possible. The latter requirement was dic-tated also by the fact that too tight cuts result in an increased contribution to the raw yield from feed-down D mesons orig-inating from decays of B mesons. In the D∗+ → D0π+ case, the decay vertex cannot be resolved from the primary vertex and geometrical selections were applied on the sec-ondary vertex topology of the produced D0. The geomet-rical selections were mainly based on the displacement of the tracks from the interaction vertex, the distance between the D-meson decay vertex and the primary vertex (decay length, L), and the pointing of the reconstructed D-meson momentum to the primary vertex. The pointing condition is applied by requiring a small value for the angle θpointing between the directions of the reconstructed momentum of the candidate and its flight line, defined by the vector from the primary to the secondary vertex. In comparison to the previous analysis of the same data sample, additional selec-tion criteria were introduced. In particular, the projecselec-tions of the pointing angle and of the decay length in the trans-verse plane (θpointingrϕ and Lrϕ) were considered. Moreover, a
cut on the normalised difference between the measured and expected impact parameters of each of the decay particles (d0,trreco− d0,trexp)/σ,was applied, where d0,trrecois the measured track impact parameter, d0,trexpis defined as Lrϕsin(θrϕ
tr,D), θtr,Drϕ is the measured angle between the momenta of the D meson and of the considered track, and σ,is the combination of the uncertainties on the measured and expected d0. By requiring (d0,trreco− d0,trexp)/σ,<3, a significant rejection of background candidates (15–40% depending on D-meson species and pT) and feed-down D mesons (up to 50% at high pT) is achieved while keeping almost 100% of the prompt D mesons.
Further reduction of the combinatorial background was obtained by applying particle identification (PID) to the decay tracks. A 3σ compatibility cut was applied on the dif-ference between the measured and expected signals for pions and kaons for both the dE/dx and time-of-flight. Tracks without TOF hits were identified using only the TPC informa-tion with a 3 σ selecinforma-tion for D0, D+and D∗+decay products, and a 2 σ selection for the D+s. This stricter PID selection strategy was needed in the D+s case due to the large back-ground of track triplets and the short D+s lifetime, which limits the effectiveness of the geometrical selections on the displaced decay-vertex topology. Based on the PID informa-tion and the charge sign of the decay tracks, D0candidates were accepted (as D0, D0, or both) or rejected, according to the compatibility with the K∓π±final state. For the D∗+ reconstruction, this ambiguity is resolved using the charge of the soft pion. In the cases of the D+
s → K−K+π+ and
D+ → K−π+π+ decays, a candidate was rejected if the track with charge opposite to that of the D meson was not compatible with the kaon PID hypothesis.
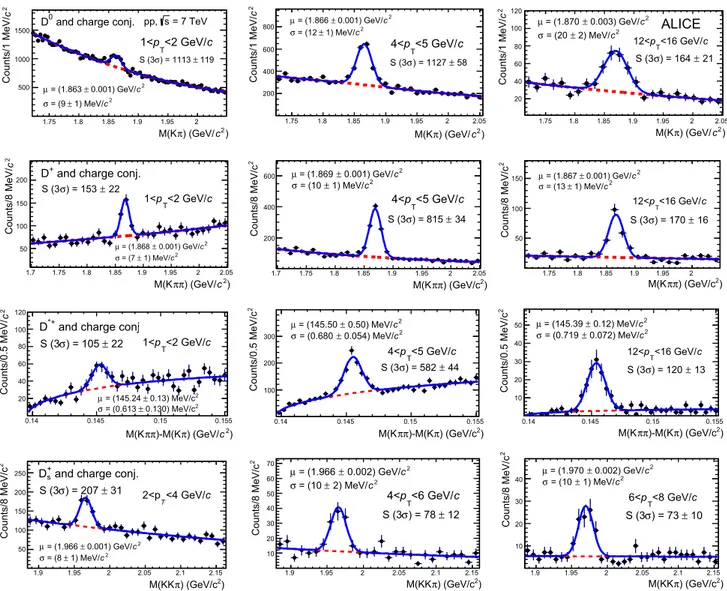
The D-meson raw yields, including both particles and anti-particles, were obtained from fits to the D0, D+ and D+ s candidate invariant-mass distributions and to the mass dif-ference ,M = M(Kππ) − M(Kπ) distributions for D∗+ candidates. In the fit function, the signal was modeled with a Gaussian and the background was described by an expo-nential term for D0, D+and D+s candidates and by the func-tion a√,M− mπ· eb(,M−mπ) for D∗+candidates. In the case of D0mesons, an additional term was included in the fit function to account for the contribution of signal candi-dates that are present in the invariant mass distribution with the wrong daughter particle mass assignment (reflections). A study with Monte Carlo simulations showed that about 70% of these reflections are rejected by the PID selections. The residual contribution was accounted for by including in the fit a template consisting of the sum of two wide Gaussians with centroids and widths fixed to values obtained in the simulation and with amplitudes normalised using the signal observed in data.
Figure1shows fits to the invariant-mass (mass-difference) distributions in three pT intervals for D0, D+, (D∗+) and D+s candidates from top to bottom. The mean values of the Gaussians in all transverse-momentum intervals were found to be compatible within uncertainties with the world average rest mass values for D0, D+and D+s and with the difference
MD∗+ − MD0 for the D∗+[36]. The widths are consistent with the results from Monte Carlo simulations and smaller by 10–20% than the values in [14,16], as a consequence of the improved pTresolution.
The pT-differential cross section of prompt D mesons was computed as: d2σD d pTdy = 1 c,y,pT 1 BR 1 2 fprompt· ND+D,raw ! ! !|y|<y fid (Acc× ε)prompt 1 Lint, (1) where fprompt, ND+D,rawand (Acc×ε)promptare pT-interval dependent quantities. The raw yield values (sum of particles and antiparticles, ND+D,raw) were corrected for the B-meson decay feed-down contribution (i.e. multiplied by the prompt fraction fpromptin the raw yield), divided by the acceptance-times-efficiency for prompt D mesons (Acc× ε)prompt, and divided by a factor of two to obtain the particle and antipar-ticle averaged yields. The pT-differential yields for each D-meson species, measured separately for particles and anti-particles, were found to be in agreement within statistical uncertainties. The corrected yields were divided by the decay channel BR, the pTinterval width ,pT, the correction factor for the rapidity coverage c,y, and the integrated luminos-ity Lint = Nev/σMB, where Nev is the number of analysed
fhistoInvMass__1__1__1__1__1__1__1 ) 2 c ) (GeV/ π M(K 1.75 1.8 1.85 1.9 1.95 2 2c Counts/1 MeV/ 500 1000 1500 fhistoInvMass__1__1__1__1__1__1__1__1 Entries 150 Mean 1.852 RMS 0.09038
and charge conj.
0 D c <2 GeV/ T p 1< = 7 TeV s pp, 119 ± ) = 1113 σ S (3 2 c 0.001) GeV/ ± = (1.863 µ 2 c 1) MeV/ ± = (9 σ ) 2 c ) (GeV/ π M(K 1.75 1.8 1.85 1.9 1.95 2 2.05 2c Counts/1 MeV/ 200 400 600 800 c <5 GeV/ T p 4< 58 ± ) = 1127 σ S (3 2 c 0.001) GeV/ ± = (1.866 µ 2 c 1) MeV/ ± = (12 σ ) 2 c ) (GeV/ π M(K 1.75 1.8 1.85 1.9 1.95 2 2.05 2c Counts/1 MeV/ 20 40 60 80 100 120 c <16 GeV/ T p 12< ALICE 21 ± ) = 164 σ S (3 2 c 0.003) GeV/ ± = (1.870 µ 2 c 2) MeV/ ± = (20 σ fhistoInvMass__4423__4__4__4__4__4__4__4__4__4 ) 2 c ) (GeV/ π π M(K 1.7 1.75 1.8 1.85 1.9 1.95 2 2.05 2 c Counts/8 MeV/ 50 100 150 200 fhistoInvMass__4423__4__4__4__4__4__4__4__4__4__4 Entries 40 Mean 1.888 RMS 0.09962
and charge conj. + D c <2 GeV/ T p 1< 22 ± ) = 153 σ S (3 2 c 0.001) GeV/ ± = (1.868 µ 2 c 1) MeV/ ± = (7 σ ) 2 ) (GeV/c π π M(K 1.7 1.75 1.8 1.85 1.9 1.95 2 2.05 2 Counts/8 MeV/c 200 400 600 34 ± ) = 815 σ S (3 c <5 GeV/ T p 4< 2 c 0.001) GeV/ ± = (1.869 µ 2 c 1) MeV/ ± = (10 σ ) 2 ) (GeV/c π π M(K 1.75 1.8 1.85 1.9 1.95 2 2 Counts/8 MeV/c 50 100 150 16 ± ) = 170 σ S (3 2 c 0.001) GeV/ ± = (1.867 µ 2 c 1) MeV/ ± = (13 σ c <16 GeV/ T p 12< fhistoInvMass__77__7__7__7__7__7__7__7__7__7 ) 2 c ) (GeV/ π )-M(K π π M(K 0.14 0.145 0.15 0.155 2c Counts/0.5 MeV/ 20 40 60 80 100 120 fhistoInvMass__77__7__7__7__7__7__7__7__7__7__7 Entries 175 Mean 0.1484 RMS 0.004071 22 ± ) = 105 σ S (3
and charge conj. *+ D c <2 GeV/ T p 1< 2 0.13) MeV/c ± = (145.24 µ 2 0.130) MeV/c ± = (0.613 σ fhistoInvMass__88__8__8__8__8__8__8__8__8__8 ) 2 ) (GeV/c π )-M(K π π M(K 0.14 0.145 0.15 0.155 2 Counts/0.5 MeV/c 100 200 300 fhistoInvMass__88__8__8__8__8__8__8__8__8__8__8 Entries 175 Mean 0.1483 RMS <5 GeV/ 0.004041 c T p 4< 44 ± ) = 582 σ S (3 2 c 0.50) MeV/ ± = (145.50 µ 2 c 0.054) MeV/ ± = (0.680 σ fhistoInvMass__99__9__9__9__9__9__9__9__9__9 ) 2 ) (GeV/c π )-M(K π π M(K 0.14 0.145 0.15 0.155 2 Counts/0.5 MeV/c 10 20 30 40 50 fhistoInvMass__99__9__9__9__9__9__9__9__9__9__9 Entries 175 Mean 0.1469 RMS 0.003232 c <16 GeV/ T p 12< 13 ± ) = 120 σ S (3 2 c 0.12) MeV/ ± = (145.39 µ 2 c 0.072) MeV/ ± = (0.719 σ ) 2 ) (GeV/c π M(KK 1.9 1.95 2 2.05 2.1 2.15 2 Counts/8 MeV/c 50 100 150 200 250 31 ± ) = 207 σ S (3 2 c 0.001) GeV/ ± = (1.966 µ 2 c 1) MeV/ ± = (8 σ
and charge conj. s + D c <4 GeV/ T 2<p ) 2 ) (GeV/c π M(KK 1.9 1.95 2 2.05 2.1 2.15 2 Counts/8 MeV/c 10 20 30 40 50 60 70 12 ± ) = 78 σ S (3 2 c 0.002) GeV/ ± = (1.966 µ 2 c 2) MeV/ ± = (10 σ c <6 GeV/ T p 4< ) 2 ) (GeV/c π M(KK 1.9 1.95 2 2.05 2.1 2.15 2 Counts/8 MeV/c 10 20 30 40 10 ± ) = 73 σ S (3 c <8 GeV/ T p 6< 2 c 0.002) GeV/ ± = (1.970 µ 2 c 1) MeV/ ± = (10 σ
Fig. 1 Invariant-mass (mass-difference) distributions of D0, D+,
(D∗+) and D+s candidates and charge conjugates in three pTintervals for a sample of pp collisions at √s= 7 TeV with Lint= 6.0 nb−1. The curvesshow the fit functions as described in the text. The contribution
of reflections for the D0meson is included. The values of mean (µ) and width (σ ) of the signal peak are reported together with the signal counts (S) in the mass interval (µ− 3σ, µ + 3σ)
events and σMB = 62.2 mb is the cross section for the MB trigger condition [37].
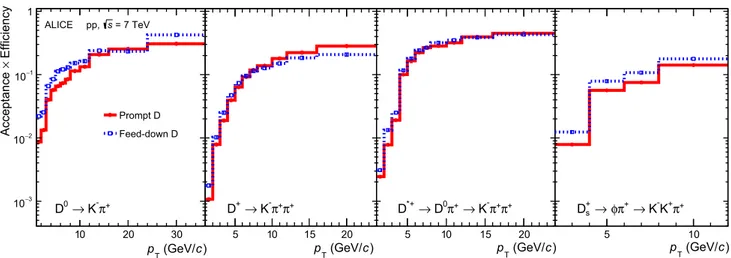
The (Acc×ε) correction factor was determined using sim-ulations of pp collisions generated with the PYTHIA 6.4.21 event generator [38] (Perugia-0 tune [39]), and particle trans-port through the apparatus using GEANT3 [40]. The lumi-nous region distribution and the conditions of all the ALICE detectors were included in the simulations. The (Acc×ε) for prompt and feed-down D0, D+, D∗+ and D+s mesons with |y| < yfid is shown in Fig.2as a function of pT. The effi-ciencies for feed-down D mesons are higher than those for prompt D mesons in most of the pTintervals, because the decay vertices of the feed-down D mesons are on average more displaced from the primary vertex due to the large B-meson lifetime (cτ ≈ 500 µm [36]). However, the selection
on the difference between measured and expected decay-track impact parameters rejects more efficiently feed-down D mesons, thus reducing the difference between prompt and feed-down efficiencies as compared to the previous analyses.
The rapidity acceptance correction factor c,y was com-puted with the PYTHIA 6.4.21 event generator with Perugia-0 tune as the ratio between the generated D-meson yield in ,y= 2 yfid, (with yfidvarying from 0.5 at low pTto 0.8 at high pT) and that in|y| < 0.5. It was checked that calcula-tions of the c,y correction factor based on FONLL pQCD
calculations [7] or on the assumption of uniform D-meson rapidity distribution in|y| < yfidwould give the same result, because both in PYTHIA and in FONLL the D-meson yield is uniform within 1% in the range|y| < 0.8.
) c (GeV/ T p Efficiency× Acceptance −3 10 −2 10 −1 10 1 ALICE pp, s = 7 TeV + π K → 0 D Prompt D Feed-down D ) c (GeV/ T p + π + π K → + D ) c (GeV/ T p + π + π K → + π 0 D → *+ D ) c (GeV/ T p 10 20 30 5 10 15 20 5 10 15 20 5 10 + π + K K → + π φ → + s D
Fig. 2 Acceptance × efficiency for D0, D+, D∗+and D+s mesons, as a function of pT. The efficiencies for prompt (solid lines) and feed-down
(dotted lines) D mesons are shown
The fpromptfraction was calculated using the B production cross sections from FONLL calculations [6,41], the B → D+ X decay kinematics from the EvtGen package [42] and the efficiencies for feed-down D mesons reported in Fig.2:
fprompt= 1 − N D feed-down raw ND raw = 1 − " d2σ d pTdy #FONLL feed-down ·(Acc× ε)feed-down· c,y,pT· BR · Lint
ND+D,raw/2 , (2)
where the pTdependence of fprompt, ND+D,rawand (Acc× ε)feed-downis omitted for brevity. The values of fpromptrange between 0.85 and 0.97 depending on D-meson species and
pT.
3 Systematic uncertainties
Systematic uncertainties were estimated considering several sources. A summary is shown in Table1 for two pT inter-vals. New or refined procedures were used with respect to the analyses presented in [14,16], in particular for the uncertain-ties on the signal yield extraction, the track reconstruction efficiency and the feed-down subtraction.
The systematic uncertainties on the yield extraction obtained from the fits to the invariant-mass distributions (mass difference for D∗+mesons) were evaluated by repeat-ing the fits several times varyrepeat-ing (i) the invariant-mass bin width, (ii) the lower and upper limits of the fit range, (iii) the background fit function (exponential function, first, second and third order polynomials were used for D0, D+and D+s and a power law for the D∗+), for a total of about few hundred fits for each D-meson species and pT interval. In addition, the same approach was used with a bin counting method, in which the signal yield was obtained by integrating the
invariant-mass distribution after subtracting the background estimated from a fit to the side-bands. The distributions of the signal yield obtained from these variations are consistent with a Gaussian shape and the mean of the distributions is close to the central value of the yield. The systematic uncer-tainty was defined as the R.M.S. of this distribution.
The systematic uncertainty on the track reconstruction efficiency was estimated by varying the track-quality selec-tion criteria and by comparing the probability to prolong tracks from the TPC inward to the ITS (‘matching efficiency’) in data and simulations. The variation of the track selection criteria, such as the minimum number of clusters in the TPC, was found to yield a 2% systematic effect on the cross section of D0 mesons (two-prong final state) and 3% for the other meson species (three-prong final states). The comparison of the matching efficiency in data and simulations was made after weighting the relative abundances of primary and sec-ondary particles in the simulation to match those observed in data. This weighting is motivated by the observation that the matching efficiency is much larger for primary particles than for secondary particles produced far from the interac-tion point in decays of strange hadrons and in interacinterac-tions of primary particles with the material of the detector. The fractions of primary and secondary particles were estimated, as a function of pT, by fitting the inclusive track impact parameter distributions in data and in the simulation with a sum of three template distributions for primary particles, for secondary particles from strange-hadron decays and for secondary particles produced in interactions of primary par-ticles in the detector material. The templates were obtained from the simulation. After weighting the relative abundances in the simulation to match those in data, the systematic uncer-tainty on the matching efficiency was defined as the relative difference of the matching efficiencies in data and in the simu-lation. The study was made separately for particles identified
Table 1 Summary of relative
systematic uncertainties for two pTintervals D0 D+ D∗+ D+s pT(GeV/c) 2–3 10–12 2–3 10–12 2–3 10–12 2–4 8–12 Signal yield 3% 4% 6% 5% 2% 2% 5% 5% Tracking efficiency 4% 4% 4% 6% 6% 6% 5% 6% Selection efficiency 5% 5% 10% 5% 5% 5% 7% 7% PID efficiency 0 0 0 0 0 0 7% 7% pTShape in MC 0 0 1% 2% 2% 0 3% 2% Feed-down +4−4% +3−5% +2−3% +2−3% +2−2% +2−3% +4−5% +4−5% Branching ratio 1.0% 2.5% 1.3% 3.5% Normalisation 3.5%
as pions and as kaons using the TPC and TOF PID selections described in Sect.2. The systematic uncertainty is 2% per track in the interval 2 < pT<6 GeV/c and 1% at lower and higher pT. The per-track uncertainty was then propagated to the D mesons, taking into account the number and trans-verse momentum of their decay tracks, and added in quadra-ture to the component estimated from the track selection variation.
Systematic uncertainties can also arise from possible dif-ferences in the distributions and resolution of the geometric selection variables between data and the simulation. These uncertainties were evaluated by repeating the analysis with several sets of selection criteria and comparing the resulting corrected cross sections. More details can be found in [14].
To estimate the uncertainty on the PID selection efficiency, for the three non-strange D-meson species the analysis was repeated without PID selection. The resulting cross sections were found to be compatible with those obtained with the PID selection. Therefore, no systematic uncertainty was assigned. For the D+
s meson, the lower signal yield and the larger com-binatorial background prevented a signal estimation without particle identification, hence, in this case, a 3σ PID selection, looser with respect to the PID strategy adopted in the anal-ysis, was used to estimate a systematic uncertainty of about 7%.
The systematic effect on the efficiency due to a possible difference between the simulated and real pTdistribution of D mesons was estimated by using alternative D-meson pT distributions from the PYTHIA 6 generator with Perugia-0 tune and from the FONLL pQCD calculation. More details can be found in [14].
The systematic uncertainty on the subtraction of feed-down from beauty-hadron decays includes the uncertainties of (i) the B-meson production cross section from FONLL cal-culations, (ii) the branching ratios of B mesons into D mesons [36] and (iii) the relative abundances of B-meson species pro-duced in the beauty-quark fragmentation [36]. The dominant contribution is the one originating from the FONLL calcu-lations and it was estimated by varying the pT-differential
cross section of feed-down D mesons within the theoretical uncertainties of the FONLL calculation. The procedure for the variation of the b-quark mass, of the perturbative scales and of the parton distribution functions is described in [7]. In previous analyses, an alternative method based on the ratio of the FONLL cross sections for feed-down and prompt D mesons was also used in the estimation of the systematic uncertainties. In this analysis it was no longer used, on the basis of the observation that FONLL calculations at LHC energies provide a good description of the production cross sections of B0, B+ and B0
s mesons at both central and for-ward rapidity, while it underestimates prompt charm produc-tion [43–48]. Hence, the uncertainty due to the B feed-down correction is significantly reduced and more symmetric as compared to our previous publications.
The uncertainty on the D-meson production cross section normalisation has a contribution from the 3.5% uncertainty on the minimum-bias trigger cross section [37] and a contri-bution from the uncertainties on the branching ratios of the considered D-meson decay channels (see Table1).
The total systematic uncertainties, which are obtained as a quadratic sum of the contributions listed in Table1, are reduced by a factor that ranges from 1.5 to 5, depending on D-meson species and pT interval, with respect to pre-vious publications [14,16]. The systematic uncertainties on PID, tracking and selection efficiencies are mostly correlated among the different pTintervals, while the raw-yield extrac-tion uncertainty is mostly uncorrelated.
4 Results
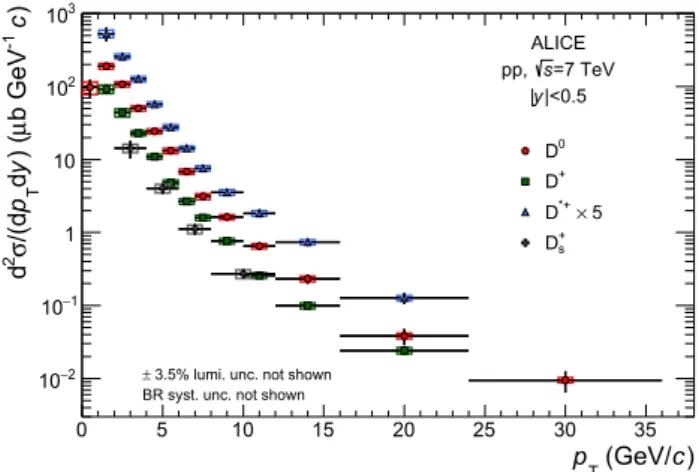
The pT-differential cross sections for prompt D0, D+, D∗+ and D+s production in|y| < 0.5 are shown in Fig.3. The error bars represent the statistical uncertainties, while the systematic uncertainties are shown as boxes around the data points. The symbols are positioned horizontally at the centre of each pTinterval, with the horizontal bars representing the width of the pTinterval. For all D-meson species, the results
) c (GeV/ T p 0 5 10 15 20 25 30 35 )c -1 b GeVµ ) (y d T p /(dσ 2 d 2 − 10 1 − 10 1 10 2 10 3 10 ALICE =7 TeV s pp, |<0.5 y |
3.5% lumi. unc. not shown ±
BR syst. unc. not shown
0 D + D 5 × *+ D + s D
Fig. 3 pT-differential inclusive production cross section of prompt D0,
D+, D∗+and D+s mesons in pp collisions at √s= 7 TeV. Statistical uncertainties (bars) and systematic uncertainties (boxes) are shown. The D∗+cross section is scaled by a factor of 5 for better visibility
are consistent within uncertainties with those reported in our previous publications on charmed-meson cross sections in pp collisions at √s= 7 TeV [14,16], but the total uncertain-ties (sum in quadrature of statistical and systematic errors) are reduced by a factor 1.5–4, depending on the D-meson species and the pTinterval. The D0-meson cross section in the interval 0 < pT <1 GeV/c is obtained from the anal-ysis without decay vertex reconstruction described in Ref. [17]. At higher pT, the results of the analysis presented in this paper, based on geometrical selections on the displaced decay vertex, are more precise than those obtained without decay vertex reconstruction.
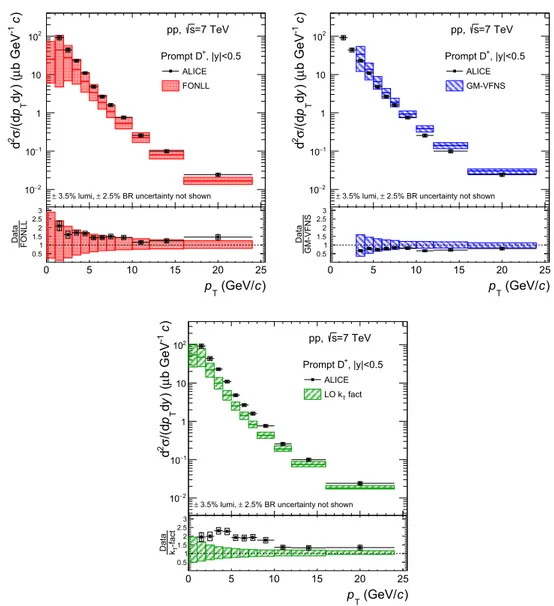
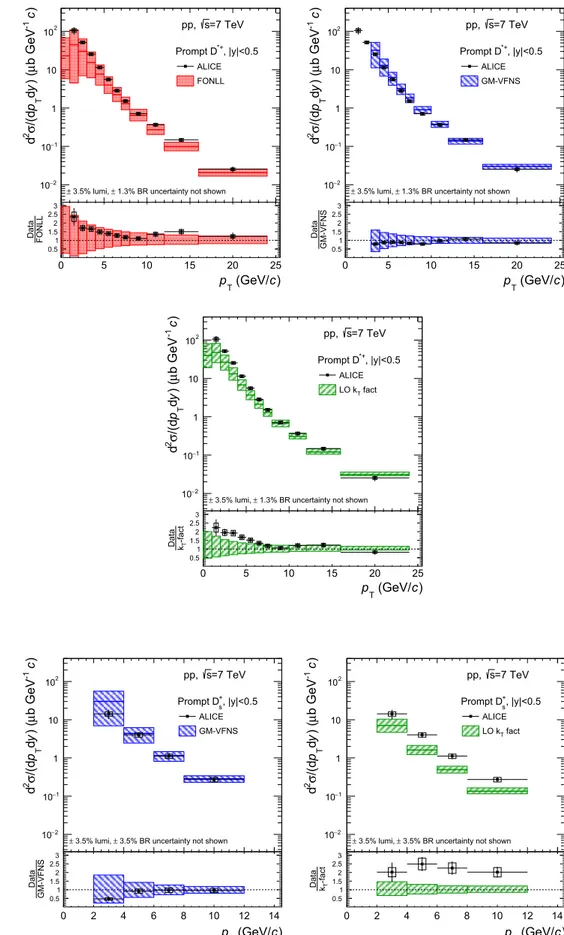
In Figs.4,5,6and7, the measured pT-differential cross sections are compared with results from perturbative QCD calculations, two of which are based on collinear factorisa-tion (FONLL [6,7] and GM-VFNS [3–5]) and one is a lead-ing order (LO) calculation based on kT-factorisation [9]. The results of these calculations, performed in the same pT inter-vals of the measurement, are shown as filled boxes spanning the theoretical uncertainties and a solid line representing the values obtained with the central values of the pQCD param-eters. The theoretical uncertainties are estimated in all the three frameworks by varying the renormalisation and fac-torisation scales. In the FONLL and kT-factorisation calcu-lations also the effect of the charm-quark mass uncertainty is considered. In the FONLL and GM-VFNS calculations, the CTEQ6.6 PDFs [49] were used, and the uncertainty on the PDFs was included in the FONLL error boxes. The LO kT -factorisation calculations were performed with an updated set of unintegrated gluon-distribution functions computed from the recent MMHT2014-LO PDFs [50]. For this reason, the comparison to the measured D0-meson cross section differs from that reported in Ref. [17]. In the FONLL calculation, the fragmentation fractions f (c→ D), i.e. the fractions of
charm quarks hadronising into each D-meson species, were taken from Ref. [51]. For the D+
s mesons, only the com-parisons to GM-VFNS and LO kT-factorisation predictions are shown, because a calculation of the D+s production cross section within the FONLL framework is not available. The central value of the GM-VFNS predictions lies systemati-cally above the data, while that of the FONLL predictions lies below the data. For FONLL, this feature was observed also at other values of √s, from 0.2 to 13 TeV [11,12,15,19– 21]. The LO kT-factorisation calculation describes the data within uncertainties for pT<2 GeV/c and pT>10 GeV/c, while in the interval 2 < pT < 10 GeV/c the predictions underestimate the measured production cross sections.
The average transverse momentum ⟨pT⟩ of prompt D0 mesons was measured by fitting the cross section reported in Fig.4with a power-law function:
f ( pT)= C pT
(1+ (pT/p0)2)n, (3)
where C, p0and n are the free parameters. The prompt-D0 ⟨pT⟩, defined as the mean value of the fit function, is: ⟨pT⟩prompt D
0
pp, 7 TeV = 2.19 ± 0.06 (stat.) ± 0.04 (syst.) GeV/c. (4) The systematic uncertainty on ⟨pT⟩ was estimated as described in Ref. [17] taking into account separately the con-tributions due to the correlated and uncorrelated systematic uncertainties on the measured pT-differential cross section. The uncertainty due to the fit function was estimated from the spread of the results obtained with different functions and using an alternative method, which is not based on fits to the distribution, but on direct calculations of⟨pT⟩ from the data points.
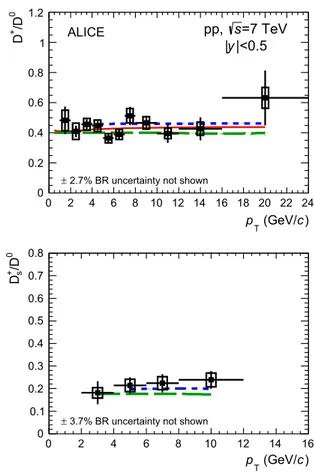
The ratios of the pT-differential cross sections of D0, D+, D∗+and D+s mesons are reported in Fig.8. In the evaluation of the systematic uncertainties on these ratios, the sources of correlated and uncorrelated systematic effects were treated separately. In particular, the contributions of the yield extrac-tion and cut efficiency were considered as uncorrelated, while those of the feed-down from beauty-hadron decays and the tracking efficiency were treated as fully correlated among the different D-meson species. The measured D-meson ratios do not show a significant pTdependence within the experimen-tal uncertainties, thus suggesting a small difference between the fragmentation functions of charm quarks to pseudoscalar (D0, D+and D+s ) and vector (D∗+) mesons and to strange and non-strange mesons. The data are compared to the ratios of the D-meson cross sections from FONLL (only for D0, D+and D∗+mesons), GM-VFNS and LO kT-factorisation pQCD calculations. The ratios of the theoretical predictions were computed assuming their uncertainties to be fully corre-lated among the D-meson species, which results in an almost
Fig. 4 pT-differential production cross section of prompt D0mesons with |y| < 0.5 in the interval 0 < pT<36 GeV/c, in pp collisions at √s= 7 TeV. The data point in
0 < pT<1 GeV/c is obtained from the analysis without decay vertex reconstruction described in Ref. [17]. The cross section is compared to three pQCD calculations: FONLL [7] (top-left panel), GM-VFNS [5] (top-right panel) and a leading order (LO) calculation based on kT-factorisation [9] (bottom panel). The ratios of the data to the three calculated cross sections are shown in the lower part of each panel. In the data-to-theory ratios the 3.5% normalisation uncertainty due to the luminosity determination is not included in the systematic uncertainty on the data points
)c -1 b GeV µ ) (y d T p /(dσ 2 d 2 − 10 1 − 10 1 10 2 10 =7 TeV s pp,
1.0% BR uncertainty not shown ± 3.5% lumi, ± , |y|<0.5 0 Prompt D ALICE FONLL ) c (GeV/ T p 0 5 10 15 20 25 30 35 FONLL Data 0.51 1.52 2.53 )c -1 b GeV µ ) (y d T p /(dσ 2 d 2 − 10 1 − 10 1 10 2 10 =7 TeV s pp,
1.0% BR uncertainty not shown ± 3.5% lumi, ± , |y|<0.5 0 Prompt D ALICE GM-VFNS ) c (GeV/ T p 0 5 10 15 20 25 30 35 GM-VFNS Data 0.51 1.52 2.53 )c -1 b GeVµ ) (y d T p /(dσ 2 d 2 − 10 1 − 10 1 10 2 10 =7 TeV s pp,
1.0% BR uncertainty not shown ± 3.5% lumi, ± , |y|<0.5 0 Prompt D ALICE fact T LO k ) c (GeV/ T p 0 5 10 15 20 25 30 35 -factT k Data 0.51 1.52 2.53
complete cancellation of the uncertainties in the ratio. Note that in all these pQCD calculations, the relative abundances of the different D-meson species are not predicted by the theory, but the fragmentation fractions, f (c→ D), are taken from the experimental measurements [7,9,51–54]. In the FONLL and GM-VFNS frameworks, the pTdependence of the ratios of the D-meson production cross sections arises from the dif-ferent fragmentation functions used to model the transfer of energy from the charm quark to a specific D-meson species [52,53,55], and from the different contribution from decays of higher excited states. The parton fragmentation models used in the calculations provide an adequate description of the measured data. In the LO kT-factorisation calculations, the same fragmentation function (Peterson [56]) is used for D0, D+and D+s mesons, resulting in the same shape of the
pTdistributions of these three meson species, while the frag-mentation functions for vector mesons from Ref. [57] are used for D∗+mesons [9].
The ratios of D0-meson production cross sections in dif-ferent rapidity intervals, which are expected to be sensitive to the gluon PDF at small values of Bjorken-x [22], were com-puted from our measurement in the central rapidity region (|y| < 0.5) and the results reported by the LHCb collab-oration for pp collisions at √s = 7 TeV in different y intervals at forward rapidity [19]. The results are reported in Fig.9, where the central-to-forward ratios are shown as a function of pT for three different y intervals at forward rapidity: 2 < y < 2.5 (left panel), 3 < y < 3.5 (middle panel), 4 < y < 4.5 (right panel). The error bars represent the total uncertainty obtained from the propagation of the statistical and systematic uncertainties on the pT-differential cross sections. The measured ratios are compared to FONLL calculations, shown as boxes in Fig.9. The central-to-forward ratios computed using the central values of the factorisation and renormalisation scales are found to describe the data within their uncertainties. The upper edge of the FONLL uncertainty band, which is also in agreement with the
mea-Fig. 5 pT-differential production cross section of prompt D+mesons with |y| < 0.5 in the interval 1 < pT<24 GeV/c, in pp collisions at √s= 7 TeV. The cross section is compared to three pQCD calculations: FONLL [7] (top-left panel), GM-VFNS [5] (top-right panel) and a leading order (LO) calculation based on kT-factorisation [9] (bottom panel). The ratios of the data to the three calculated cross sections are shown in the lower part of each panel. In the data-to-theory ratios the 3.5% normalisation uncertainty due to the luminosity determination is not included in the systematic uncertainty on the data points
)c -1 b GeVµ ) (y d T p /(dσ 2 d 2 − 10 1 − 10 1 10 2 10 pp, s=7 TeV
2.5% BR uncertainty not shown ± 3.5% lumi, ± , |y|<0.5 + Prompt D ALICE FONLL ) c (GeV/ T p 0 5 10 15 20 25 FONLL Data 0.51 1.52 2.53 )c -1 b GeVµ ) (y d T p /(dσ 2 d 2 − 10 1 − 10 1 10 2 10 pp, s=7 TeV
2.5% BR uncertainty not shown ± 3.5% lumi, ± , |y|<0.5 + Prompt D ALICE GM-VFNS ) c (GeV/ T p 0 5 10 15 20 25 GM-VFNS Data 0.51 1.52 2.53 )c -1 b GeVµ ) (y d T p /(dσ 2d 2 − 10 1 − 10 1 10 2 10 pp, s=7 TeV
2.5% BR uncertainty not shown ± 3.5% lumi, ± , |y|<0.5 + Prompt D ALICE fact T LO k ) c (GeV/ T p 0 5 10 15 20 25 -factT k Data 0.51 1.52 2.53
sured values of the central-to-forward ratios, is determined by the calculations with factorisation scale µF = 2 mT, where
mT=
$
p2
T+ m2cand mc= 1.5 GeV/c2. The low edge of the FONLL uncertainty band is determined by the calculations with µF= 0.5 mT, which provide a worse description of the measured central-to-forward ratios at low pT for the most forward rapidity interval. Note that in this forward rapidity interval, the FONLL calculation with µF = 0.5 mTuses the PDFs for Bjorken-x values reaching down to about 10−5, a region that is not constrained by experimental data, and below Q2= (1.3 GeV/c)2, where the CTEQ6.6 PDFs [49] are kept constant to their values at (1.3 GeV/c)2.
The visible cross sections of prompt D mesons, obtained by integrating the pT-differential cross sections in the mea-sured pT range, are reported in Table2. In addition, for D0 mesons the cross sections integrated over the pTintervals of the D+, D∗+and D+
s measurements are shown. The system-atic uncertainty was defined by propagating the yield extrac-tion uncertainties as uncorrelated among pTintervals and all
the other uncertainties as correlated. These values were used to compute the ratios of the pT-integrated D-meson produc-tion cross secproduc-tions, which are reported in Table3. The sys-tematic uncertainties on the ratios were computed taking into account the sources correlated and uncorrelated among the different D-meson species as described above. The measured ratios are compatible within uncertainties with the results at √s = 2.76 TeV [15] and with the measurements of the LHCb collaboration at forward rapidity (2.0 < y < 4.5) at three different collision energies √s = 5, 7 and 13 TeV [19–21]. The measured pT-integrated production ratios are also compatible with the charm-quark fragmentation frac-tions f (c→ D) measured in e+e−collisions from the com-pilation in [51]. These results indicate that the fragmentation fractions of charm quarks into different D-meson species do not vary substantially with rapidity, collision energy and col-liding system.
The production cross sections per unit of rapidity, dσ/dy, at mid-rapidity were computed for each meson species by
Fig. 6 pT-differential production cross section of prompt D∗+mesons with |y| < 0.5 in the interval 1 < pT<24 GeV/c, in pp collisions at √s= 7 TeV. The cross section is compared to three pQCD calculations: FONLL [7] (top-left panel), GM-VFNS [5] (top-right panel) and a leading order (LO) calculation based on kT-factorisation [9] (bottom panel). The ratios of the data to the three calculated cross sections are shown in the lower part of each panel. In the data-to-theory ratios the 3.5% normalisation uncertainty due to the luminosity determination is not included in the systematic uncertainty on the data points
)c -1 b GeVµ ) (y d T p /(dσ 2 d 2 − 10 1 − 10 1 10 2 10 pp, s=7 TeV
1.3% BR uncertainty not shown ± 3.5% lumi, ± , |y|<0.5 *+ Prompt D ALICE FONLL ) c (GeV/ T p 0 5 10 15 20 25 FONLL Data 0.51 1.52 2.53 )c -1 b GeVµ ) (y d T p /(dσ 2d 2 − 10 1 − 10 1 10 2 10 pp, s=7 TeV
1.3% BR uncertainty not shown ± 3.5% lumi, ± , |y|<0.5 *+ Prompt D ALICE GM-VFNS ) c (GeV/ T p 0 5 10 15 20 25 GM-VFNS Data 0.51 1.52 2.53 )c -1 b GeVµ ) (y d T p /(dσ 2 d 2 − 10 1 − 10 1 10 2 10 pp, s=7 TeV
1.3% BR uncertainty not shown ± 3.5% lumi, ± , |y|<0.5 *+ Prompt D ALICE fact T LO k ) c (GeV/ T p 0 5 10 15 20 25 -factT k Data 0.51 1.52 2.53 Fig. 7 pT-differential
production cross section of prompt D+
s mesons with |y| < 0.5 in the interval 2 < pT<12 GeV/c, in pp collisions at √s= 7 TeV. The cross section is compared to two pQCD calculations: GM-VFNS [5] (left panel) and a leading order (LO) calculation based on kT-factorisation [9] (right panel). The ratios of the data to the calculated cross sections are shown in the lower part of each panel. In the data-to-theory ratios the 3.5% normalisation uncertainty due to the luminosity determination is not included in the systematic uncertainty on the data points
)c -1 b GeVµ ) (y d T p /(dσ 2 d 2 − 10 1 − 10 1 10 2 10 pp, s=7 TeV
3.5% BR uncertainty not shown ± 3.5% lumi, ± , |y|<0.5 + s Prompt D ALICE GM-VFNS ) c (GeV/ T p 0 2 4 6 8 10 12 14 GM-VFNS Data 0.51 1.52 2.53 )c -1 b GeVµ ) (y d T p /(dσ 2 d 2 − 10 1 − 10 1 10 2 10 pp, s=7 TeV
3.5% BR uncertainty not shown ± 3.5% lumi, ± , |y|<0.5 + s Prompt D ALICE fact T LO k ) c (GeV/ T p 0 2 4 6 8 10 12 14 -factT k Data 0.51 1.52 2.53
) c (GeV/ T p 0 2 4 6 8 10 12 14 16 18 20 22 24 0 /D + D 0 0.2 0.4 0.6 0.8 1 1.2 ALICE
2.7% BR uncertainty not shown ± =7 TeV s pp, |<0.5 y | ) c (GeV/ T p 0 2 4 6 8 10 12 14 16 18 20 22 24 0 /D + D* 0 0.2 0.4 0.6 0.8 1 1.2
0.7% BR uncertainty not shown ± ALICE FONLL GM-VFNS fact. T LO k ) c (GeV/ T p 0 2 4 6 8 10 12 14 16 0 /D + s D 0 0.1 0.2 0.3 0.4 0.5 0.6 0.7 0.8
3.7% BR uncertainty not shown ± ) c (GeV/ T p 0 2 4 6 8 10 12 14 16 + /D + s D 0 0.1 0.2 0.3 0.4 0.5 0.6 0.7 0.8
4.3% BR uncertainty not shown ±
Fig. 8 Ratios of D-meson production cross sections as a function of
pT. Predictions from FONLL, GM-VFNS and LO kT-factorisation cal-culations are also shown. For the pQCD calcal-culations the line shows the
ratio of the central values of the theoretical cross sections, while the shaded areais defined by the ratios computed from the upper and lower limits of the theoretical uncertainty band
) c (GeV/ T p 0 1 2 3 4 5 6 7 8 9 central / forward yd T p /dσ 2 d 0 0.5 1 1.5 2 2.5 Data FONLL
central: ALICE |y|<0.5 forward: LHCb 2<y<2.5 = 7 TeV s mesons, pp 0 D ) c (GeV/ T p 0 1 2 3 4 5 6 7 8 9 central / forward yd T p /dσ 2d 0 0.5 1 1.5 2 2.5 3 3.5
central: ALICE |y|<0.5 forward: LHCb 3<y<3.5 ) c (GeV/ T p 0 1 2 3 4 5 6 7 8 9 central / forward yd T p /dσ 2 d 0 1 2 3 4 5 6
central: ALICE |y|<0.5 forward: LHCb 4<y<4.5
Fig. 9 Ratios of D0-meson production cross section per unit of rapidity
at mid-rapidity (|y| < 0.5) to that measured by the LHCb Collaboration [19] in three rapidity ranges, 2 < y < 2.5 (left panel), 3 < y < 3.5 (middle panel), 4 < y < 4.5 (right panel), as a function of pT. The
LHCb measurement were multiplied by 2 to refer them to one unit of rapidity. The error bars represent the total (statistical and systematic) uncertainty on the measurement. Predictions from FONLL calculations are compared to the data points
extrapolating the visible cross section to the full pT range. The extrapolation factor for a given D-meson species was defined as the ratio between the total production cross sec-tion in|y| < 0.5 and that in the experimentally covered phase space, both of them calculated with the FONLL central
parameters. The systematic uncertainty on the extrapolation factor was estimated by considering the contributions due to (i) the uncertainties on the CTEQ6.6 PDFs [49] and (ii) the variation of the charm-quark mass and the renormalisation and factorisation scales in the FONLL calculation, as
pro-Table 2 Visible production
cross sections of prompt D mesons in|y| < 0.5 in pp collisions at √s= 7 TeV
Kinematic range Visible cross section (µb)
D0 0 < pT<36 GeV/c 500± 36(stat) ± 39(syst) ± 18(lumi) ± 5(BR) 1 < pT<24 GeV/c 402± 24(stat) ± 28(syst) ± 14(lumi) ± 4(BR) 2 < pT<12 GeV/c 210± 7(stat) ± 14(syst) ± 7(lumi) ± 2(BR) D+ 1 < pT<24 GeV/c 182± 14(stat) ± 20(syst) ± 6(lumi) ± 5(BR) 2 < pT<12 GeV/c 89± 3(stat) ± 9(syst) ± 3(lumi) ± 2(BR) D∗+ 1 < pT<24 GeV/c 207± 24(stat) ± 20(syst) ± 7(lumi) ± 3(BR) 2 < pT<12 GeV/c 101± 6(stat) ± 8(syst) ± 4(lumi) ± 1(BR) D+s 2 < pT<12 GeV/c 40± 8(stat) ± 5(syst) ± 1(lumi) ± 1(BR)
Table 3 Ratios of the measured
pT-integrated cross sections of prompt D mesons in|y| < 0.5 in pp collisions at √s= 7 TeV
Kinematic range Production cross section ratio σ (D+)/σ (D0) 1 < p
T<24 GeV/c 0.45± 0.04(stat) ± 0.05(syst) ± 0.01(BR) σ (D∗+)/σ (D0) 1 < p
T<24 GeV/c 0.52± 0.07(stat) ± 0.05(syst) ± 0.01(BR) σ (D+s)/σ (D0) 2 < p
T<12 GeV/c 0.19± 0.04(stat) ± 0.02(syst) ± 0.01(BR) σ (D+s)/σ (D+) 2 < pT<12 GeV/c 0.45± 0.09(stat) ± 0.06(syst) ± 0.02(BR)
Table 4 Production cross
sections of prompt D mesons in |y| < 0.5 and full pTrange in pp collisions at √s= 7 TeV
Extr. factor to pT>0 dσ/dy||y|<0.5(µb) D0 1.0002+0.0004
−0.0002 500± 36(stat) ± 39(syst) ± 18(lumi) ± 5(BR)
D+ 1.25+0.29
−0.09 227± 18(stat) ± 25(syst) ± 8(lumi) ± 6(BR)+52−16(extrap)
D∗+ 1.21+0.28
−0.08 251± 29(stat) ± 24(syst) ± 9(lumi) ± 3(BR)+58−16(extrap)
D+s 2.23+0.71
−0.65 89± 18(stat) ± 11(syst) ± 3(lumi) ± 3(BR)+28−26(extrap)
posed in [7]. For D0mesons, which are measured down to
pT = 0, the extrapolation factor accounts only for the very small contribution of D-mesons with pT >36 GeV/c and it has therefore a value very close to unity with negligible uncertainty. In the case of D+s mesons, for which a FONLL prediction is not available, the central value of the extrapo-lation factor was computed from the prediction based on the
pT-differential cross section of charm quarks from FONLL, the fractions f (c→ D+s )and f (c→ D∗+s ) from ALEPH [54], and the fragmentation functions from [57], which have one parameter, r, that was set to 0.1 as done in FONLL [53]. The D∗+s mesons produced in the c quark fragmentation were made to decay with PYTHIA and the resulting D+
s mesons were summed to the primary ones to obtain the prompt yield. An additional contribution to the systematic uncertainty was assigned for D+
s mesons based on the envelope of the results obtained using the FONLL pT-differential cross sections of D0, D+and D∗+mesons to compute the D+s extrapolation factor. The resulting values for the extrapolation factors and for the prompt D-meson production cross sections per unit of rapidity dσ/dy are reported in Table4.
The cc production cross section per unit of rapidity at mid-rapidity (|y| < 0.5) was calculated by dividing the prompt D0-meson cross section by the fraction of charm quarks hadronising into D0mesons f (c→ D0)and
correct-ing for the different shapes of the distributions of yD0and ycc (cc pair rapidity). The correction factor and its uncertainty were extracted from FONLL and MNR NLO pQCD [58] cal-culations together with PYTHIA 6 [38] and POWHEG [59] simulations, as described in detail in Ref. [17]. For the frag-mentation fraction, the value f (c→ D0)= 0.542 ± 0.024 derived in Ref. [51] by averaging the measurements from e+e− collisions at LEP was used. As pointed out in Refs. [60,61], measurements in e+e−, ep and pp collisions agree within uncertainties, supporting the hypothesis that fragmen-tation is independent of the specific production process.1The
resulting cc cross section per unit of rapidity at mid-rapidity is:
dσpp, 7 TeVcc /dy!!!
|y|<0.5= 954 ± 69 (stat) ± 74 (syst) ± 33 (lumi) ± 42 (FF) ± 31 (rap.shape) µb. (5) We verified that the precision of the cc production cross-section determination does not improve if the results calcu-lated from D+, D∗+and D+s mesons, which have significantly 1 In Ref. [61], an average of the charm fragmentation fractions over the measurements from all collision systems is calculated, imposing the constraint that the sum of all weakly-decaying charmed hadrons is unity, which results in f (c → D0)= 0.6086 ± 0.0076 (about 11% larger that the value from [51]).
larger extrapolation uncertainties as compared to the D0one, are included via a weighted average procedure, as done in Ref. [15]. The total production cross section of prompt D0 mesons (average of particles and antiparticles) was calculated by extrapolating to full phase space the cross section mea-sured at mid-rapidity. The extrapolation factor was defined as the ratio of the D0production cross sections in full rapidity and in|y| < 0.5 calculated with the FONLL central parame-ters: 8.56+2.51−0.42. The systematic uncertainty on the extrapola-tion factor was estimated with the same procedure described above for the pT extrapolation. The resulting cross section is:
σpp, 7 TeVprompt D0 = 4.28 ± 0.31 (stat) ± 0.33 (syst)+1.26−0.24(extr.)
± 0.15 (lumi) ± 0.04 (BR) mb. (6)
The total charm production cross section was calculated by dividing the total prompt D0-meson production cross section by the fragmentation fraction reported above. The resulting cc production cross section in pp collisions at √s= 7 TeV is:
σpp, 7 TeVcc (ALICE)= 7.89 ± 0.57 (stat.)
± 0.61 (syst.)+2.32−0.45(extr.)± 0.28 (lumi.) ± 0.35 (FF) mb, (7) which is consistent with the value of Ref. [17] but has smaller statistical and systematic uncertainties. It is also compatible within uncertainties with the total charm production cross section reported by the ATLAS collaboration [13], which is calculated from D+ and D∗+ measurements in|η| < 2.1 and pT > 3.5 GeV/c and has larger uncertainties on the extrapolation to full kinematic phase space as compared to our result.
A more precise determination of the cc production cross section can be obtained by summing our measurement of the prompt D0-meson cross section in|y| < 0.5 and the LHCb result in 2 < y < 4.5 for 0 < pT < 8 GeV/c [19], and extrapolating to full rapidity and pTvia the ratio of FONLL calculations of the cross sections in full phase space and in the measured y and pT intervals exploiting the symmetry around y= 0. The result for the cc production cross section is:
σpp, 7 TeVcc (ALICE, LHCb)= 7.44 ± 0.14 (stat.)
± 0.46 (syst.)+0.13−0.07(extr.) ± 0.33 (FF) mb, (8) where the +0.13 mb extrapolation uncertainty is deter-mined by FONLL calculations with factorisation scale µF= 0.5 mT, which do not describe the measured central-to-forward ratios of Fig.9. If this µF value is not considered, the extrapolation uncertainty is reduced to±0.07 mb.
5 Summary
We have presented a new measurement of the inclusive pT -differential production cross sections of prompt D0, D+, D∗+ and D+
s mesons at mid-rapidity (|y| < 0.5) in pp collisions at a centre-of-mass energy of √s = 7 TeV. The measure-ments cover the transverse-momentum interval 0 < pT < 36 GeV/c for D0mesons, 1 < p
T<24 GeV/c for D+and D∗+mesons, and 2 < pT <12 GeV/c for D+s mesons. As compared to previously published results based on the same data sample [14,16], the present results have an extended pT coverage and total uncertainties reduced by a factor of about 1.5–4 depending on the D-meson species and pT. The mea-surements cover complementary ranges in pT and y with respect to those of the ATLAS (3.5 < pT < 100 GeV/c, |η| < 2.1 [13]) and LHCb (0 < pT<8 GeV/c, 2 < y < 4.5 [19]) Collaborations at the same centre-of-mass energy. The
pT-differential cross sections are described within uncertain-ties in the full pTrange by the FONLL and GM-VFNS per-turbative QCD calculations, which are based on collinear factorisation, while a leading-order calculation based on kT factorisation underestimates the measured cross sections for 2 < pT<10 GeV/c. The pT-differential ratios of our mea-surement at mid-rapidity and LHCb meamea-surements at for-ward rapidity [19] are described by FONLL calculations. These central-to-forward ratios, once complemented with similar measurements at different centre-of-mass energies, could provide sensitivity to the gluon PDF at small values of Bjorken-x [22]. The ratios of the cross sections of the four D-meson species were found to be compatible with the LHCb measurements at forward rapidity and different colli-sion energies as well as with results from e+e−collisions, indicating that the fragmentation fractions of charm quarks into different D-meson species do not vary substantially with rapidity, collision energy and colliding system.
The new measurement also allowed for a more accurate determination of the pT-integrated cc production cross sec-tion at mid-rapidity in pp collisions at √s= 7 TeV:
dσpp, 7 TeVcc /dy!!!
|y|<0.5= 954 ± 69 (stat) ± 97 (tot. syst.) µb. In particular, the total systematic uncertainty of this measure-ment is about±10%, while it was+13−21% for the previously-published measurement [17].
The total cc production cross section in full phase space was calculated by combining the above measurement at mid-rapidity with that at forward mid-rapidity by the LHCb Collabo-ration:
σpp, 7 TeVcc (ALICE, LHCb)= 7.44 ± 0.14 (stat.) ± 0.58 (tot. syst.) mb. Acknowledgements The ALICE Collaboration would like to thank
the construction of the experiment and the CERN accelerator teams for the outstanding performance of the LHC complex. The ALICE Collaboration gratefully acknowledges the resources and support pro-vided by all Grid centres and the Worldwide LHC Computing Grid (WLCG) collaboration. The ALICE Collaboration acknowledges the following funding agencies for their support in building and run-ning the ALICE detector: A. I. Alikhanyan National Science Labo-ratory (Yerevan Physics Institute) Foundation (ANSL), State Commit-tee of Science and World Federation of Scientists (WFS), Armenia; Austrian Academy of Sciences and Nationalstiftung für Forschung, Technologie und Entwicklung, Austria; Ministry of Communications and High Technologies, National Nuclear Research Center, Azerbai-jan; Conselho Nacional de Desenvolvimento Científico e Tecnológico (CNPq), Universidade Federal do Rio Grande do Sul (UFRGS), Finan-ciadora de Estudos e Projetos (Finep) and Fundação de Amparo à Pesquisa do Estado de São Paulo (FAPESP), Brazil; Ministry of Science and Technology of China (MSTC), National Natural Science Founda-tion of China (NSFC) and Ministry of EducaFounda-tion of China (MOEC), China; Ministry of Science, Education and Sport and Croatian Science Foundation, Croatia; Ministry of Education, Youth and Sports of the Czech Republic, Czech Republic; The Danish Council for Indepen-dent Research|Natural Sciences, the Carlsberg Foundation and Danish National Research Foundation (DNRF), Denmark; Helsinki Institute of Physics (HIP), Finland; Commissariat à l’Energie Atomique (CEA) and Institut National de Physique Nucléaire et de Physique des Particules (IN2P3) and Centre National de la Recherche Scientifique (CNRS), France; Bundesministerium für Bildung, Wissenschaft, Forschung und Technologie (BMBF) and GSI Helmholtzzentrum für Schwerionen-forschung GmbH, Germany; Ministry of Education, Research and Reli-gious Affairs, Greece; National Research, Development and Innovation Office, Hungary; Department of Atomic Energy Government of India (DAE) and Council of Scientific and Industrial Research (CSIR), New Delhi, India; Indonesian Institute of Science, Indonesia; Centro Fermi-Museo Storico della Fisica e Centro Studi e Ricerche Enrico Fermi and Istituto Nazionale di Fisica Nucleare (INFN), Italy; Institute for Innovative Science and Technology, Nagasaki Institute of Applied Sci-ence (IIST), Japan Society for the Promotion of SciSci-ence (JSPS) KAK-ENHI and Japanese Ministry of Education, Culture, Sports, Science and Technology (MEXT), Japan; Consejo Nacional de Ciencia (CONA-CYT) y Tecnología, through Fondo de Cooperación Internacional en Ciencia y Tecnología (FONCICYT) and Dirección General de Asuntos del Personal Academico (DGAPA), Mexico; Nationaal instituut voor subatomaire fysica (Nikhef), Netherlands; The Research Council of Norway, Norway; Commission on Science and Technology for Sus-tainable Development in the South (COMSATS), Pakistan; Pontificia Universidad Católica del Perú, Peru; Ministry of Science and Higher Education and National Science Centre, Poland; Korea Institute of Sci-ence and Technology Information and National Research Foundation of Korea (NRF), Republic of Korea; Ministry of Education and Sci-entific Research, Institute of Atomic Physics and Romanian National Agency for Science, Technology and Innovation, Romania; Joint Insti-tute for Nuclear Research (JINR), Ministry of Education and Science of the Russian Federation and National Research Centre Kurchatov Insti-tute, Russia; Ministry of Education, Science, Research and Sport of the Slovak Republic, Slovakia; National Research Foundation of South Africa, South Africa; Centro de Aplicaciones Tecnológicas y Desar-rollo Nuclear (CEADEN), Cubaenergía, Cuba, Ministerio de Ciencia e Innovacion and Centro de Investigaciones Energéticas, Medioambi-entales y Tecnológicas (CIEMAT), Spain; Swedish Research Council (VR) and Knut and Alice Wallenberg Foundation (KAW), Sweden; European Organization for Nuclear Research, Switzerland; National Science and Technology Development Agency (NSDTA), Suranaree University of Technology (SUT) and Office of the Higher Educa-tion Commission under NRU project of Thailand, Thailand; Turkish Atomic Energy Agency (TAEK), Turkey; National Academy of Sci-ences of Ukraine, Ukraine; Science and Technology Facilities Council
(STFC), UK; National Science Foundation of the United States of Amer-ica (NSF) and United States Department of Energy, Office of Nuclear Physics (DOE NP), USA.
Open Access This article is distributed under the terms of the Creative
Commons Attribution 4.0 International License (http://creativecomm ons.org/licenses/by/4.0/), which permits unrestricted use, distribution, and reproduction in any medium, provided you give appropriate credit to the original author(s) and the source, provide a link to the Creative Commons license, and indicate if changes were made.
Funded by SCOAP3.
References
1. J.C. Collins, D.E. Soper, G.F. Sterman, Factorization of hard pro-cesses in QCD. Adv. Ser. Direct. High Energy Phys. 5, 1–91 (1989).
arXiv:hep-ph/0409313[hep-ph]
2. S. Catani, M. Ciafaloni, F. Hautmann, High-energy factorization and small x heavy flavor production. Nucl. Phys. B 366, 135–188 (1991)
3. B.A. Kniehl, G. Kramer, I. Schienbein, H. Spiesberger, Inclusive D*+- production in p anti-p collisions with massive charm quarks. Phys. Rev. D 71, 014018 (2005).arXiv:hep-ph/0410289[hep-ph] 4. B.A. Kniehl, G. Kramer, I. Schienbein, H. Spiesberger, Collinear subtractions in hadroproduction of heavy quarks. Eur. Phys. J. C
41, 199–212 (2005).arXiv:hep-ph/0502194[hep-ph]
5. B.A. Kniehl, G. Kramer, I. Schienbein, H. Spiesberger, Inclusive charmed-meson production at the CERN LHC. Eur. Phys. J. C 72, 2082 (2012).arXiv:1202.0439[hep-ph]
6. M. Cacciari, M. Greco, P. Nason, The pTspectrum in heavy fla-vor hadroproduction. JHEP 05, 007 (1998).arXiv:hep-ph/9803400
[hep-ph]
7. M. Cacciari, S. Frixione, N. Houdeau, M.L. Mangano, P. Nason, G. Ridolfi, Theoretical predictions for charm and bottom production at the LHC. JHEP 10, 137 (2012).arXiv:1205.6344[hep-ph] 8. M. Luszczak, R. Maciula, A. Szczurek, Nonphotonic electrons at
RHIC within k(t)-factorization approach and with experimental semileptonic decay functions. Phys. Rev. D 79, 034009 (2009).
arXiv:0807.5044[hep-ph]
9. R. Maciula, A. Szczurek, Open charm production at the LHC— kt-factorization approach. Phys. Rev. D 87(9), 094022 (2013).
arXiv:1301.3033[hep-ph]
10. A. Andronic et al., Heavy-flavour and quarkonium production in the LHC era: from proton-proton to heavy-ion collisions. Eur. Phys. J. C 76(3), 107 (2016).arXiv:1506.03981[nucl-ex]
11. STAR Collaboration, L. Adamczyk et al., Measurements of D0and D∗+production in pp collisions at √s= 200 GeV. Phys. Rev. D
86, 072013 (2012).arXiv:1204.4244[nucl-ex]
12. CDF Collaboration, D. Acosta et al., Measurement of prompt charm meson production cross sections in p¯p collisions at √s = 1.96 TeV. Phys. Rev. Lett. 91, 241804 (2003).
arXiv:hep-ex/0307080[hep-ex]
13. ATLAS Collaboration, G. Aad et al., Measurement of D∗±, D± and Ds± meson production cross sections in pp collisions at √s= 7 TeV with the ATLAS detector. Nucl. Phys. B 907, 717–763 (2016).arXiv:1512.02913[hep-ex]
14. ALICE Collaboration, B. Abelev et al., Measurement of charm production at central rapidity in proton–proton collisions at √s= 7 TeV. JHEP 01, 128 (2012).arXiv:1111.1553[hep-ex]
15. ALICE Collaboration, B. Abelev et al., Measurement of charm production at central rapidity in proton–proton collisions at √s= 2.76 TeV. JHEP 07, 191 (2012).arXiv:1205.4007[hep-ex]