AEROSOL EMISSION FACTORS ESTIMATED
FOR HARVEST THRESHING
AND PLOUGHING IN PO VALLEY
CHIARA TELLOLI,ANTONELLA MALAGUTIMIHAELA MIRCEA,MASSIMO BERICO ANTONIO PIERSANTI,LUISELLA CIANCARELLA Department of Sustainability Models and Technologies for Risk Reduction Division Atmospheric Pollution Laboratory
Bologna Resea
Bologna Research Centre
RT/2017/13/ENEA
ITALIAN NATIONAL AGENCY FOR NEW TECHNOLOGIES, ENERGY AND SUSTAINABLE ECONOMIC DEVELOPMENT
CHIARA TELLOLI, ANTONELLA MALAGUTI MIHAELA MIRCEA, MASSIMO BERICO ANTONIO PIERSANTI, LUISELLA CIANCARELLA
Department of Sustainability Models and Technologies for Risk Reduction Division Atmospheric Pollution Laboratory Bologna Research Centre
AEROSOL EMISSION FACTORS ESTIMATED
FOR HARVEST THRESHING
AND PLOUGHING IN PO VALLEY
RT/2017/13/ENEA
ITALIAN NATIONAL AGENCY FOR NEW TECHNOLOGIES, ENERGY AND SUSTAINABLE ECONOMIC DEVELOPMENT
I rapporti tecnici sono scaricabili in formato pdf dal sito web ENEA alla pagina http://www.enea.it/it/produzione-scientifica/rapporti-tecnici
I contenuti tecnico-scientifici dei rapporti tecnici dell’ENEA rispecchiano l’opinione degli autori e non necessariamente quella dell’Agenzia
The technical and scientific contents of these reports express the opinion of the authors but not necessarily the opinion of ENEA.
AEROSOL EMISSION FACTORS ESTIMATED FOR HARVEST THRESHING AND PLOUGHING IN PO VALLEY
Chiara Telloli, Antonella Malaguti, Mihaela Mircea, Massimo Berico, Antonio Piersanti, Luisella Ciancarella Abstract
Accurate emission factors are required for reliable estimates of agricultural contribution to particulate matter (PM) emissions in the air. This study on the emission factors from agricultural operations per-formed in Po Valley aims to support the development of the National Emission Inventory. The work quantifies the production of aerosol particles using the size distribution of aerosol mass concentrations sampled during wheat harvest and ploughing activities in a coastal zone of Po Valley farmland (Ferrara – Italy). The aerosol was collected downwind of the emission source (combine or tractor according to the agricultural operation) in sea-land breeze conditions with an eight-stage cascade impactor. For each agricultural operation, the aerosol samplers were taken at the same location inside the emitted dust cloud, which corresponds to the maximum aerosol concentration. The area and the volume of air sampled were estimated from the technical characteristics of agricultural machines, position of eight-stage cascade impactor with respect to the machine and images taken during sampling. These data together with aerosol mass size distributions allowed to estimate the emission factors for PM10 and PM2.5: 132.2 and 58.0 mg/m2for harvest threshing and 23.7 and 8.8 mg/m2for ploughing. Based on these new emission factors, the emission contribution of agriculture to total anthropogenic PM10 at regional level was estimated to be between 3% and 5% in highly anthropogenic polluted areas such as Po Valley and up to 12% in low polluted areas such as Basilicata.
Key words: emission factor, wheat harvest, ploughing PM10, PM2.5, air quality, agricultural dust. Riassunto
Stime accurate dei fattori di emissione relativi alla quantità di particolato (PM) emesso in atmosfera da attività agricole come mietitura e aratura, sono necessarie per meglio quantificare il contributo al particolato atmosferico derivante dalle attività agricole. Quanto riportato è il primo studio nazionale per la valutazione dei fattori di emissione del PM derivante dalle principali attività agricole svolte nella Pianura Padana, con l’obiettivo di ottenere dati utili all’implementazione dell’Inventario nazionale delle emissioni. La quantità di PM emesso è stata stimata in base alle concentrazioni in massa delle diverse classi dimensionali di aerosol campionato durante le attività di mietitura del grano e di aratura, con-dotte in aree agricole situate in una zona costiera della Pianura Padana (Ferrara - Italia). L’aerosol è stato campionato utilizzando un impattore a cascata a otto stadi, mantenendosi sottovento alla sor-gente di emissione (seguendo la macchina agricola). Per ogni operazione agricola, i campionamenti sono stati effettuati mantenendo il campionatore nella stessa posizione all’interno della nube di polvere emessa, corrispondente alla massima concentrazione di aerosol. L’area ed il volume di aria campionata sono stati stimati in base alle caratteristiche tecniche delle macchine agricole, alla posizione del cam-pionatore rispetto alla macchina ed in base alle immagini prese durante il campionamento. Questi dati e le analisi della distribuzione dimensionale di massa dell’aerosol, hanno permesso di stimare i fattori di emissione per PM10 e PM2.5: 132,2 e 58,0 mg/m2per la trebbiatura e 23,7 e 8,8 mg/m2per l’aratura. Sulla base di questi nuovi fattori di emissione, il contributo emissivo dell’agricoltura al PM10 antropico totale a livello regionale è stato stimato tra il 3 e il 5% in zone ad alto inquinamento antropico, come la Pianura Padana, e fino al 12% a basso inquinamento antropico, come la Basilicata.
Parole chiave: fattori emissivi, mietitura del grano, aratura, PM10, PM2.5, qualità dell’aria, dust agricolo.
INTRODUCTION
2 MATERIALS AND METHODS 2.1 Ambient sampling 2.2 Methodology
2.3 Laboratory measurements 3 RESULTS AND DISCUSSION
3.1 Emission factors 4 CONCLUSIONS 5 REFERENCES 7 9 9 10 13 14 15 20 22
INDEX
7
1 INTRODUCTION
The continuous growth of population and urbanization has made less distinct the line between urban and rural areas, increasing the contribution of agriculture to urban air pollution (Environment Canada, 2007). A number of studies measuring particulate matter (PM) emissions has reported considerable increase of PM concentrations due to agricultural operations (Kjelgaard et al., 2004; Erisman et al., 2008; Qiu and Pattey, 2008; Kasumba et al., 2011). However, the emission factors (EF) for different agricultural activities are not well known yet. Erisman et al. (2008) reported that agricultural emissions in Europe are responsible for about 20% of PM. The Emission Inventory Guidebook for Europe (2016) reports that the main sources of PM emissions in agriculture are soil cultivation and crop harvesting, which together account for more than 80% of total PM10 emissions from tillage land. Emissions of PM are dependent on climatic conditions, on weather conditions before and while working, on crop and soil type and on cultivation method. No potential controls have been proposed for PM emissions from ploughing operations while emissions during harvesting can be reduced by encapsulating the source of emissions using dust separators (EMEP/EEA, 2013). Also in Italy, agriculture is an important source of PM: in 2009, it accounted for 11% of national total PM10 emissions (ISPRA, 2011).
Several methods have been developed to estimate aerosol emissions. Qiu and Pattey (2008) used a dispersion model, the mass balance method and the trace technique to quantify PM10 emissions from wheat harvest. In Belgium, Bogman et al. (2005) used a multiplicative modelling approach based on the NEI (National Emission Inventory - USEPA, 2004) and CARB methods (California Air Resources Board - CARB, 2003) for different agricultural operations (ploughing, seedbed preparation, sowing, fertilizing, spraying, turning straw, harvesting, pressing hay, grain conveyance and cultivating) and for different crops including wheat. These studies used measured concentrations at fixed points. In California, Cassel et al. (2003) estimated emission factors for a variety of farming operations (tillage procedures such as disking, floating and land planning) using lidar data. Gaffney and Yu (2003) conducted a similar study in San Joaquin Valley for wheat harvesting. Other studies have used vertical profiles of PM10 identified with LIDAR to quantify the emissions of PM10 from different agricultural activities in different regions of North America and New Mexico (Holmén et al., 2001a, b; Flocchini and James, 2001; Madden et al., 2008; Kasumba et al., 2011). Few studies are available in Europe concerning quantification of coarse and fine agricultural dust contribution to PM from field farming operations, but there is no standard procedure for measuring and calculating these emissions. PM dust emissions from agricultural activities are more difficult to quantify than those from stationary sources since the source (agricultural machine) is in continuous movement and the amount of dust produced depends also on meteorological and soil conditions, type of crop and equipment characteristics. However, several methods have been developed to estimate PM emissions: the dispersion model (Bogman, et al., 2005; Lugato, et al., 2010), the mass balance method, the tracer technique (Qiu and Pattey, 2008), fixed measurements and area of field worked (Cassel, et al., 2003; Ottl and Funk, 2007).
8
Holmén et al. (2001b) and Kasumba et al. (2011) estimated the PM emission factors for harvesting and ploughing operations using field measurements from a variety of PM at different horizontal and vertical distances from the agricultural machine and for different areas of field worked. The vertical profiles of wind speed and PM10 concentrations were used to calculate PM fluxes as a function of sampling distance. Hinz (2004) investigated the emission factors from harvest for rye and wheat and from soil cultivation using layer and plume models. Funk and Reuter (2004) calculated the emission of fine particles due to agricultural practices (tillage and ploughing) in the north of Germany, in relation to land use (amount and intensity of tillage operations) and soil moisture conditions. Ottl and Funk (2007) studied the emissions from different agricultural operations (ploughing, harrowing, disking and cultivating) with optical instruments that were fixed in a specific area in the sampling land. This study reported emission factors that differ by a factor of ca. 10, for example emission factor of PM10 during plowing in wet conditions was 120 mg/m3 while in dry conditions was 1045 mg/m3 (Ottl and Funk, 2007). Goossens et al. (2001) showed the dependence of emission factors of aeolian dust on soil state and, thus, on periods of tillage, using fixed samplers for extended periods (15 months) in lower Saxony (Germany).
Here, the agricultural emission factors for wheat harvest threshing and ploughing were estimated using data from field campaigns carried out in the framework of MINNI (Integrated National Model in support to the International Negotiation on Air Pollution) Project in Po Valley. The emission factors were estimated using a new methodology and aerosol measurements performed downwind agricultural machine movements.
9
2 MATERIALS AND METHODS
2.1 Ambi ent sampl i ng
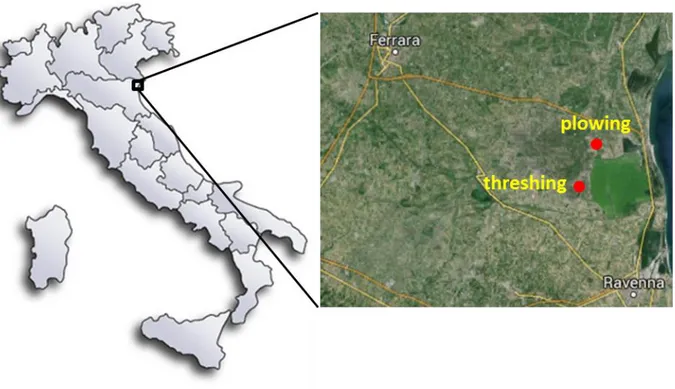
Two measurements campaigns were carried out in June and October 2009 in the eastern part of Po Valley (Argine Agosta - 44° 36' 40.79" N – 12° 04' 10.52'' E, -1m u.s.l.) between Comacchio Valleys and Argenta, (Ferrara - Italy) (Fig. 1). The main cities close to the sampling area are Ferrara and Ravenna. The agricultural area is at ca. 13 km far from the Adriatic Sea.
The soil is classified as silt clay, made from earth sediments transported and deposited by the Po River (Bianchini, et al., 2001).
The measurement campaigns were performed over two different fields that are close to the meteorological station of Regional Agency for Environmental Protection and Prevention of Emilia-Romagna (ARPA Emilia Romagna) CAMSE (44° 36' 01.24" N - 12° 04' 37.72" E). The historical time series (2006-2008 years) of wind direction and velocity recorded at CAMSE in June showed that the highest wind speed is reached in the afternoon and the direction follows a typical sea-land breeze behavior with values between 300°-320° (land breeze) in the morning and between 120°-150° (sea breeze) in the early afternoon. The land breeze is also observed in October but the change into a sea breeze takes place in the late afternoon. Both sea and land breeze are characterized by constant wind velocity and direction for several hours.
Figure 1: Sampling fields for ploughing and harvest threshing (red points). White points indicate the two main cities (Ferrara and
10
2.2 Met hodol ogy
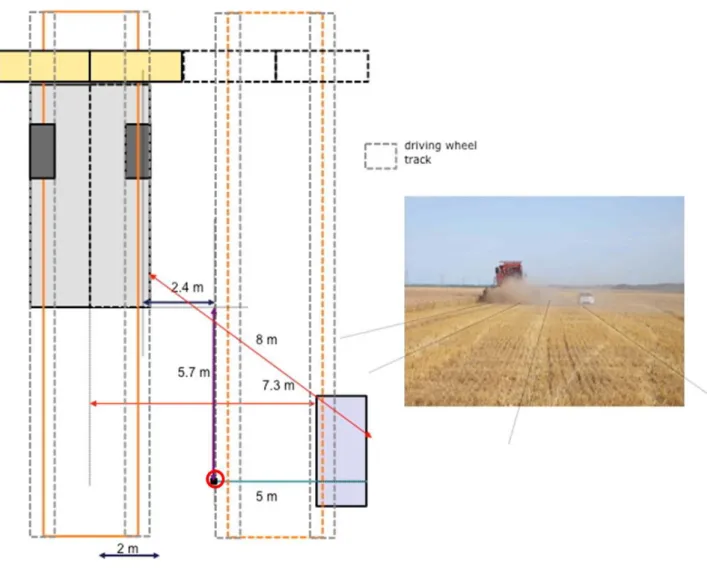
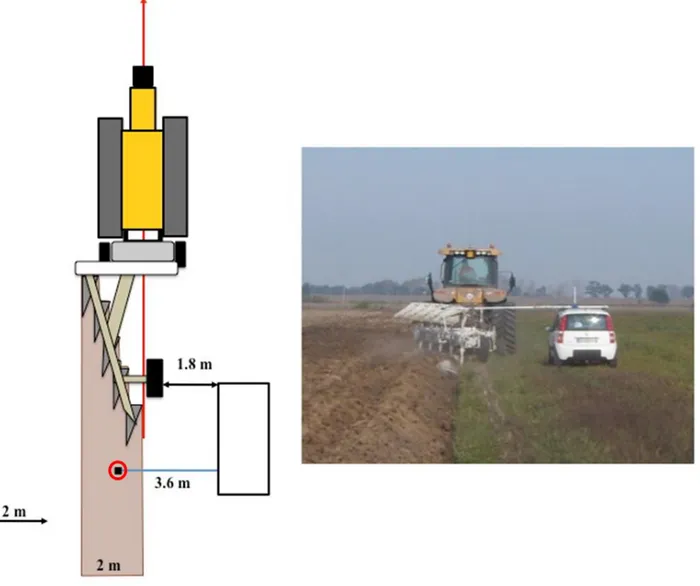
The worked fields are located in such a way that the agricultural machines move always along wind direction. Therefore, in order to sample the highest amount of aerosols emitted by the agricultural machines, the sampling was performed following the agricultural machine movement only downwind. As shown in Figs. 2 and 3, the impactor (attached to the car) moved along the traces of the tires made previously by the combine during harvest threshing (the gray dashed lines in Fig. 2) and along of the most external furrow slice, at a constant distance, during ploughing (purple area in Fig. 3). The sea-land breeze conditions together with a constant wind speed of tractor/combine ensured the production of a dust plume/cloud with constant characteristics (width and height) during sampling.
Figure 2: Position of the agricultural machine and the car during the harvest threshing sampling. The location of the cascade
11
Figure 3: Position of the agricultural machine and the car during the ploughing sampling. The location of the cascade impactor is
shown by the red circle.
The distance between the agricultural machine and the sampler is still a matter of discussion in the literature. Holmen et al. (2001b) showed no effect of downwind tractor distance when the emissions were low, close to background concentrations. The PM measurements were performed downwind on a fixed tower. Madden et al. (2008), showed that increasing the distance from the tractor to the sampler resulted in decreasing aerosol concentrations. Kasumba et al. (2011) found that the samplers near the source characterize the dust plume better since the vertical dispersion of dust is at the beginning whereas samplers farther from the disking tractor capture the dust after a significant amount of dispersion occurred during transport across the field. Here, the samplers were taken close to the emission point (agricultural machine) in order to avoid the aerosol dispersion as much as possible and at a constant distance from it.
The dust was sampled with an eight-stage Marple cascade impactor (Model 298, Graseby Andersen). Two Quartz fiber filters types were used as collection substrates, SKC 225-1826 1.2 µm R-100 and PALL 2500 QAT-UP Ø34 mm. The SKC substrates were used for the stages with the following aerodynamic equivalent particle diameters (AED): 0.52-0.93, 0.93-1.55, 1.55-3.5, 3.5-6, 6-9.8, 9.8-14.8, 14.8-21.3, > 21.3 µm and the PALL 2500 QAT-UP filter was used as final filter (AED < 0.52 µm). An air-sampling pump SKC Airchek
12
2000 was used with a flow rate of 2 l/min. The pump was compensated for losses up to 1000 mm H2O to keep constant the sampling flow rate.
In order to achieve a realistic value of the emitted mass concentrations, five replications of the sampling were taken using the same methodology, for both harvesting threshing and ploughing operations. The sampling was carried out using five cascade impactors (A, B, C, D, E), mounted one at a time on the car that followed the agricultural machine. Each cascade impactor was prepared in laboratory with pre-weighted filters. First cascade impactor (A) was fixed on the vehicle that followed the agricultural machine for 5 minutes sampling for threshing and 10 minutes sampling for ploughing, then, it was quickly substituted with the second (B) cascade impactor for the next 5 minutes sampling and 10 minutes for ploughing. The same procedure was applied for the three next impactors C, D and E.
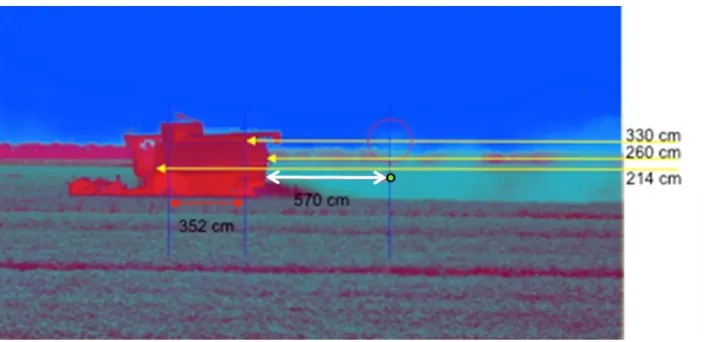
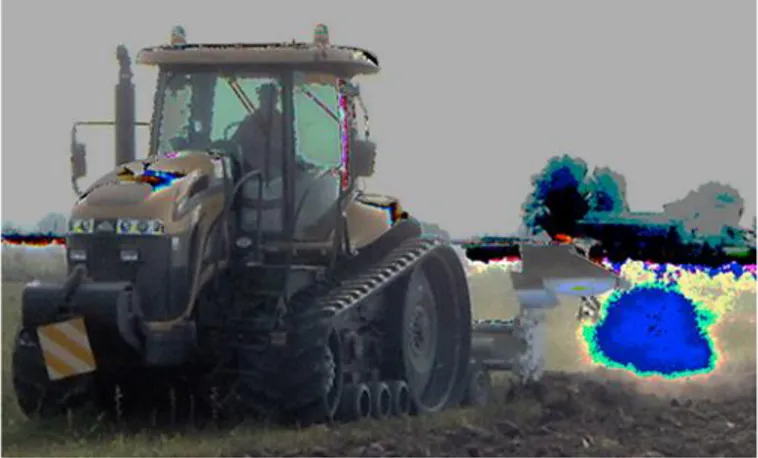
The aerosol sampling point was chosen at the location with the highest aerosol concentration, the most representative of the dust cloud emitted by the agricultural machine. The sampling point is shown by a red circle (Figs. 2 and 3) inside a representative area (rectangle) that circumscribes the core of the dust cloud. The area of rectangle was estimated from the width of the machine (width of the combine during threshing and width of plow during ploughing) and the height of the cloud cross section obtained through imagery analysis (ImageJ software, http://imagej.nih.gov/ij/). The volume of emitted dust was evidenced by changing settings on image color scale (Figs. 4 and 5).
Fig. 4 shows the distance between the combine and the sampler (green point) with a white line (570 cm). It can be also observed that the emitted plum above 330 cm height is negligible.
Fig. 5 shows the emitted dust cloud behind the tractor and the plow. Different photos were used to calculate the size of the rectangle that circumscribes the volume of emitted PM (blue area: 151 cm x 116 cm).
13
Figure 5: Sizing example of the volume of emitted dust during the ploughing.
Further, the emission factors were calculated by multiplying the aerosol mass concentration and the average sampled volume and dividing it by average worked area. For each impactor stage, the average mass concentration was obtained by averaging the five samples while the volume was obtained by multiplying the average machine velocity per sampling time and per the average cross section (rectangle area). For each agricultural operation, the average EF of the five impactor stages was fitted with a lognormal distribution
(DISTFIT software by Chimera Inc.
http://www.distfit.com/Front/DistFit/Main2.cfm?App=DistFit&DataSource_=DistFit&Co_ID_Filter=0) as follows in eq. [1]:
[1] Where x refers to the actual diameter (2.5 µm and 10 µm, respectively), c refers to the coarse fraction; f refers to the fine fraction; d represents the actual diameter (2.5 µm and 10 µm, respectively), erf is the error function.
MF (aerosol mass flux), MMAD (mass median aerodynamic diameter) and GSD (geometric standard deviation) are the bimodal parameters determined with DISTFIT program.
2.3 Laborator y measure ment s
Mass concentrations of the aerosol size segregated samples were determined by the gravimetric method. Quartz fibre filters and substrates were pre- and post- weighted using a Mettler Toledo balance (model AX205, 10µg sensitivity). Filter weighing was performed after 24 hours conditioning at constant temperature (20°C) and relative humidity (50%). The chemical and morphological composition of agricultural aerosols (Telloli, et al., 2014) showed that the major component of agricultural aerosols was the organic material in both fine and coarse aerosol fractions.
2 ln ln ln 1 2 1 2 ln ln ln 1 2 1 f f f c c c PMx GSD MMAD d erf MF GSD MMAD d erf MF EF
14
3 RESULTS AND DISCUSSION
The sampling for harvest threshing was carried out on 25th June 2009, from 3 am to 8 pm while for ploughing, the sampling was performed on October 7th from 12 am to 3 pm and October 8th from 11 to 12:30 am. The average and standard deviation of meteorological parameters during the sampling periods are shown in Table 1. The low values of standard deviation show that the wind direction and speed were almost constant which is favorable for assessing emission factors.
Activity Sampling day Wind speed Wind direction Relative humidity Temperature
(m/s) (degrees N) (%) (°C)
Threshing 25 June 4.1 ± 0.4 149 ± 3 56 ± 6 24.6 ± 1.6
Ploughing
7 October 2.2 ± 0.3 314 ± 11 38 ± 3 27.3 ± 0.9 8 October 3.2 ± 0.2 319 ± 6 49 ± 3 25.5 ± 1.4
Table 1: Average and standard deviation of meteorological parameters at ARPA CAMSE station during sampling periods. Table 2 shows the aerosol mass concentrations obtained for each impactor stage during harvest threshing and ploughing activities. For harvest threshing, the aerosol particles accumulated on the filter exhibit high mass concentrations on the coarse stages (3.5-6.0 µm; 6.0-9.8 µm). This high contribution in the coarse aerosol fraction can be related to the presence of coarse particle produced by the fragmentation of wheat. The coarse fraction is the main contributor to the aerosol mass concentration emitted in atmosphere. The average concentration decreased gradually from the coarse stage (6.0-9.8 µm) to the fine stage (0.52-0.9 µm). However, the finer stage (<0.52 µm) has a higher contribution than the stage (0.52-0.9 µm).
For ploughing activity, the major PM contribution is also in the coarse aerosol fraction. The average concentration decreases gradually from the coarse stage (6.0-9.8 µm) to the fine stage (<0.52 µm). The coarse stage (6.0-9.8 µm) has the highest aerosol concentration: two times higher than the lower stage (3.5-6.0 µm).
It can be noted that fine aerosol concentrations (< 2 µm) are higher during threshing than during ploughing, while the opposite is observed for coarse aerosol concentrations (> 2.5 µm).
The coefficient of variation (CV), defined as the ratio of the standard deviation to the mean, ranges from 17% to 43% for threshing and from 19% to 71% for plowing; the lower values for threshing than for plowing show the dependence of emitted aerosol on the agricultural operation characterized by different means (Table 2).
Several studies (Holmen et al., 2001b; Clausnitzer and Singer, 2000; Kantamaneni et al., 1996)
have
investigated the correlation of various atmospheric conditions (air temperature and relative humidity) to fluctuations in PM emissions from agricultural operations. The results show no relationships between15
various agricultural operations, due to highly variable environmental conditions (wind speed and direction) for any single operation. In this study, for each agricultural operation, the environmental conditions were similar during the aerosol sampling, ensuring thus consistency and comparability of samples.
Cutoff A B C D E Min Max Mean SD CV
(AED) (µm) (µg/m 3) (µg/m3) (µg/m3) (µg/m3) (µg/m3) (µg/m3) (µg/m3) (µg/m3) (µg/m3) % Thre sh ing < 0.52 13120 8150 5160 7820 4820 4820 13120 7814 3327 43 0.52÷0.9 3290 7450 5360 7500 6480 3290 7500 6016 1756 29 0.9÷1.6 6280 8440 5800 7500 5770 5770 8440 6758 1173 17 1.6÷3.5 11320 9480 7670 5360 14380 5360 14380 9642 3447 36 3.5÷6.0 7320 13460 8300 17700 19430 7320 19430 13242 5425 41 6.0÷9.8 18290 17440 10480 16760 14410 10480 18290 15476 3143 20 9.8÷14.8 20270 26470 20450 10730 30430 10730 30430 21670 7465 34 14.8÷21 35300 28450 25400 23790 19420 19420 35300 26472 5914 22 >21 25300 27500 47270 39730 19390 19390 47270 31838 11368 36 Plough ing < 0.52 2000 3300 1270 1120 2380 1120 3300 2014 886 44 0.52÷0.9 960 3590 2100 2260 3350 960 3590 2452 1059 43 0.9÷1.6 2720 1510 1950 1750 3890 1510 3890 2364 966 41 1.6÷3.5 4260 460 1420 2770 5460 460 5460 2874 2035 71 3.5÷6.0 3250 5160 5090 4880 4930 3250 5160 4662 798 17 6.0÷9.8 10590 11370 14500 9070 9620 9070 14500 11030 2132 19 9.8÷14.8 54600 33960 26580 68210 36310 26580 68210 43932 17043 39 14.8÷21 193820 147080 77860 157230 80330 77860 193820 131264 50705 39 >21 91230 102540 32830 59270 30650 30650 102540 63304 32903 52
Table 2: Aerosol mass concentrations as a function of impactor stage for the 5 samplers (A, B, C, D and E in chronological order)
collected during harvest threshing and ploughing activities; minimum (Min), maximum (Max), Mean, standard deviation (SD) and coefficient of variation (CV) for the aerosol mass concentrations obtained from each impactor stage.
3.1 Em i ssi on f actors
Emission factors (EFs) describe the quantity of a pollutant released to the atmosphere by an anthropogenic activity, such as ploughing and harvest threshing. They are used to make source specific emission estimates required for emission inventory compilation, air quality studies, mitigation measurements, scenario assessment.
16
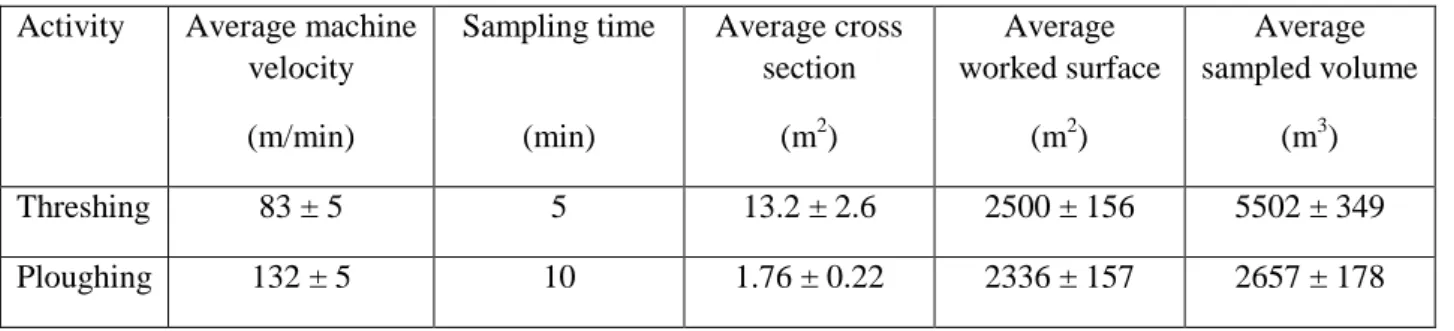
For the two different agricultural operations, Table 3 shows the main parameters used to calculate the emissions factors (see Section 1.1 for details) and Table 4 shows the parameters of the two bimodal distributions for fine (PM2.5) and coarse (PM10-PM2.5) aerosol fractions.
Activity Average machine velocity
Sampling time Average cross section Average worked surface Average sampled volume (m/min) (min) (m2) (m2) (m3) Threshing 83 ± 5 5 13.2 ± 2.6 2500 ± 156 5502 ± 349 Ploughing 132 ± 5 10 1.76 ± 0.22 2336 ± 157 2657 ± 178
Table 3: Main parameters used to calculate the emission factors of PM2.5 and PM10.
Mode MMAD GSD MF MF (µm) (mg/m2) (g/h) Threshing coarse 18.7 2.21 76 8150 fine 1.2 3 273 2290 Ploughing coarse 18.2 1.45 210 3350 fine 1.5 2.83 13 210
Table 4: Harvest threshing and ploughing lognormal size distribution parameters.
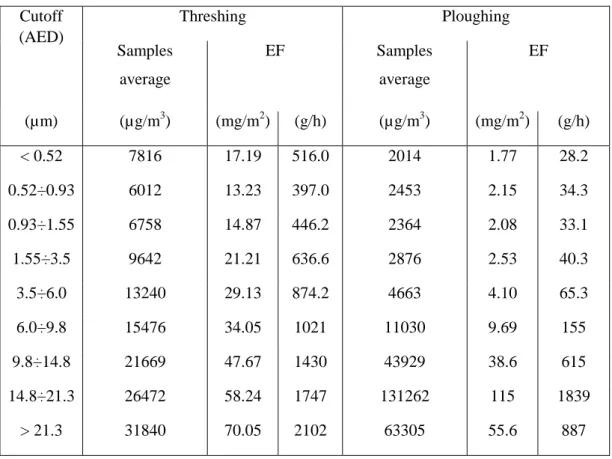
Table 5 shows the average aerosol concentration (in µg/m3) as a function of particle size and the emission factor (EF) obtained with the equation [1] as PM emitted per hour (g/h) and per square meter (mg/m2) for harvest threshing and ploughing activities. The EF for each impactor stage was computed using the data showed in Table 3: the aerosol mass concentration was multiplied by average sampled volume and divided by average worked area. For harvest threshing, the EFs reflect the behavior of average concentrations, and are higher for the aerosol coarse fraction than for the fine fraction, with the minimum on the stages between 0.52-1.6 µm. As for harvest threshing, the EFs for ploughing have a similar behavior: the average concentrations decrease gradually from the coarse stage (6.0-9.8 µm) to the fine stage (<0.52 µm).
Table 6 shows the emission factors of PM2.5 and PM10 per hour and per m2 for the two agricultural operations. The harvest threshing was the dustiest operation with an emission of 3.970 kg/h of PM10 and of 1.756 kg/h of PM2.5 generating 93% more PM10 than ploughing (0.254 kg/h) and for PM2.5, harvest threshing generated 92% more than ploughing (0.138 kg/h).
17 Cutoff (AED) Threshing Ploughing Samples average EF Samples average EF (µm) (µg/m3) (mg/m2) (g/h) (µg/m3) (mg/m2) (g/h) < 0.52 7816 17.19 516.0 2014 1.77 28.2 0.52÷0.93 6012 13.23 397.0 2453 2.15 34.3 0.93÷1.55 6758 14.87 446.2 2364 2.08 33.1 1.55÷3.5 9642 21.21 636.6 2876 2.53 40.3 3.5÷6.0 13240 29.13 874.2 4663 4.10 65.3 6.0÷9.8 15476 34.05 1021 11030 9.69 155 9.8÷14.8 21669 47.67 1430 43929 38.6 615 14.8÷21.3 26472 58.24 1747 131262 115 1839 > 21.3 31840 70.05 2102 63305 55.6 887
Table 5: Size-dependent aerosol mass concentrations emitted and EF per time (g/h) and per square meter (mg/m2) forharvest
threshing and ploughing activities.
PMx Threshing EF Ploughing EF (µm) (mg/m2) (kg/h) (mg/m2) (kg/h)
2.5 58.0 1.756 8.8 0.145 10 132.2 3.970 23.7 0.384
Table 6: Emission factors per time (kg/h) and per square meter (mg/m2) for PM
2.5 and PM10.
The PM10 emission factor per square meter for harvest threshing (132.2 mg/m2) is similar with other emission factors available in the literature. Ottl and Funk (2007) estimated average PM10 emission factors of 82 mg/m2 and 120 mg/m2 for harvest threshing and ploughing operations, respectively, in Germany, and Bogman et al. (2005) predicted PM10 emission factors ranging from 150 to 230 mg/m2 for agricultural tillage and harvesting operations in Belgium. These estimations are slightly smaller than the value of 190 mg/m2 estimated for California (CARB, 1997).
The PM10 emission factor for wheat harvest obtained in this study (132.2 mg/m2) is much higher than the one published by US EPA AP-42 (0.17 mg/m2) and by Qiu and Pattey (2008) (74 mg/m2 in Canada), but lower than those found by Flocchini et al. (2001) (650 mg/m2). The emission factor reported by Flocchini et al. (2001) was determined from a series of experiments conducted in summertime in the San Joaquin Valley of
18
California. Compared to the hot and dry summers in San Joaquin Valley, Po Valley’s climate in fall is relatively mild and humid (as in Qiu and Pattey, 2008).
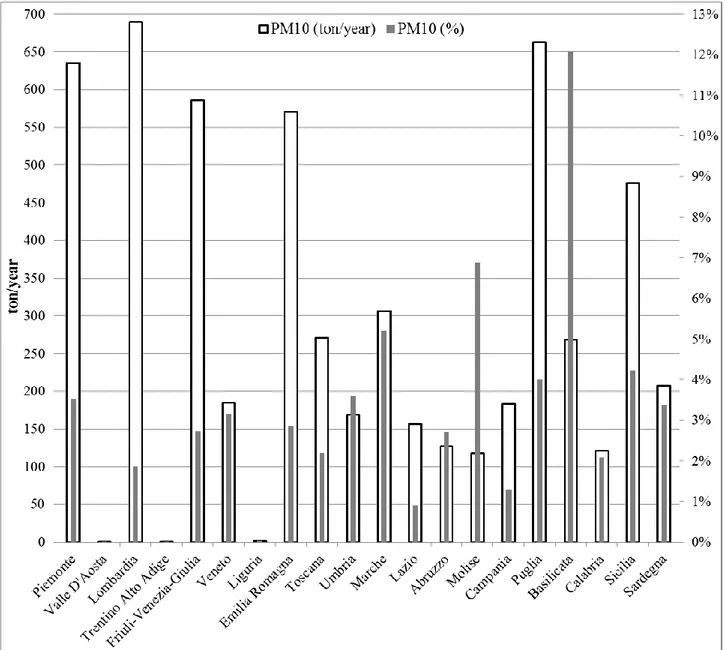
Fig. 6 shows with white bars an estimation of the amount of PM10 agricultural emissions in Italy, by region. This was calculated by using the measured emission factors (Table 6) and the agricultural surface data, available from the National Institute of Statistics. This calculation was necessary, as an official estimate of national PM10 emissions from agricultural operations is not available. The 2010 National anthropogenic Emission Inventory (http://www.sinanet.isprambiente.it/it/sia-ispra/inventaria/disaggregazione-dellinventario-nazionale-2010) does not include estimates for PM10 from agricultural activity, since the official estimation methodology was introduced for EU in 2013 (EMEP guidebook, 2013). Fig. 6 also shows, as grey bars, the percentage contribution of agriculture to total PM10 emissions, by region. This was calculated by dividing the agricultural emissions (white bars) by the total emissions from all sectors, available from the National anthropogenic Emission Inventory. It can be noted that the regions with the highest emissions of PM10 from agricultural activities are in the Po Valley (Lombardia, Piemonte, Friuli Venezia Giulia and Emilia Romagna) but also in the south of Italy (Puglia) and Sicily. On the contrary, the highest contribution of agricultural emissions to the total anthropogenic PM10 emissions is observed in the center and south of Italy, in less-industrialized regions such as Basilicata, Molise, Marche, Puglia, Sicily and Sardinia.
19
Figure 6: Emission contribution of PM10 – white bars and percentage contribution of PM10 from agriculture to total PM10 emissions –
20
4 CONCLUSIONS
This study shows aerosol size dependent emissions factors for wheat harvest threshing and ploughing estimated from measurement campaigns carried out in the Po Valley. The methodology used for aerosol sampling in this campaign was developed taking into account the characteristics of the sampling fields. The aerosol was sampled following the agricultural machine movement, at a constant distance from the machine and at the same height. Constant wind velocity and direction characteristic of sea-land breezes and constant speed of agricultural machine allowed dust sampling close to the emission source, in an area with the highest aerosol concentrations. By sampling near the source, the errors due to particle transport over long distances were reduced to minimum (the particles smaller than 10 µm do not deposit immediately).
The results show that EFs of PM2.5 and PM10 are higher in harvest threshing than in ploughing. The EFs for aerosol fine fraction contribute more to PM10 for threshing than for ploughing: PM2.5/PM10 ratio is about 43% and 37%, respectively. Harvest threshing produces much more aerosol particles than ploughing; in fact, the emission factors for ploughing operations are an order of magnitude lower than those for the harvest threshing operations.
This study shows that the emission contribution of agriculture to PM10 at regional level may be between 3 and 5% in highly anthropogenic polluted areas such as Po Valley but up to 12% in low polluted areas such as Basilicata region. In spite of its limitations such as lack of information of soil moisture and only one campaign for each agricultural activity, this study shows a new methodological setup and new results for a Mediterranean area.
The difference in the climatic conditions between the sampling fields used here, subject to sea land breeze conditions, and the other fields investigated in previous studies might explain partly the difference in the emission factors. However, more studies are necessary in order to assess the appropriate agricultural emissions factors in relation to geographical location and climatic conditions since their values are influenced by many factors such as dispersion model uncertainty, wind speed, relative humidity, soil moisture and land preparation.
21
ACKNOWLEDGMENTS
This work was performed in the framework of the MINNI (Integrated National Model in support to
the International Negotiation on Air Pollution) project, funded by the Italian Ministry of the
Environment and carried out by ENEA.
22
5 REFERENCES
Bianchini, G., Laviano, R., Lovo, S., Vaccaro, C. 2001. Chemical mineralogical characterization of clay sediments around Ferrara: a tool for an environmental analysis. Appl. Clay Sci. 21:165-176.
Bogman, P., Cornelis, W., Rollé, H., Gabriels, D. 2005. Prediction of TSP and PM10 emissions from agricultural operations in Flanders, Belgium. Dust Conference 2007, Maastricht, The Netherlands.
CARB, 1997. In: Gaffney, P. and Shimp, D. 1997. Improving PM10 Fugitive Dust Emission Inventories. Technical Support Division, CARB, October, 1997.
CARB, 2003. Miscellaneous Processes Methodologies. Farming operations. Agricultural land preparation: section 7.4 + Agricultural harvest operations: section 7.5, January 2003.
Cassel, T., Trzepla-Nabaglo, K., Flocchini, R. 2003. PM10 emission factors for harvest and tillage of row crops. In: 12th International Emission Inventory Conference “Emission Inventories - Applying New Technologies”, San Diego, 2003.
Clausnitzer, H. and Singer, M.J. 2000. Environmental influences on respirable dust production from agricultural operations in California. Atm. Env. 34:1739-1745.
EMEP/EEA air pollutant emission inventory guidebook 2016, Technical guidance to prepare national emission inventories, EEA Report No 21/2016, ISSN 1977-8449,ISBN 978-92-9213-806-6, doi:10.2800/247535
Environment Canada, 2007. Canadian criteria air contaminants available. http://www.ec.gc.ca/pdb/cac/Emissions1990-2015/EmissionsSummaries/2005_canada_e.cfm
Erisman, J.W., Bleeker, A., Hensen, A., Vermeulen, A. 2008. Agricultural air quality in Europe and the future perspectives. Atm. Env. 42:3209-3217.
Flocchini, R.G., James, T.A., Ashbaugh, L.L., Brown, M.S., Carvacho, O.F., Holmén, B.A., Matsumura, R.T., Chris, K.T. 2001. Sources and Sinks of PM10 in the San Joaquin Valley. Interim Report, University of California, Davis, CA.
Funk, R. and Reuter, H.I. 2004. Dust production from arable land caused by wind erosion and tillage operation. In: Eurosoil 2004, Freiburg, Germany.
Gaffney, P. and Yu, H. 2003. Computing agricultural PM10 fugitive dust emissions using process specific emission rates and GIS. In: 12th International Emission Inventory Conference “Emission Inventories - Applying New Technologies”, San Diego, 2003.
Goossens, D., Gross, J., Spaan, W. 2001. Aeolian Dust Dynamics in agricultural land areas in lower Saxony, Germany. Earth Surface Processes and Landforms, 26, 701-720.
Hinz, T. 2004. Agricultural PM10 emission from plant production. Proceedings of the PM Emission Inventories Scientific Workshop.
Holmén, B.A., James, T.A., Ashbaugh, L.L., Flocchini, R.G. 2001a. LIDAR - assisted measurement of PM10 emission from agricultural tilling in California’s San Joaquin Valley - Part I: LIDAR. Atm. Env. 35:3251-3264.
Holmén, B.A., James, T.A., Ashbaugh, L.L., Flocchini, R.G. 2001b. LIDAR - assisted measurement of PM10 emission from agricultural tilling in California’s San Joaquin Valley - Part II: Emission Factors. Atm. Env. 35:3265-3277.
Kantamaneni, A.G., Bamesberger, L., Allwine, E., Westberg, H., Lamb, B., Claiborn, C. 1996. The measurement of roadway PM10 emission rates using atmospheric tracer ratio techniques. Atm. Env. 30:4209-4223.
23
Kasumba, J., Holmén, B.A., Hiscox, A., Wang, J., Miller, D. 2011. Agricultural PM10 emissions from cotton field disking in Las Cruces, NM. Atm. Env. 45:1668-1674.
Kjelgaard, J., Sharrat, B., Sundram, I., Lamb, B., Claiborn, C., Saxton, K., Chandler, D. 2004. PM10 emission from agricultural soils on the Columbia Plateau: comparison of dynamic and time-integrated field-scale measurements and entrainment mechanisms. Agric. Forest. Meteor. 125.259-277.
ISPRA. 2011. Informative Inventory report (2011). Agriculture (NFR SECTOR 4).
Lugato, E., Zuliani, M., Alberti, G., Delle Vedove, G., Gioli, B., Miglietta, F., Peressotti, A. 2010. Application of DNDC biogeochemistry model to estimate greenhouse gas emission from Italian agricultural areas at high spatial resolution. Agr. Ecosyst. Environ. 139, 546-556.
Madden, N.M., Southard, R.J., Mitchell, J.P. 2008. Conservation tillage reduces PM10 emission sin daily forage rotations. Atm. Env. 42:3795-3808.
Ottl, D. and Funk, R. 2007. PM emission factors for farming activities by means of dispersion modeling. Particulate matter in and from agriculture. Landbauf. Völk. 308:173-177.
Qiu, G. and Pattey, E. 2008. Estimating PM10 emissions from spring wheat harvest using an atmospheric tracer technique. Atm. Env. 42:8315-8321.
Telloli, C., Malaguti, A., Mircea, M., Tassinari, R., Vaccaro, C., Berico, M. 2014. Properties of agricultural aerosol released during wheat harvest threshing, ploughing and sowing. JES 26:1903-1912.
USEPA, 2004. The particle pollution report: current understanding of air quality and emissions through 2003. Contract 68-D-02-065, Research Triangle Park, NC.
USEPA AP-42: https://www.epa.gov/air-emissions-factors-and-quantification/ap-42-compilation-air-emission-factors
ENEA
Servizio Promozione e Comunicazione www.enea.it
Stampa: Laboratorio Tecnografico ENEA - C.R. Frascati maggio 2017