WHO BENEFITS FROM OUTSOURCING?
A STUDY OF ONE ITALIAN REGION’S SMALL FIRMS I. Drudi, S. Pacei
1. INTRODUCTION
The present paper focuses on examining the impact of outsourcing on both the value added and the gross earnings of Emilia-Romagna small clothing manu-facturers. The main interest of this work is twofold: i) we concentrate our atten-tion on the micro business sector (all firms with turnover of less than 5,000,000 €); ii) our findings show that outsourcing decision is driven by (and has effects on) profit rate much more than productivity.
Regarding micro businesses, it is well known that little information is available, while they represent a peculiarity of the Italian economy with its prevalence of family-run businesses that are organized in industrial districts, and that do not re-ceive public subsidies (Cassia and Colombelli 2009). According to the figures published by our National Statistical Institute for 2007 (www.istat.it), Italian firms employing fewer than 10 workers constitute the vast majority of all businesses (95%), they employ about 47% of the entire Italian workforce, and generate 27% of Italy’s entire turnover. These percentages increase to 98%, 59% and 38% if we consider firms with fewer than 20 workers. While firms employing at least 20 workers (2% of all firms) are investigated each year by means of a sample survey which, given their limited number, is almost a Census, smaller firms are ac-counted for by a different sample survey which does not provide any detailed in-formation regarding their activities or performance.
Moreover, our specific focus is on clothing firms in Italy’s Emilia-Romagna re-gion. The decision to focus on the clothing sector is due to the facts that it is one of the most relevant sectors of the Italian economy, also in terms of the number of industrial districts and the degree of internationalization, and that outsourcing is of particular importance within this sector (Graziani 2001) since production cy-cles are extremely segmented vertically, and since the considerable independence of each production phase facilitates outsourcing. In fact, as observed by Brusco (1982), while analysing the Emilia-Romagna productive system, outsourcing is particularly marked in those sectors characterized by limited economies of vertical integration. Moreover, within the clothing sector, production is carried out mainly
by small and medium-size firms that are highly specialized and often work in niche markets. Then, we choose the Emilia-Romagna region due to its high de-gree of entrepreneurial activity, its importance in the national economy, and its heavily export-oriented character. Emilia-Romagna is also one of the four most important Italian regions for the clothing sector, accounting as it does for 9.8% of all Italian clothing firms and 13.8% of Italy’s clothing exports in 2008 (SMI 2009). In the Emilia-Romagna region the turnover and the number of employees in the clothing sector represent respectively 4 and 6% of the whole manufacting sector (http://www.istat.it/it/archivio/11556).
We study the impact of outsourcing decisions both on labor productivity and on profitability of companies, which represent two different aspects of the firms’ performance and competitiveness. The firm’s capacity of yelding profit measures the current competitiveness of the firm. A firm may decide to maximize its profit without worry about the improvement of its performance in the future. The pro-ductivity indicator, instead, concernes organization of the production process, competences of labor force, technological advances, quality of the phisical capital, etc. Productivity growth is the main reason of firm’s economic growth.
Our interest on that topic depends on the fact that the phenomenon of geo-graphically-fragmented production processes has increased without precedent in the last two decades, because information and communication technologies (ICT) have made it possible to slice up the value chain and perform activities in any lo-cation (Grossman and Helpman 2005), while the continuous decline of transpor-tation costs has facilitated the worldwide flows of goods (Hummels 2007). The “globalization of the value chain” consists in the physical fragmentation of pro-duction, and is motivated by a number of factors. One is the desire to reduce op-erating costs by sourcing inputs from more efficient producers, either domesti-cally or internationally, and either within or outside the boundary of the firm. Other reasons include the wish to enter emerging markets and access strategic assets that can help tap into foreign knowledge and the opportunity to exploit fis-cal or legal benefits. The fragmentation of production, notwithstanding the obvi-ous benefits it offers, also involves costs and risks for those firms involved. In-deed, it gives rise to considerable restructuring of businesses, including the “sourcing” and “offshoring” (the very special case of exclusively international out-sourcing) of certain functions (OECD 2007).
As far as the consequences of outsourcing are concerned, it may have a num-ber of sometimes unexpected effects on the organization of production, trade flows and international specialization, the distribution of income, as well as la-bour markets, and these effects may vary across activities, regions and social classes. Detailed descriptions of the reasons for, and the effects of, outsourcing can be found in Munoz and Welsh (2006), Bengtsson and Dabhilkar (2009) and Windrum et al. (2009).
The impact on productivity has been studied by theorists of international pro-duction (Kulmala et al. 2002; Helpman et al. 2004). Results show that higher inter-national involvement tends to be associated with higher productivity at any given level of corporate innovativeness. Gains typically arise from the exploitation of
the comparative advantages and economies of scale offered by external suppliers (Grossman and Helpman 2005). Goods and services may be more efficiently produced in another country, and consequently imported at a lower price. This access to better, cheaper and more varied (final and intermediate) inputs helps improve firms’ productivity. Besides, by outsourcing, firms may focus on their core skills and thus increase their level of innovation (Mazzanti et al. 2007). Sev-eral studies (Hijzen 2006; Castellani and Zanfei 2007) have found a positive con-nection between productivity, outsourcing, R&D expenditure and hence innova-tion processes.
Nevertheless, the impact of outsourcing on the performance of companies and, in particular, on their accounting figures, has seldom been studied in a sys-tematic, in-depth manner (Bengtsson and Dabhilkar 2009; Windrum et al. 2009). One reason for this is that it is generally rather difficult measuring outsourcing since firms are sometimes reluctant to offer details on their outsourcing and off-shoring policies (OECD 2007). A limited number of empirical studies have fo-cused on the effects of outsourcing on productivity (see, for example, Lacity and Willcocks 1998; Görzig and Stephan 2002; Bengtsson and von Hartman 2005), while its effects on profits, although demonstrated by Harrison (2004), have not been analysed in detail up until now (Olsen 2006).
For these reasons, the present paper offers an empirical contribution to the literature on the effects of outsourcing on firms performance, based on micro-data from an administrative source, the Sectoral Studies (SDS – studi di set-tore). To our purpose we use Tobit-type models. The choice of these models is due to different reasons. First of all they enable us to incorporate a firm’s pro-pensity towards outsourcing in the impact evaluation, and to adjust for possible selection bias (Amemija 1985; Schnedler 2005). In our case, the selection bias may be due to the fact that only certain firms do in fact decide to outsource, and this decision may well be connected to the characteristics of the firms in question, thus making it difficult to establish any causal link. Secondly, while outsourcing is often modelled as discrete variable and sometimes as percentage (see for example Everaert et al. 2010), in the dataset we use the information on the expenses incurred by firms for outsourcing is available, and may be conven-iently included in the models considered. A third advantage of the Tobit models in question is that they enable us to evaluate the effects of outsourcing also us-ing cross-sectional data.
This paper is organized as follows. The second Section discusses the outsourc-ing issue in Italy. The third Section describes the data sources in more detail, and in doing so it explains how we selected the firms for analysis using statistical mul-tivariate techniques, and provides some information on those characteristics most closely connected with the phenomenon of outsourcing. The third Section exam-ines the econometric models employed, while the fourth Section offers the em-pirical results of our analysis. The fifth and final section offers some observations and conclusions, together with opportunities for future study.
2. THE OUTSOURCING IN ITALY
In Italy, the process of outsourcing picked up pace during the 1990s, at first involving medium-sized firms within the textile-clothing and leather-footwear sectors; these firms tried to recoup that competitiveness they had seen eroded by the increasing market foothold of the larger Asian economies. It has become a necessary choice for many firms wishing to compensate for the disadvantage of labour costs and the strengthening of the euro against the dollar.
The responses to global pressure have not been always the same in all business sectors. In the clothing sector, for example, firms initially outsourced selected phases of their production processes, such as cutting, sewing and ironing, to smaller firms and workshops often situated within the same districts, or in any case not very far away. It was only at a later stage (mainly in the 1990s) that firms began to resort to offshoring, as a result among other things of the gradual re-moval of trade and investment barriers between the industrialized nations (Gian-nelle and Tattara 2009). However, up until now offshoring has mainly been the preserve of larger firms with the required organizational capacity, which have been in a position to gradually replace certain Italian subcontractors with foreign ones, and this has created the foreseeable problems for Italy’s smaller clothing manufacturers.
On the other hand, however (as our results will confirm), even small firms are used to outsourcing certain phases of production to other (small) firms. As a re-sult: i) a significant amount of outsourcing continues to be done “locally” within the country; ii) small clothing firms have adopted the dual role of subcontractor and outsourcing firm, within the framework of a chain of firms, the length of which is difficult to ascertain, where each firm works for third parties while at the same time delegating certain phases of their own production to other firms. Freo et al. (2011) found similar results studying the mechanic sector of the Emilia-Romagna region. Hence that “dual role” appears as a common feature of the manifacturing firms in the region.
The measurement and analysis of outsourcing in Italy is of particular interest, due to the aforementioned prevalence of small and medium-size firms character-ised by a low degree of internationalization and a tendency to be clustered to-gether in special “industrial districts”. Indeed, the outsourcing phenomenon is having important repercussions on the traditional district-based organization of Italy’s firms (Becchetti and Rossi 2000, Beccattini 2004; Mariotti et al. 2008). It is widely acknowledged that one good reason for the vitality shown by Italy’s small and medium-sized firms has been this geographical concentration in industrial districts, which enables them to benefit from economies of agglomeration, and from the know-how and synergies that have developed within such an environ-ment (Baldwin 1999; Dunning 2000, Menghinello 2004). These districts are often characterised by the presence of small firms highly specialized in certain selected phases of a production process of which they constitute only one link in the sup-ply chain. The survival of such firms is now clearly threatened by the possibility of internationally relocating those phases of production characterised by a
sub-stantial degree of independence, and the industrial districts in question need to make a greater effort to adapt and reorganize. Nevertheless, the reaction of, and consequences for, those small and medium firms within Italy’s industrial districts may vary considerably. The absence of any strategic project, and of the possibility of controlling the market, has obviously penalized those small firms that are not in a position to address the current contraction in demand and prices, and the es-calation of competition. However, the presence of local leaders, as well as the presence of foreign-owned firms within the district have been shown to support the international expansion of the whole district (Piscitello and Sgobbi, 2004).
Moreover the outsourcing process, currently being implemented by firms re-gardless of their size, has facilitated the emergence of new enterprises. Existing firms need to focus their investments on those core activities that are of most importance for the creation of value, and as such have begun to delegate addi-tional tasks to other firms, thus facilitating their creation with the help of specific support. As a result, however, the new firms often have no corporate autonomy as they are completely dependent upon exclusive contracts with a client company.
With regard to the figures we have for company fragmentation, a survey of Italian manufacturers with more than 10 employees, carried out by Capitalia (2005), reveals that 7.3% of Italian firms resorted to offshoring in 2001-2003, al-though this particular survey provides no information on which phases of the production process were outsourced abroad, or on the entity of domestic out-sourcing.
Detailed information on domestic and overseas subcontracting is provided by an Italian administrative source, the Sectoral Studies (SDS – studi di settore) (Di Nicola 2007), taken into consideration in this work. These SDS have gathered substantial information on firms since 2002, which the Tax Agency then uses to asses the small and medium firms’ income-tax returns in order to determine the entity of corporate taxation due. Information is provided each year by almost all those firms with a turnover of less than 5,164,659 euros.
3. THE DATASET 3.1. The chosen units
SDS data allow for the analysis and evaluation of firms’ activities, and of the economic environment in which they operate, as these data provide information about: the economic sector, the productive processes, the composition of the la-bour force, balance sheets, specific goods and services produced, reference mar-kets, the localization of production, and a number of other important features of each specific economic sector. The information regarding the localization of pro-duction enables us to understand whether the various phases of the propro-duction process are carried out by the firm itself (internally) or by domestic or foreign subcontractors (externally). Moreover, the SDS for the clothing sector offers an-other important item of information, namely: “the expenses incurred for out-sourced production and/or processing”. We have used this specific information,
rarely available, in the model described in the following section. Furthermore, we have added the information regarding those industrial districts that firms may be-long to. There are three districts within the Emilia-Romagna region where cloth-ing manufacturcloth-ing is of particular importance.
We examined figures for businesses located in the Emilia-Romagna in 2005 (tax year 2004), with the exception of firms producing “knitted goods” (the pro-duction of which differs substantially from the “manufacture of garments”). The remaining firms (2,142) nevertheless produce a considerable variety of different products. Indeed, the raw materials used represent the one element that unites a sector which is actually extremely varied with regard to the process technologies employed (and thus, with regard to the incidence of capital-labour inputs). There-fore, in order to avoid the risk of fitting models to a set of individual firms that employ excessively different production processes, we searched for clusters of firms that were homogeneous in terms of the products obtained and/or proc-essed. To this end, we carried out a Principal Component Analysis (PCA) and a Cluster Analysis, which enabled us to identify twelve different groups. As starting variables for the PCA we used the information on the percentage of revenue de-riving from various types of product (finished products or parts thereof). There were 32 possible types of garment. The PCA, carried out using a Varimax rota-tion in order to facilitate interpretarota-tion of results, revealed the presence of highly-correlated productions, as can be seen from the 15 principal components (shown in Table 1), which account for 61% of total variability. Results show that, for ex-ample, firms producing jackets also tend to produce trousers, while those produc-ing skirts tend to produce dresses and shirts as well.
TABLE 1
Description of the first 15 principal componentse Principal Component Connected mainly to the production of:
F1 Jackets and trousers
F2 Skirts, dresses and shirts F3 Gloves, scarves and hats
F4 Sweatshirts and t-shirts
F5 Briefs, tank tops and pyjamas F6 Lingerie and beach wear
F7 Ties and scarves
F8 Padded jackets and jackets F9 Belts and other accessories F10 Baby clothes and maternity wear
F11 Stockings and tights
F12 Leather hats, belts and jackets F13 Wedding dresses and tights
F14 Work clothes
F15 Gym suits and other sportswear
To segment the firms according to products or processes, we have adopted erarchical (Ward) and non-hierarchical (K-means) clustering techniques. The hi-erarchical cluster reveals three values for the possible number of groups – 12, 14 and 17 – on the basis of indicators R2 and Pseudo F. The non-hierarchical analy-sis carried out for these three numbers of groups gives very similar results. A much larger group of firms tends not to divide despite the increase in the number
of groups requested in the cluster analysis. Whereas the smaller groups consist of firms that are highly specialized in very specific products. Therefore segmentation in the lowest number of groups (12) was chosen (with an R2 value of 0.60, indi-cating an acceptable degree of separation between the groups), the description of which, based on the declared products, is given in Table 2.
In order to consider a group of firms that was as homogeneous as possible, for the purpose of the following impact analysis, we chose to focus on the largest group only (cluster 1) which, in essence, manufacturers “outdoor wear”. It has to be pointed out however that even though firms in the SDS archive were already classified according to their sector activity (ATECO 5 digits) with modalities simi-lar to those shown in Table 2, this ATECO classification was neither reliable nor up to date.
TABLE 2 Description of clusters of firms Cluster n Firms producing and/or processing:
1 1,747 Jackets, trousers, skirts, dresses, shirts, pullovers (mesh cut), t-shirts 2 114 Belts and ties
3 48 Work clothes
4 42 Padded jackets and jackets 5 42 Sweatshirts and t-shirts 6 27 Gloves, scarves
7 11 Gym suits and other sportswear, jeans
8 7 Baby clothes, maternity wear, pyjamas and underwear 9 7 Stockings and tights
10 5 Baby clothes, maternity wear 11 3 Ties and scarves
12 2 Leather hats and caps, belts
3.2. The variables
The target variables are “per capita value added” and “gross earning before taxation” (EBITDA), which represent, respectively, labour productivity and the profitability of operations before depreciation charges and provisions are de-ducted. These variables were calculated as indicated by the Inland Revenue Agency. Per capita value added is calculated as the ratio between operational value added and the average number of people employed. Operational value added is calculated as the difference between sales revenue net of changes in in-ventories of finished products, and the cost of raw materials, semifinished goods and services. EBITDA is the difference between value added and labour costs. A few firms in the dataset (30) displayed negative values for EBITDA, and were thus omitted from our analysis as they represent highly specific cases which the Inland Revenue reserves the right to investigate further. Moreover, 825 of the remaining firms do not have any employees as such, that means that they are family-run businesses, and as a consequence their value added is equal to their EBITDA, and so they were analysed separately from the others. Both target vari-ables are expressed as logarithms in the models described in the next section, with the result that they give changes in variables in percentage terms.
The explanatory variables used in the models were selected either on the basis of existing studies on the topic which, as we have already said, have mainly
fo-cused on the effects of outsourcing on productivity (Helg and Tajoli 2005; An-tonietti and Antonioli 2007), or following suggestions offered by certain experts within the clothing sector. Some of the most important such variables are: the costs that firms incur in order to carry out their businesses, such as the cost of goods and services (excluding outsourcing), advertising expenditure, wages and, of course, “the expenses incurred for the outsourced production and/or process-ing”, all expressed as logarithms; capital stock (net of depreciation) in logarithmic terms; the number of years the firm has been in business; office or factory floor space in square meters; the number of phases constituting the entire production process carried out by the firm (max. 19); the number of factory workers; the number of employees.
The following qualitative company characteristics have been introduced into models, in order to better control inter-firm heterogeneity, as dummies variables: the district (a particularly important role is played by the textile district of Carpi, while the motorsport district of Bologna and the biomedical district at Mirandola are also of importance even though they do not come within the textile sector; the market area where the manufactured goods are sold (this may be the municipality, the province, up to three regions, Italy, other UE or non-UE countries); the fact of whether business activities are conducted exclusively for itself or exclusively for third parties. Moreover, we have also created two dummy variables representing groupings of those phases of production that the firms can carry out. One of these dummies (head) represents the initial phases during which styles, models, proto-types, sizes and technical specifications are established, while the other dummy variable (body) includes the later phases, from cutting to packaging. Finally, we have also created a variable representing the composition of the labour force in terms of skills, computed as the percentage of white-collar workers.
3.3. Descriptive statistics
Table 3 shows some figures (mean and coefficient of variation or percentage) for the most important characteristics of those firms with employees, with a dis-tinction made between outsourcing and non-outsourcing firms. It should be pointed out that, given the limited size of the firms in the dataset, the outsourcing in question is exclusively of a national character. Table 4 gives the equivalent fig-ures for those firms without employees.
Starting with those firms employing workers (Table 3), what we notice is that those firms outsourcing work are, on average, newer and larger then their non-outsourcing equivalents, and have higher average EBITDA, value added, costs for goods and services and numbers of workers than the latter, although the for-mer spend less on labour since some of their labour is outsourced. Furthermore, outsourcing firms have fewer employees on average, and thus their per capita value added tends to be higher than that of non-outsourcing firms. Even if we were to limit our analysis to just one of the groups arising from the cluster analy-sis, the variability of certain characteristics such as per capita value added and la-bour costs, as shown by their CVs, appears almost as high.
TABLE 3
Characteristics of firms with employees
Outsourcing firms (61%) Non-outsourcing firms (39%)
Characteristics Mean (CV*100) Mean (CV*100)
EBITDA 127,703 (135) 71,310 (174)
Value Added 261,857 (147) 152,636 (144)
Per capita value added 120,584 (926) 214,486 (787)
Capital stock 135,680 (249) 84,506 (231)
Costs of goods and services 156,202 (222) 76,489 (382)
Outsourcing costs 180,063 (160) -
Labour costs 50,138 (1,401) 56,173 (883)
Number of workers 8.9 (143) 6.5 (94)
Number of white-collar employees 6.8 (181) 4.5 (129)
Age of company 13.2 (79) 16.0 (62)
Number of phases (max. 19) 6.7 (89) 3.3 (112) Floor area (m²) for production 221.5 (146) 153.8 (124) Percentage of white collar workers 0.07 (232) 0.03 (413)
% %
District of Bologna 16 7
District of Carpi 23 27
District of Mirandola 18 9
Exclusively for itself 19 7
Exclusively for third parties 67 84
Head phases 46 32
Municipal market area 6 18
Provincial market area 26 35
3 regions market area 37 38
National market area 30 9
UE market area 20 5
Non-UE market area 18 5
Moreover, the outsourcing firms tend to be particularly concentrated within the districts of Bologna and Mirandola (despite the fact that the Carpi industrial district is the most important of the three concerned, containing as it does a quar-ter of all the firms in the group). As was previously mentioned in Section 2, many outsourcing firms work exclusively for third parties (67%), thus creating a system of firms organized in “pyramid” fashion, where each firm focuses on few phases of production, and saves money by outsourcing the other ones. The available in-formation does not enable us to understand whether the subcontractors in ques-tion are located in the same area or not.
Those figures we have obtained for firms without employees (Table 4) are ob-viously lower than the previous ones, in terms of both the mean and the coeffi-cient of variation.
Furthermore, these employee-less firms appear to be specialized in fewer phases of the chain. In fact, the same difference between outsourcing and non-outsourcing firms that emerged with regard to those firms with employees, also emerges here, albeit to a lesser extent.
The differences in the EBITDA or per capita value added between outsourc-ing and non-outsourcoutsourc-ing firms cannot be seen as due only to outsourcoutsourc-ing as such, because as we have just said, outsourcing firms are on average larger than non-outsourcing firms. Therefore, we have to “purify” our evaluation of the effect outsourcing has on such indicators, of those company characteristics affecting the choice to outsource production.
TABLE 4
Characteristics of firms with no employees
Outsourcing firms (61%) Non-outsourcing firms (39%)
Characteristics Mean (CV*100) Mean (CV*100)
EBITDA 37,270 (83) 28,168 (101)
Value Added 38,132 (81) 50,963 (124)
Capital stock 29,706 (160) 16,539 (242)
Costs of goods and services 29,118 (378) 4,901 (829)
Outsourcing costs 53,811 (249) -
Number of workers 1.7 (49) 1.6 (80)
Age of company 10.6 (90) 11.4 (84)
Number of phases (max. 19) 4.4 (107) 1.8 (117) Floor area (m²) for production 60.2 (102) 63.9 (75)
% %
District of Bologna 13 7
District of Carpi 31 23
District of Mirandola 14 10
Exclusively for itself 17 7
Exclusively for third parties 71 90
Head phases 41 17
Municipal market area 13 17
Provincial market area 39 31
3 regions market area 37 50
National market area 11 1
UE market area 6 1
Non-UE market area 6 1
4. ECONOMETRIC MODELS FOR EVALUATION OF OUTSOURCING EFFECTS
We propose to use a Tobit IV type model (Amemija 1986) to evaluate the ef-fects of outsourcing on per capita value added and gross earning before taxation (both expressed as logarithms). This kind of model has been originally proposed in “impact analysis”, as it enables the effect of a treatment on a target phenome-non in a phenome-non-experimental context to be evaluated, taking account of the self-selection of those units being treated. Nevertheless, this kind of model is not of-ten used since it requires information that is seldom available.
The model suggested was estimated for each of our target variables. It consists of two regression equations, one for the group of the outsourcing firms, and one for the group of the non-outsourcing firms: this would be sufficient if the alloca-tion of each company to the groups were conducted at random.
1. outsourcing firms
2. non outsourcing firms
Oi Oi O Oi NOi NOi NO NOi
y u y u x β x β (1)
However, this is not the case since the choice of resorting to outsourcing is based on a process of self-selection and the effect of outsourcing may interact with the firm’s characteristics. Therefore, a third equation determining allocation to the two groups is required, and this represents the selection of units subjected to a treatment.
Moreover, as we have already said, the source considered includes the impor-tant information on “the expenses incurred for the outsourced production and/or processing”, and this may be used as a dependent variable in the third
equation. In terms of impact analysis, we also know the entity of the treatment. In particular, we consider the logarithm of such expenses as a linear function of cer-tain firm’s characteristics.
This dependent variable is observed for the outsourcing firms, otherwise it is equal to 0 (censored regression model), expressed in the following model:
*
* *
*
3.
if 0 (outsourcing firms) 0 if 0 (non outsourcing firms)
i Ti T Ti i i i i i T u T T T T T x β (2)
Residuals of these three models relating to the same firms may be correlated. This three-equation model is known as the IV type Tobit model (Amemija 1986).
O NO T u u u 2 , 2 3 , 2 , , 0 , 0 O O T NO NO T O T NO T T N 0 (3)
In our case, we have also introduced “the expenses incurred for the out-sourced production and/or processing” among the explanatory variables of the model for the outsourcing firms (equation 1), so as to introduce a small degree of simultaneity in the system of equations (Lee 1993).
As identification problems may arise for the variance-covariance matrix in (3), parameters of this kind of more complex Tobit models are estimated using the two-step Heckman method (Heckman 1974; 1976).
The following explanation of such a method aims to facilitate interpretation of the results. In rewriting the model in the form of a conditional expectation, the self-selection problem is represented by a missing significant explicative variable, given by the inverse of the Mills’ ratio, the function, which has to be added to the explicative variables in all the equations:
* 1 1 1 1 * 1 1 , * 1 1 , 1. E( 0 ) ( ) ( ) where ( ) ( ) 2. E( 0 ) ( ) 3. E( 0 ) ( ) i i Ti T T Ti T T Ti T T Ti T T Ti T T Oi i Oi O O T T Ti T T NOi i NOi NO NO T T Ti T T T T Y T Y T x β x β x β x β x β x β x β x β x β (4)
The first step of the Heckman method consists in estimating the ratio βT/σT by
applying the maximum likelihood to the Probit model corresponding to the equa-tion determining the allocaequa-tion to the two groups (first equaequa-tion in (4)). The sec-ond step consists in estimating the parameters of the three regression models (in-cluding the function as an explicative variable) using the least squares method.
However, the regression coefficients of the function in the target variable equa-tions (equation 2 and 3 in (4)) contain the covariances between residuals. There-fore, a significance test for the correlation between residuals coincides with a test for the significance of the function.
Finally, it is important to underline that the cross-sectional nature of the dataset makes particularly delicate the causal interpretation of the estimates obtained. It is possible a reverse causation for some variables such as the expenses for outsourc-ing, since more productive or profitable firms may tend also to make greater use of outsourcing. However, the lack of adequate instrumental variables does not allow us to explicitly test the direction of the causal relationship between variables.
5. ESTIMATION RESULTS
The estimated models show quite a good fit, evaluated by R , above all for 2 EBITDA (see Tables 5, 6 and 7). The graphical analysis of residuals enables us to exclude problems due to the heteroschedasicity of residuals, and the symmetry of their distribution appears acceptable. The logarithmic transformation of the de-pendent variables certainly attenuates such problems to a certain extent.
The following subsections 5.1 and 5.2, show the results obtained for firms with employees, and firms without employees, respectively.
5.1. Firms with employees
Tables 5 and 6 show the econometric estimates obtained using the IV type Tobit model estimated for the EBITDA and the Per Capita Value Added of the firms with employees. Each table presents estimates of the parameters of the model’s three equations in three separate columns. Due to the considerable number of possible auxiliary variables, only those resulting significant according to a process of back-ward elimination, were kept in the model and presented in the Tables. Starting with the model for EBITDA estimated for those firms with employees, the test for the significance of correlations between residuals shows that the correlation coefficient for the outsourcing firms is significant, at p_value < 0.05, and negative, whereas this is not the case for the non-outsourcing firms. Therefore, the regression model for the logarithm of the EBITDA of non-outsourcing firms may also be estimated sepa-rately from the model for outsourcing costs. The estimation of this individual model gives estimates of coefficients that are almost identical to the ones given in the table (which is why these results are not reported). If, on the other hand, we did not model the self-selection of the outsourcing firms, we would overestimate the effect of outsourcing on EBITDA. The first two columns in the table show those factors determining the choice to outsource, and the entity of outsourcing. The coefficients of the auxiliary variable introduced as a logarithmic transformation (log-log model) may be interpreted as elasticities. Thus, for example, if the costs of goods and ser-vices increases by 1%, the outsourcing costs decrease on average by 0.23%, all other conditions being equal. Capital stock has a similar effect, albeit positive. Besides if
the age of the firm increases by one year, outsourcing costs fall by 17%, while if the floor space used for production increases by one square meter, outsourcing costs increase by 0.3%. Certain dummy explanatory variables were found to be significant when describing outsourcing expenditures, such as two districts, the one in Bologna and the one in Mirandola, where firms tend to resort more to outsourcing than firms situated in other areas do, whereas for those firms conducting the initial phases of the production process, the contrary is true. As regards the effects on EBITDA in the case of the outsourcing firms, we can see that it increases with the cost of goods and services, labour costs and outsourcing costs, together with a series of other company characteristics. In particular, a 1% increase in outsourcing costs causes an average increase in EBITDA of 0.10%. Elasticity is lower for the other goods and services costs, whereas it is higher for labour costs. If we compare these results with those obtained for non-outsourcing firms, which of course do not incur outsourcing costs, we see that labour costs do not constitute a significant variable in the model for non-outsourcing firms. This result, while it may appear surprising at first, is fur-ther explained by the graphs in Figure 1, where firms are plotted according to the logarithm of EBITDA and the logarithm of labour costs.
TABLE 5
Results for firms with employees: effects on EBITDA L(outsourcing costs)
All firms Outsourcing firms L(EBITDA) Non-outsourcing firms L(EBITDA)
Covariate Estimate Covariate Estimate Covariate Estimate L (capital stock) 0.205***
(3.42) Constant 7.366*** (19.07) Constant 9.814*** (29.51) L (costs for good and
services) -0.226*** (-3.26) L (costs for good and services) 0.032*** (3.07) L (costs for good and ser-vices) 0.036*** (2.67) Age of company -0.173***
(-6.56) L(labour costs) 0.261*** (7.50) L (capital stock) 0.038*** (2.60) No. of phases 0.618***
(6.58) L (outsourcing costs) 0.101*** (5.24) No. of workers 0.072*** (8.83) Head phases -1.772**
(-2.17) No. of workers 0.011*** (2.97) Share of white collar work-ers 0.862** (1.98) Assembly phase 2.003***
(3.48) Share of white collar workers 0.651*** (2.74) Age of company 0.011** (2.19) Packaging phase 2.592***
(3.48) District of Carpi 0.282*** (3.23) District of Mirandola -0.389** (-2.54) District of Bologna 3.229***
(4.41) Exclusively for itself -0.279** (-2.49) Exclusively for third parties 0.340** (2.24) District of Mirandola 4.090***
(5.84) Office space 0.002*** (2.77) Assembly phase -0.462*** (-4.56) Factory space 0.003***
(3.49) Cutting phase 0.352*** (3.76) Ironing phase -0.163* (-1.69)
Assembly phase -0.443***
(-3.98) Municipal market area -0.872*** (-4.34)
Ironing phase -0.234***
(-2.71) Provincial market area -0.558*** (-2.88) Municipal market area -0.313*
(-1.87) Market area: 3 regions -0.534*** (-2.87) Provincial market area -0.458***
(-3.59) Market area: 3 regions -0.277**
(-2.52) T 6.934*** (30.01) O 0.907*** (26.75) NO 0.674*** (22.61) O,T -0.233** (-2.35) NO,T -0.180 (-1.00) R2=0,71 R2=0,57
Figure 1a – Firms with employees by log(EBITDA) and labour costs (grey triangle outsourcing firms; black circle non-outsourcing firms.)
Figure 1b – Firms with employees by log(EBITDA) and log(labour costs) (grey triangle outsourcing firms; black circle non-outsourcing firms.)
The outsourcing firms (grey triangle) and the non-outsourcing firms (black cir-cle) display relationships characterised by different slopes. The non-outsourcing firms’ slope is not steep. As we have said, these firms’ labour costs are generally higher than those of other firms. So if they employ more labour, their value added will increase, whereas their EBITDA will not.
Moreover, the results in Table 5 show that EBITDA is positively effected by the number of employees, and the proportion of white-collar workers, while it is lower for firms with a restricted market area (up to three regions), for those firms working exclusively on their own (if they do not outsource), for firms in the Mirandola district (if they do not outsource), and it is higher for the firms in the Carpi district (if they outsource) and for firms working exclusively for on behalf of third parties (if they do not outsource).
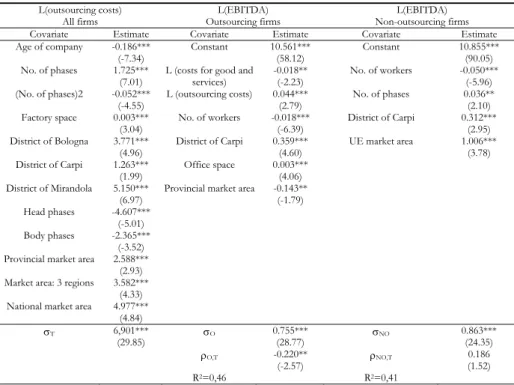
Table 6 below enables us to compare the results obtained, for firms with em-ployees, regarding EBITDA, with the corresponding figures obtained for Per Capita Value Added. In particular we are interested in comparing the effects of outsourcing on each of our two target variables.
TABLE 6
Results for firms with employees: effects on Per-Capita Value Added L(outsourcing costs)
All firms Outsourcing firms L(EBITDA) Non-outsourcing firms L(EBITDA)
Covariate Estimate Covariate Estimate Covariate Estimate Age of company -0.186***
(-7.34) Constant 10.561*** (58.12) Constant 10.855*** (90.05) No. of phases 1.725***
(7.01) L (costs for good and services) -0.018** (-2.23) No. of workers -0.050*** (-5.96) (No. of phases)2 -0.052***
(-4.55) L (outsourcing costs) 0.044*** (2.79) No. of phases 0.036** (2.10) Factory space 0.003***
(3.04) No. of workers -0.018*** (-6.39) District of Carpi 0.312*** (2.95) District of Bologna 3.771***
(4.96) District of Carpi 0.359*** (4.60) UE market area 1.006*** (3.78) District of Carpi 1.263***
(1.99) Office space 0.003*** (4.06) District of Mirandola 5.150***
(6.97) Provincial market area -0.143** (-1.79) Head phases -4.607***
(-5.01) Body phases -2.365***
(-3.52) Provincial market area 2.588***
(2.93) Market area: 3 regions 3.582***
(4.33) National market area 4.977***
(4.84) T 6,901*** (29.85) O 0.755*** (28.77) NO 0.863*** (24.35) O,T -0.220** (-2.57) NO,T (1.52) 0.186 R2=0,46 R2=0,41
Notes: 892 firms. t-value in brackets, *** 1% significance, ** 5% significance, * 10% significance.
We may observe that also in this model, the correlation between the residuals of the equation for outsourcing costs, and the residuals of the model for per cap-ita Value Added of the outsourcing firms, is both significant and negative, while the corresponding correlation for non-outsourcing firms is not.
Therefore, if we were once again to ignore self-selection, we would overesti-mate the effect of outsourcing on the per capita Value Added of the outsourcing firms.
The coefficient of outsourcing costs is again significant in this model, although it is lower than before. If outsourcing costs increase by 1%, then per capita Value Added increases on average, all other things being equal, by 0.04%. Hence out-sourcing effects productivity, although the overall benefits to the enterprise are greater.
These findings are consistent with those obtained by Giannelle and Tattara (2009), who evaluated the impact of delocalization on the same indicators consid-ered in this present study, albeit for a sample of large clothing manufacturers in
another Italian region (the Veneto) and using a different methodology. They evaluated the said impact from outsourcing as being higher, since they took very large firms into consideration; however, they also discovered a greater benefit to the enterprise than to workers.
The other factors affecting the decision to outsource work, and the entity of outsourcing, are similar to those already examined in the case of the EBITDA model, while per capita Value Added is influenced by a more limited number of auxiliary variables.
The per capita Value Added decreases as the number of employees and the cost of intermediate inputs decrease (this is only significant for outsourcing firms), whereas it increases as office space increases (for outsourcing firms only), and is higher for those firms within Carpi’s industrial district and for those selling their products to UE countries (in the case of non-outsourcing firms).
5.2. Firms without employees
Firms without employees are a group of very small firms which are, neverthe-less, an important feature of the overall Italian economy. Furthermore, regardless of their limited size, a non-negligible percentage of these firms (19%) outsource part of their production, and this is why we decided not to exclude them from our analysis.
The results obtained for the EBITDA model are given in Table 7. The first thing we notice is that the results for the coefficients of correlation are once again the same, that is, only the coefficient regarding outsourcing firms is significant. Moreover, many of the auxiliary variables included were also present in the corre-sponding model estimated for those firms with employees. One very interesting thing concerns the elasticity of EBITDA compared to outsourcing costs, which at 0.095 is almost equal to that estimated for those firms with employees (0.101). This result appears to be very robust in relation to variations in the set of auxiliary variables. Furthermore, the propensity to outsource is greater among newer firms, firms characterised by higher capital stock (a proxy of the size of the firm), by greater advertising expenditure, and by carrying out more phases of the produc-tion process.
Among outsourcing firms, the elasticity of EBITDA in relation to outsourcing costs is greater than that in relation to spending on other intermediate inputs, which is 0.058, as was also the case for firms with employees. Other important characteristics include the number of workers (in this case workers who are not employees, as family members and associates who work in the firm), the fact of working exclusively for third parties, which has a positive effect on EBITDA, and the fact of carrying out the assembly phase, which is the core function of the production process and has, among all the phases, the greatest impact on the tar-get variables in question (in this case it has a negative effect on EBITDA). If we examine non-outsourcing firms, EBITDA is found once again to be positively effected by the cost for goods and services (albeit subject to a lower degree of elasticity than that seen in the case of outsourcing firms), by capital stock, by
fac-tory space and by the size of the workforce. Moreover, EBITDA increases as the market area in question goes from municipal to national level, whereas it is lower for those firms working exclusively for themselves.
TABLE 7
Results for firms with employees: effects on Per-Capita Value Added L(expenses for outsourcing)
All firms L(Per Capita Value Added) Outsourcing firms L(Per Capita Value Added) Non outsourcing firms
Covariate Estimate Covariate Estimate Covariate Estimate Constant -18.837***
(-9.25) Constant 8.701*** (24.80) Constant 6.248*** (9.36) L (capital stock) 1.458***
(7.26) L (costs for good and services) 0.058*** (3.08) L (costs for good and services) 0.028*** (3.25) Age of company -0.262***
(-3.94) L (expenses for out-sourcing) 0.095*** (3.65) L (capital stock) 0.033*** (3.88) (No. of phases)2 0.052***
(5.01) No. of workers 0.371*** (4.84) No. of workers 0.138*** (5.97) L (advertising costs) 0.951***
(3.81) Exclusively for third parties 0.621*** (3.59) Factory space 0.005** (8.11)
Assembly phase -0.447***
(-3.43) Exclusively for itself -0.530** (-4.65)
Municipal or
provin-cial market area 2.703*** (4.05) Market area: 3
re-gions 2.975*** (4.45)
National market area 3.215***
(4.59) T 10.989*** (14.55) O 0.807*** (12.03) NO 0.676*** (30.00) O,T -0.467*** (-3.86) NO,T (-1.55) -0.289 R2=0,51 R2=0,52
Notes: 825 firms. t-value in brackets, *** 1% significance, ** 5% significance, * 10% significance.
5. CONCLUSIONS
This work aims to estimate the effect of outsourcing on the productivity and profitability of small firms within the clothing sector of one Italian region, Emilia-Romagna, which is characterized by a high degree of entrepreneurial activity and a particularly high propensity towards exporting products in that particular sector. The data source we utilise contains detailed information on firms’ outsourcing costs which is not provided by any other archive or survey, and which allows us to quantify the financial benefits of outsourcing parts of the production process. To this end, we use IV Type Tobit models which allow us to take account of the self-selection of outsourcing firms in the estimation process. Our findings reveal that outsourcing has a positive effect on both productivity and, in particular, on profitability. This is in keeping with the findings of another study (Giannelle and Tattara 2009) and would seem to indicate that small businesses place immediate profit before productivity and growth. At least with regards to the firm’s out-sourcing decision, the main object appears to be the increment of profit and, sec-ondly, the improvement of production efficiency.
At this point it would be interesting to conduct a longitudinal analysis – feasi-ble only if data for subsequent years were availafeasi-ble – in order to discover whether
outsourcing produces a “one-off effect” when begun, or whether it also implies increasing productivity/profitability during subsequent periods thereafter.
AKNOWLEDGEMENTS
The authors are sincerely gratefull to the reviewers for their valuable suggestions which elementally helped in improving the paper.
Department of Statistics IGNAZIO DRUDI University of Bologna SILVIA PACEI
REFERENCES
T. AMEMIJA, (1985). Advanced Econometrics. Basil Blackwell, Oxford.
R. ANTONIETTI, D. ANTONIOLI, (2007). Production Offshoring and the Skill Composition of Italian
Manufacturing Firms: A Counterfactual Analysis, Working Papers 2007.97, Fondazione Eni
Enrico Mattei.
R.E. BALDWIN, (1999). Market Integration, Regionalism, and the Global Economy. Cambridge Uni-versity Press, Cambridge.
G. BECATTINI,(2004). Industrial Districts. A New Approach to Industrial Change. Edward Elgar, Cheltenham.
L. BECCHETTI, S. ROSSI, (2000), The Positive Effect of Industrial District on Export Performance of
Italian Firms, “The Review of Industrial Organization”, 16(1), 53-68.
L. BENGTSSON, M. DABHILKAR, (2009), Manufacturing Outsourcing and its Effect on Plant
Perform-ance-Lessons for KIBS outsourcing, “Journal of Evolutionary Economy”, 19, 231-257.
L. BENGTSSON, L. VON HARTMAN,(2005), Outsourcing Manufacturing and its Effect on Firm
Perform-ance, Paper presented at CINet, Brighton 4-6 September 2005.
S. BRUSCO, (1982), The Emilian Model: productive Decentralization and Social Integration,
“Cam-bridge Journal of Economics”, 6, 167-184.
L. CASSIA, A. COLOMBELLI,(2009), Growth Factors in Medium-Size Enterprises: the Case of an Italian
Region, “International Entrepreneurship and Management Journal”, on line from 22
October 2009.
CAPITALIA (2005), Indagine sulle imprese italiane. Rapporto sul sistema produttivo e sulla politica
in-dustriale, October 2005, in Italian.
D. CASTELLANI, A. ZANFEI,(2007). Internationalisation, Innovation and Productivity: How do Firms
Differ in Italy?, “The World Economy”, Special Issue on “Export and Growth”, 30(1),
156-176.
F. DI NICOLA, (2007). Gli studi di settore: fondamenti, risultati e prospettive, Estratto Rapporto “Politiche pubbliche e redistribuzione”, ISAE, October 2007, in Italian.
J.H. DUNNING,(2000). Regions, Globalization, and the Knowledge-Based Economy. Oxford Univer-sity Press, Oxford.
P. EVERAERT, G. SARENS, J. ROMMEL, (2010), Using Transaction Cost Economics to explain outsourcing
of accounting, “Small Business Economics”, 35, 93-112.
M. FREO, A. GUIZZARDI, G. TASSINARI,(2011),An Insight to the Small Firms Fragmentation Under the Global Competition From a Machinery Industrial District, “International Journal of
Glob-alization and Small Firms”, 4(3), 191-205.
footwear and clothing industry, in M. Morroni (ed.), “Corporate Governance, Organization
and the Firm. Co-operation and Outsourcing in the Global Economy”, Edward Elgar, Cheltenham.
B. GÖRZIG, A. STEPHAN, A., (2002), Outsourcing and Firm-Level Performance, German Institute for Economic Research, Discussion Paper 309.
G. GRAZIANI (2001). International Subcontracting in the Textile and Clothing Industry, in S.W. Arndt, H. Kierzkowsky, “Fragmentation. New Production Patterns in the World Economy”, Oxford University Press, Oxford.
G.M. GROSSMAN, E. HELPMAN, (2005), Outsourcing in a Global Economy, “Review of Economic Studies”, 72(250), 135-159.
K. HARRISON,(2004), Is International Outsourcing Ethical?, “Machine Design”, 76, 16, 105.
J.J. HECKMAN,(1974), Shadow prices, market wages, and labor supply, “Econometrica”, 42, 679-693.
J.J. HECKMAN (1976), The common structure of statistical models of truncation, sample selection, and
limited dependent variables and a simple estimator for such models, “Annals of Economic and
Social Measurement”, 5, 475-492.
R. HELG, L. TAJOLI,(2005), Patterns of international fragmentation of production and the relative
de-mand for labour, “North American Journal of Economics and Finance”, 16(2), 233-254.
E. HELPMAN, M.J. MELITZ, S. YEAPLE, (2004). Exports Versus FDI with Heterogeneous Firms, “American Economic Review”, 94(1), 300-316.
A. HIJZEN, (2006), International Outsourcing, Technological Change, and Wage Inequality, “Review of International Economics”, 15(I), 188-205.
D. HUMMELS,(2007), Transportation Costs and International Trade in the Second Era of
Globaliza-tion, “Journal of Economic Perspectives”, 21(3), 131-154.
H.I. KULMALA, J. PARANKO, E. UUSI-RAUVA,(2002), The Role of Cost Management in Network
Rela-tionships, “International Journal of Production Economics”, 79(1), 33-43.
M.C. LACITY, L.P. WILLCOCKS,(1998), An Empirical Investigation of Information Technology Sourcing
Practices: Lessons From Experience, “Manage Information System”, 22(3), 363-408.
L.F. LEE, (1993), Multivariate Tobit Models in Econometrics, in G.S. Maddala, C.R. Rao and H.D. Vinod (eds), “Handbook of Statistics 11 – Econometrics”, Chapter 6 in, Elsevier Science Publishers B.V., The Netherlands.
S. MARIOTTI, M. MULTINELLI, L. PISCITELLO,(2008), The Internationalization of Production by Italian
Industrial Districts’ Firms: Structural and Behavioural Determinants, “Regional Studies”, 42(5),
719-735.
M. MAZZANTI, S. MONTRESOR, P. PINI,(2007), Outsourcing and transaction costs in “real” time and
space: evidence for a province of Emilia-Romagna, “The ICFAI Journal Of Industrial
Eco-nomics”, 4, 7-22.
S. MENGHINELLO, (2004), Local Engines of Global Trade: The Case of the Italian Industrial Districts, in G. Cainelli, R. Zobolo (eds.) “The Evolution of Industrial Districts. Changing Gov-ernance, Innovation, and Internationalization of Local Capitalism in Italy”, Physica Verlag, Heidelberg.
J.M. MUNOZ, D.H.B. WELSH,(2006), Outsourcing in the IT Industry: The Case of the Philippines, “In-ternational Entrepreneurship and Management Journal”, 2, 111-123.
OECD (2007), Moving Up the Value Chain: Staying Competitive in the Global Econom. Main
Find-ings, Technical Report.
K.B. OLSEN, (2006), Productivity Impacts of Offshoring and Outsourcing: a Review, OECD Science, Technology and Industry Working Paper, 2006(1).
L. PISCITELLO, F. SGOBBI,(2004), Globalisation, E-Business and SMEs: Evidence from the Italian
W. SCHNEDLER,(2005), Likelihood Estimation for Censored Random Vectors, “Econometric Re-view”, 24(2), 195-217.
SMI(2009), L’industria Tessile-Moda in Italia, in “Rapporto 2008/2009. Il quadro generale”,
Milano, 9 June 2009.
P. WINDRUM, A. REINSTALLER, C. BULL,(2009), The Outsourcing Productivity Paradox: Total
Out-sourcing, Organisational Innovation, and Long Run Productivity Growth, “Journal of
Evolution-ary Economy”, 19, 197-229.
SUMMARY
Who benefits from outsourcing? A study of one italian region’s small firms
This paper analyses the production outsourcing of Emilia-Romagna’s small clothing manufacturers, using a new rich firm-level dataset. This dataset has the considerable ad-vantage of containing interesting information about the outsourcing of certain phases of the production process that no other data source offers. The production process of these firms, which may be of a totally integrated or more fragmented nature, is thus analysed, and the effects of outsourcing are investigated. Since the analysis of the impact of out-sourcing at the firm level has always focused more on productivity than on profitability (Olsen 2006), we are going to study the impact of outsourcing decisions both on a firm’s value added and on its gross earnings, by estimating econometric models. These models allow us to incorporate a firm’s outsourcing propensity into the impact evaluation, by ad-justing for possible selection bias (Amemija 1985; Schnedler 2005). Our findings show that outsourcing has a positive effect on both productivity and, in particular, on profit-ability, thus confirming that Italian small clothing businesses tend to place immediate profit before productivity and growth.