A novel regulatory unit in the N-terminal
region of c-Src
Miguel Arbesú Andrés
Aquesta tesi doctoral està subjecta a la llicència Reconeixement 3.0. Espanya de Creative
Commons.
Esta tesis doctoral está sujeta a la licencia Reconocimiento 3.0. España de Creative
Commons.
A novel regulatory unit in the N-terminal
region of c-Src
Miguel Arbesú Andrés
A thesis presented for the degree of PhD in Organic Chemistry
Supervised by: Professor Miquel Pons Organic Chemistry section
Inorganic and Organic Chemistry department Faculty of Chemistry
I, Miguel Arbesú Andrés, confirm that the work presented in this thesis is my own. Where information has been derived from other sources, I confirm that this has been indicated in the thesis.
In re mathematica scientifica ars proponendi quaestionem pluris facienda est quam solvendi.
Summary
c-Src is a central player in several cellular signaling pathways. It controls important cellular processes like cellular proliferation, survival or motility. Therefore, a number of tumoral diseases have been related to abnormal c-Src activity. Among them, colorectal cancer stands out, as c-Src deregulation correlates tumor with progression and clinical outcome.
This tyrosine kinase is part of a larger group of functionally and structurally related proteins termed Src Family Kinases. These proteins share the same domain architecture: a cassette formed by a catalytic domain (SH1), two regulatory domains, SH2 and SH3, and a variable intrinsically disordered region (the Unique domain) that ultimately anchors to the inner face of the cellular membrane via the N-terminal SH4 domain, also disordered. The sequence and structure of the cassette are highly conserved, and thus unsurprisingly Src Family Kinases perform closely related and often overlapping functions. However, the role of intrinsically disordered regions has remained unclear, although they are known to be functionally relevant.
In this work, the structural and functional relationship between the intrinsically disor-dered SH4 and Unique domains with the neighboring folded SH3 domain in c-Src is explored. Interactions between disordered and ordered proteins are often characterized by the formation of complexes that are specific and functional but structurally heteroge-neous. Moreover, conformational plasticity is a fundamental feature for function. These assemblies are known as fuzzy complexes. Here this theoretical framework, usually ap-plied to isolated partners, is extended to the intramolecular interface between covalently bound domains instead of isolated pairs. The concept of fuzzy binding is also used in order to describe interactions based on sets of dynamic, transient, and promiscuous contacts between ill-defined sets of interactors.
In order to characterize the system, an integrative strategy using short and long range Nuclear Magnetic Resonance techniques and Small Angle X-ray Scattering is applied to several constructs containing different combinations of bound or isolated domains. It is demonstrated that the folded SH3 domain acts as a scaffold for the disordered region, which interacts in a specific manner with its partner. Both disordered domains, SH4 and Unique, are involved in the process albeit they contribute differently. Additionally, it is shown that the Unique domain is not a random coil, but contains a significant degree of pre-arrangement that is independent of the scaffold.
Sequence determinants are then searched by comparison of the sequences of different Src Family Kinases. Four conserved phenylalanine residues are found and their implication in Unique domain pre-organization and Unique:SH3 domain interaction tested. All these amino acids are found to favor compaction of the intrinsically disordered region, and at the same time to perturb close contact with the scaffold. In addition, mutations in the interacting zones of the SH3 domain are also studied to test reciprocity. In all, the fuzzy complex model is proven for the SH4:Unique:SH3 system.
Then, the results are extrapolated to the full-length c-Src to test its biological relevance. A co evolutionary analysis suggests that the fuzzy model may be a general feature for the whole Src Family, so the closest member of the family, Yes, is also tested experimentally. The initial results on long-range contacts suggests a similar arrangement between the scaffold and the disordered region.
In all, it is suggested that plastic, fuzzy interfaces between ordered and disordered domains may be a relevant mode for the transmission of functional information within multidomain proteins.
Finally, a first approach for a structural study of the c-Src fuzzy complex in a native-like lipid environment, including natural co-translational modifications, is presented. A protocol for sample preparation is developed and Dynamic Nuclear Polarization solid state NMR is shown to be an adequate tool for further analysis.
Preface
This thesis was developed at the Biomolecular NMR group of the University of Barcelona under the supervision of Professor Miquel Pons, within the project Src Unique domain
signaling in colorectal cancer funded by the Fundació Marató TV3. The PhD internship
at the Leibniz-Forschungsinstitut für Molekulare Pharmakologie in Berlin was funded by Instruct, a Landmark ESFRI project.
The document is organized as follows:
• An introduction to the topics of c-Src, intrinsically disordered proteins, and fuzzy complexes, followed by a bullet point list of objectives.
• Five sections of results sharing the same general structure: exposition of the results, and brief discussion. The first one, 2.1, contains a small introduction on previous results. The last section, 2.4, summarizes the results of my internship and can be regarded as an independent unit, with its own introduction to the matter and to the experimental approach used.
• An overall discussion in terms of the concepts developed along the introduction is presented, with a final list of conclusions.
• A Methods & Materials section with details on the experimental aspects and data treatment.
• An Appendix containing the original data from which some excerpts shown in the results section were derived.
The results derived from this work have been published under references Maffei et al. (2013), Maffei (2015) and Arbesú et al. (2017):
Maffei, M. et al., 2013. Lipid Binding by Disordered Proteins. Protocol Exchange.
Maffei, M. et al., 2015. The SH3 Domain Acts as a Scaffold for the N-Terminal Intrinsically Disordered Regions of c-Src. Structure, 23(5), pp.893–902. Arbesú, M. et al., 2017. The Unique Domain Forms a Fuzzy Intramolecular Complex in Src Family Kinases. Structure, 25(4), pp.630–640.e4.
Finally, I acknowledge that this document has been elaborated using the Markdown thesis template developed by Pollard et al. (2016).
Academic acknowledgements
I would like to start with the academic acknowledgments in reverse historical order. Thus, my thesis advisor Prof. Miquel Pons is the first on the list.
Miquel, I want to thank the trust you deposited in me for carrying on this project. I have sincerely done my best to meet your expectations. On that task I acknowledge your help, for your door and your brain have always been open. Your advise has definitely shaped me as a scientist. Not only that, but your human quality is also a standard I will try to keep up to. For all that, I will always be grateful.
In the second place, I want to thank all current and past Pons lab members whom have had the pleasure to work with and befriend. One follows his own path through his thesis, but it is the company of the others what makes it enjoyable and rewarding. Special words go to Dr. Mariano Maffei and Dr. Irene Amata, who handed me the c-Src project and got me started into molecular biology and NMR, respectively; Dr. João M.C. Teixeira for sharing his knowledge and thoughts; Dr. Tiago N. Cordeiro, and Dr. Ildefonso Marín who have been always available for advise and helpful discussion; and Laareb Irrem Mohammad Jabeen, the best heiress I could imagine for the myristoylated future of c-Src in the lab (best of luck with it!).
I would also like to mention here Dr. Margarida Gairí, from the NMR facility at the University of Barcelona for her expertise and kindness. Thanks too to Prof. Hartmut Oschkinat from the FMP in Berlin and all the team there (specially Michel-Andreas Geiger and Dr. Wing Ying Chow) for the worthwhile stay I enjoyed between them and the time and attention they dedicated to me.
Finally, I would like to thank all the persons involved in my past academic training, from high and primary school time at home to the B.Sc. at the University of Oviedo: Flor, Rafaela, Paco, Eusebio, Fernando, Nacho, Dolores, José Manuel, and so many others. It is back there where all started and it is because of them, all servants of the public education system as Miquel, that I came this far. It is my duty as their pupil to proudly acknowledge and defend their work.
Personal acknowledgements
In the personal aspect, I can only start by thanking my parents Javier and María Cruz, my sister Estela, and grandfather Lucio: this would not be possible without your love and unwavering support. You made me the person I am today. I sincerely hope this thesis will make you proud.
I would also like to remember here those who would have enjoyed to see this work done but, unfortunately, did not have the time: grandparents Manuel and Ángeles, father-in-law Jorge, and friend and fellow chemist Ramón. You are always in my thoughts.
I also want thank my dearest friends without simply falling in an enumeration that would result ironically unpersonal. To those from home, for making me feel as I never left whenever I am back, and to those I have met during these years in Barcelona and made it a new home for me: you know who you are and how much you are loved. Thanks for always being there.
And last, but not least, to my wife Sara. You have lived every day of this thesis from the inside, being my peace and my strength. Thanks for your love, patience, encouragement, and inspiration. I can not express how fortunate I am to go hand in hand with you. I love you.
Contents
Summary i
Preface iii
Academic acknowledgements v
Personal acknowledgements vii
Abbreviations xxv
1 Introduction 1
1.1 A historical overview of Src . . . 1
1.2 c-Src function, cell signaling, and cancer . . . 4
1.3 c-Src structure, cellular location and regulation . . . 8
1.3.1 The SH4 domain . . . 9
1.3.2 The Unique domain . . . 10
1.3.3 The SH3 domain . . . 11
1.3.4 The SH2 domain . . . 11
1.3.5 The SH1 (catalytic) domain . . . 12
1.3.6 The auto-inhibitory mechanism of c-Src . . . 12
1.4 The Src Family Kinases (SFKs) . . . . 14
1.5 Intrinsically Disordered Proteins (IDPs) . . . . 17
1.5.1 Defining intrinsic disorder . . . 18
1.5.2 Towards a new structure-function paradigm . . . 22
1.5.3 A brief history of intrinsic disorder protein and its relevance . . . 25
1.6 IDP functions, cellular signaling and disease . . . 27
1.7 Protein binding by disordered proteins . . . 30
1.8 The concept of fuzziness in protein complexes . . . 36
1.9 Tools and methods for the characterization of IDPs . . . 40
1.9.1 Ensemble modeling of IDPs . . . 42
1.9.2 Nuclear Magnetic Resonance and Intrinsically Disordered Proteins 44 1.10 Chemical Shift Perturbation (CSP) . . . . 46
1.11 Paramagnetic Relaxation Enhancement (PRE) . . . . 49
1.11.1 Brief introduction to paramagnetic NMR . . . 49
1.11.2 Paramagnetic spin labels . . . 50
1.11.3 PRE theory and application in short . . . 52
Objectives 55 2 Results 57 2.1 Scaffolding of the Intrinsically Disordered Region induced by the SH3 domain 58 2.1.1 Context . . . 58
2.1.2 The isolated SH4 domain interacts with multiple sites of the SH3 domain . . . 61
2.1.3 Absence or mutation of the SH4 domain reveals a complex scenario 62 2.1.4 CSP mapping of the effect of SH4 domain modifications . . . 66
2.1.5 Discussion . . . 69
2.2 Characterization of an intramolecular fuzzy complex using SAXS and PRE 73 2.2.1 SAXS reveals compaction of the IDR only in presence of the SH3 scaffold . . . 73
A new approach to ensemble model visualization . . . 76
2.2.2 Mapping of intramolecular long range contacts in presence of the SH3 domain . . . 81
Analysis of PRE-detected contacts in IDRs using the novel
∆
PRE mapping . . . 832.2.3 Long range contacts are mostly retained in absence of the SH3 domain 87 2.2.4 Unique domain pre-organization is independent of the SH4 domain 90 2.2.5 Discussion . . . 91
2.3 Search and assessment of sequence determinants for Unique domain inter-actions . . . 98
2.3.1 Sequence alignment of the SFKs . . . 98
2.3.2 Conserved aromatic residues mediate long range contacts within the Unique domain . . . 100
2.3.3 Aromatics also affect short range inter-domain interactions . . . . 102
2.3.4 Effect of Unique domain induced loops on inter-domain interactions 105 2.3.5 The role of histidines in the Unique domain . . . 107
2.3.6 Other functional mutations: SH3 loops . . . 109
2.3.7 Discussion . . . 111
2.4 Beyond Src . . . 117
2.4.2 Post-translational modifications affect transient contacts . . . 119
2.4.3 Coevolution analysis suggests that long range interactions are con-served in SFKs . . . 122
2.4.4 The case of Yes: Experimental evidences of a common mechanism 125 2.4.5 Discussion . . . 129
2.5 Solid state NMR studies on the lipid-bound myristoylated fuzzy complex 133 2.5.1 Review on previous results from myristoylated Src constructs . . . 133
2.5.2 ssNMR, DNP and membrane-bound proteins . . . 135
2.5.3 Obtention of isotopically labeled, lipid-bound, myristoylated samples140 Expression . . . 140
Purification . . . 142
Large unilamellar vesicles as lipid models for ssNMR samples . . . 143
Radical addition for DNP . . . 146
2.5.4 ssNMR results . . . 147
MAS ssNMR . . . 148
DNP MAS ssNMR . . . 150
2.5.5 Discussion . . . 154
3 Discussion 157 3.1 An IDR and an ordered scaffold form an intramolecular fuzzy complex . . 157
3.2 Specific sequence determinants rule conformational heterogeneity and func-tion . . . 159
3.3 Generality of the model in other SFKs . . . 160
3.4 Implications of fuzzy binding between ordered and disordered domains . . 161
3.5 Myristoylated USH3 results and perspectives . . . 163
Conclusions 165 4 Methods and Materials 167 4.1 Protein cloning and expression . . . 167
4.1.1 Standard expression: c-Src SH4-UD, USH3 and SH3, and Yes USH3.168 4.1.2 Myristoylated protein expression . . . 169
4.2 Standard protein purification . . . 169
4.2.1 Strep-tag affinity purification . . . 170
4.2.2 His-tag affinity purification . . . 170
4.3 Myristoylated protein purification . . . 171
4.4 Spin labeled sample preparation for PRE . . . 172
4.5 In vitro phosphorylation of SH4-UD A27C . . . 172
4.7 Solution NMR sample preparation . . . 173
4.8 Solid state NMR sample preparation . . . 173
4.9 Solution NMR acquisition and processing . . . 174
4.9.1 CSP experiment acquisition . . . 174
4.9.2 PRE experiment acquisition . . . 174
4.9.3 Assignment acquisition . . . 174
4.9.4 NMR data processing . . . 175
4.10 Solid state NMR acquisition and processing . . . 175
4.11 NMR data analysis . . . 175
4.11.1 CSP calculation . . . 176
4.11.2 PRE calculation . . . 176
4.11.3 Random coil PRE simulation . . . 176
4.11.4
∆
PRE calculation . . . 1764.12 Co-evolutionary analysis . . . 177
4.13 SAXS data analysis and modeling . . . 177
4.14 Buffer list . . . 177
5 Appendix 179 5.1 SFK sequence conservation . . . 179
5.2 Complete CSP mapping of the SH4
∆
mutants . . . 1825.3 PRE and
∆
PRE data sets of SH4-UD constructs . . . 1865.4 PRE and
∆
PRE data sets of USH3∆
SH4 mutants . . . 1885.5 PRE and
∆
PRE data sets of SH4-UD F#A mutants . . . 1905.6 Histidine signal variability between identical samples . . . 192
5.7 PRE and
∆
PRE data sets of SH4-UD pS17 . . . 193List of Figures
1.1 Key events in Src historical timeline until 2000. Reproduced with permis-sion from Martin (2001). . . 2 1.2 Phosphorylation/dephosphorylation reactions. . . 4 1.3 Human kinome map courtesy of Cell Signaling Technology, Inc. c-Src is
indicated as a red circle. AGC Containing PKA, PKG, PKC families; CAMK Calcium/calmodulin-dependent protein kinase; CK1 Casein ki-nase 1; CMGC Containing CDK, MAPK, GSK3, CLK families; STE Homologs of yeast Sterile 7, Sterile 11, Sterile 20 kinases; TK Tyrosine kinase; TKL Tyrosine kinase–like. . . 5 1.4 Oncogenic processes regulated by c-Src. Reproduced with permission from
Ishizawar & Parsons (2004). . . 6 1.5 Kinase inhibitors approved as of 2016 plotted over the human kinome map
shown in figure 1.4 with the names of targeted enzymes. Reproduced with permission from Wu et al. (2016). . . 7 1.6 c-Src domain architecture and sequence. . . 9 1.7 Cellular membrane binding mechanisms of receptor (left) non-receptor
(right) tyrosine kinases. A) Only myristoylation (labile); B) myristoyla-tion + electrostatics; C) myristoylamyristoyla-tion + palmitoylamyristoyla-tion. . . 10 1.8 c-Src X-ray structures of the closed (PDB:1SRC) and open (PDB:1Y57)
states. Notice that the IDR is missing in both. The domain color legend is the same as in figure 1.6. . . 13 1.9 c-Src activation mechanism. Reproduced with permission from Harrison
(2003). . . 13 1.10 Fraction of structural disorder among tyrosine kinases based on IUPred
scores (Dosztanyi et al. 2005), where 0 means ordered and 1 fully disor-dered, for A) the full length proteins or C) the cassette domains. On the right, the respective network similarity analysis (B, D). SFKs, including Frk, correspond to numbers 9 - 17 (see legend). Adapted with permission from Santos & Siltberg-Liberles (2016). . . 16 1.11 Protein backbone dihedral angles. Adapted with permission from original
1.12 Classical structural biology univocal sequence-structure-function relation-ships. . . 19 1.13 Free energy landscapes associated to different contents of disorder.
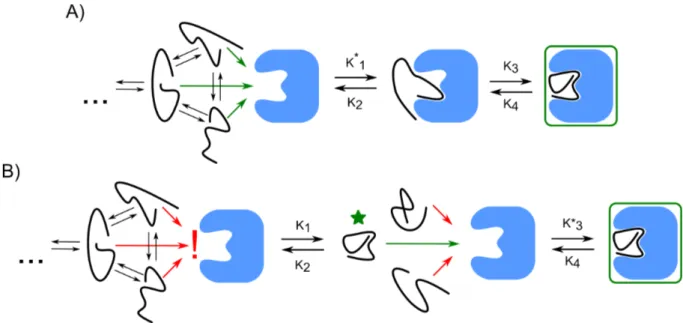
Repro-duced with permission from Flock et al. (2014). . . 21 1.14 A) Induced fit vs B) conformational selection models. Asterisks indicate
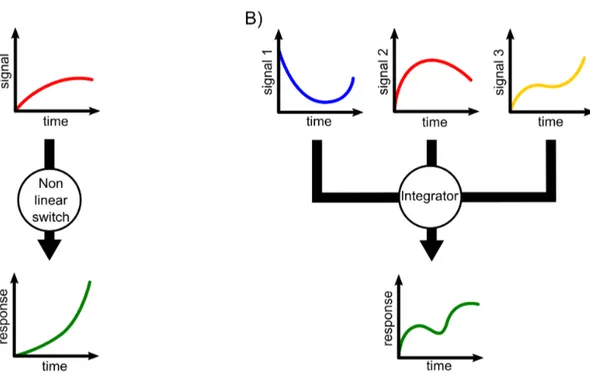
pseudo-first order steps. . . 23 1.15 Schematic representation of A) a non-linear switch, and B) a signal
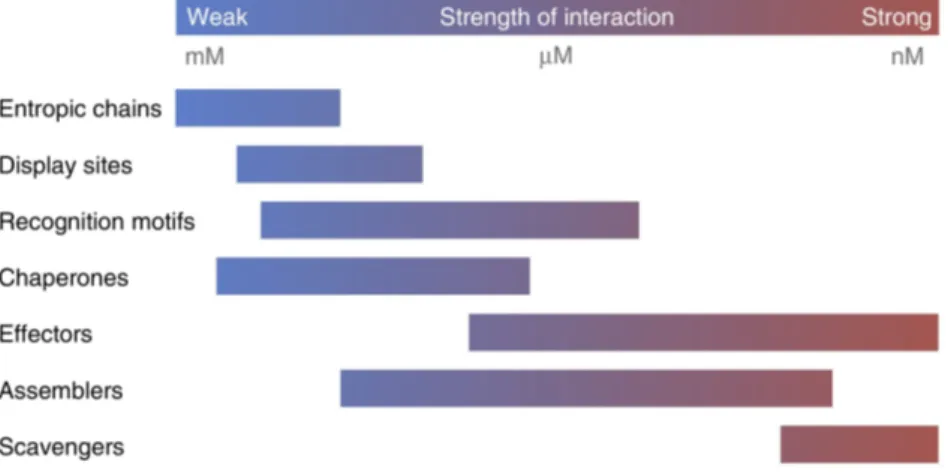
inte-grator. . . 30 1.16 Different affinity ranges of IDPs accomplishing different functions.
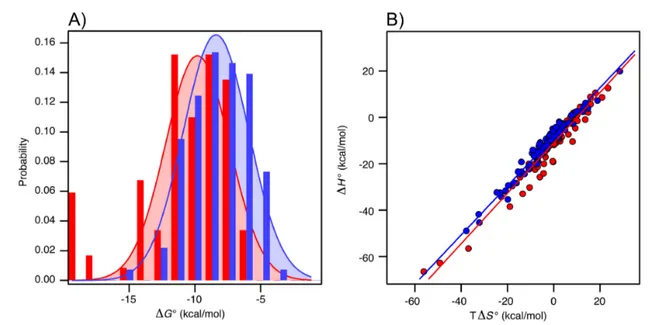
Repro-duced with permission from Tompa et al. (2015). . . 31 1.17 A)
∆G
◦ histograms and Gaussian fitting for complexes between orderedproteins with ordered (red) and disordered (blue) partners reported in Teilum et al. (2015); B)
∆H
◦ andT ∆S
◦ correlation in both cases, with the corresponding linear regressions. Adapted with permission from Teilum et al. (2015). . . 32 1.18 Distribution ofK
d values for complexes between intrinsically disorderedand ordered proteins in the DIBS database. Adapted with permission from Schad et al. (2017). . . 33 1.19 A) Calmodulin ITC-derived thermodynamic parameters with different
pep-tides; B) contributions of
∆S
conf ormational to total∆S
total. Adapted withpermission from Frederick et al. (2007). . . 35 1.20 Topological classes of fuzzy complexes: A) polymorphic; B) clamp; C)
flanking; D) random. Solid ribbons represent well defined bound stretches, whereas dotted ribbons are non-resolved but functional regions. Adapted with permission from Tompa & Fuxreiter (2008). . . 37 1.21 Different spatial scales represented over c-Src residues 1-150 (IDR + SH3
domain) . . . 41 1.22 Dynamic regimes and timescales. Adapted with permission from Kumar
& Balbach (2015). . . 45 1.23 1
H
−
15N
HSQC spectra of A) the N-terminal IDR of c-Src formed by theSH4 and Unique domains (acquired at 278 K), and B) the ordered c-Src SH3 domain (acquired at 298 K). . . 48 1.24 Examples of A) nitroxide and B) metal chelating spin labels. Leaving
groups for coupling are depicted in grey. Adapted with permission from Clore & Iwahara (2009). . . 51 1.25 Spin labeling of a cysteine side chain with MTSL. . . 52
1.26 Equation of nitroxide reduction by ascorbic acid. A simplified version showing the reducing activity of ascorbate is also shown with the structures of the relevant species (
HA
−: ascorbate anion;HA
·−: ascorbate radical; A: dehydroascorbic acid) . . . 52 2.1 c-Src construct guide. . . 57 2.2 PRE of USH3 and SH4-UD A59C (Pérez et al. 2009; Pérez et al. 2013)(black bars). The red lines represent the theoretical random coil profile as a reference (see sub-section 2.2.2). . . 59 2.3 CSP of USH3 WT vs the isolated SH4-UD and SH3 domains alone (top)
and in presence of the PxxP peptide (bottom). The red line represents a significance threshold defined in Methods and Materials. . . 60 2.4 CSP of SH3 upon addition of 1:10 excess SH4 peptide, both in the apo
(top) and PxxP ligand bound (bottom) forms. The red line represents a significance threshold defined in Methods and Materials. . . 61 2.5 CSP of SH4 mutant USH3 constructs vs the wild type reference. The red
line represents a significance threshold defined in Methods and Materials. When not shown, it is assumed to be at the noise baseline level. . . 63 2.6 CSP of SH4 mutant USH3 constructs vs isolated wild type SH3 reference.
The red line represents a significance threshold defined in Methods and Materials. . . 64 2.7 CSP of SH4 mutant USH3 constructs vs isolated wild type SH3 reference,
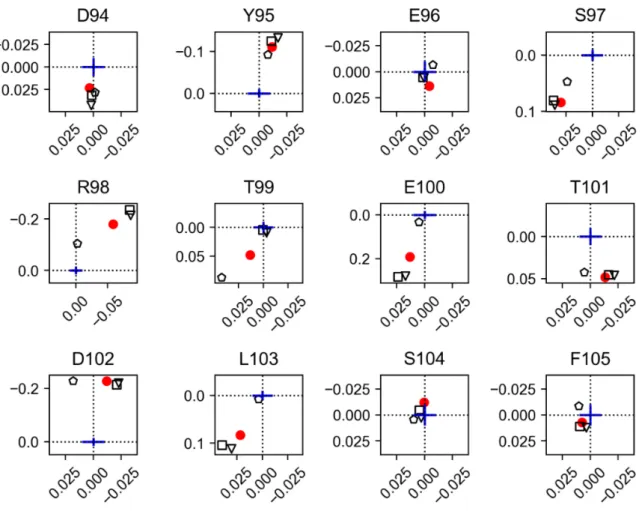
both complexed with the PxxP peptide. Only respective SH3 domains shown. The red line represents a significance threshold defined in Methods and Materials. . . 65 2.8 RT loop CSP mapping for USH3 WT (red dot), K5A S6A (triangle),
∆10
(square) and
∆20
(pentagon). The origin positions correspond to the re-spective isolated SH3 signals. Relative scale between∆δ
1H
(x axes) and∆δ
15N
(y axes) is indicated as a blue cross representing 0.01 ppm. . . . 672.9 nSrc loop CSP mapping for USH3 WT (red dot), K5A S6A (triangle),
∆10
(square) and∆20
(pentagon). The origin positions correspond to the respective isolated SH3 signals. Relative scale between∆δ
1H
(x axes)and
∆δ
15N
(y axes) is indicated as a blue cross representing 0.01 ppm. . 682.10 CSP induced by PxxP ligand VSL12 binding to the isolated SH3 domain. The significance threshold lays at the noise baseline. . . 69 2.11 SH3 domain complexed with VSL12 PxxP peptide (PDB:1QWF).
2.12 Scattering curves of SH4-UD and USH3 constructs. Experimental values are represented as grey dots, random coil fittings as black lines, and EOM fittings as colored lines (see below). . . 74 2.13 Kratky plots of SH4-UD and USH3 constructs. Experimental values are
represented as grey dots, random coil fittings as black lines, and EOM fittings as colored lines (see below). . . 74 2.14
R
ghistograms for the random coil (black) and EOM-selected (color) fittingensembles for SH4-UD and USH3 constructs. . . 75 2.15 A random USH3 conformer and the reference axes. . . 77 2.16
Cα
position aggregated projections for all Cartesian planes, both for therandom coil and EOM ensembles.
C
α density is represented in anincreas-ing blue - red color scale, while SH3 positions are depicted in bright red. . . . 79 2.17 Graphical representation of the D statistic between two arbitrary samples
(blue and orange). The red line represents the absolute difference between their respective cumulative probabilities. . . 80 2.18 D statistics between coordinate distributions of the random coil and EOM
ensembles for residues forming the IDR, over each Cartesian axis. . . 81 2.19 PRE profiles for USH3 constructs A1C, A27C, and A59C (Pérez et al.
2013). Cysteines indicate the respective MTSL spin label positions. The Flexible Meccano random coil simulations are shown in red for the IDRs. 82 2.20 PRE profiles for SH3 domains of USH3 constructs A1C, A27C, and A59C
plotted over PDB:4HXJ as a red-white color scale. Unassigned residues are colored in grey. . . 83 2.21 Effect of Gaussian filter size and spread (SD of the Gaussian
distribu-tion) over a dummy data set. The original sinusoidal signal is drawn as a blue line, over which random noise is added (orange dots). The different Gaussian-filtered signals are the red lines. . . 84 2.22 Example of how
∆
PRE profiles are constructed from experimental PREprofiles and random coil simulations. The data set used corresponds to SH4-UD A59C. Raw
∆
PRE values are black circles, while the smoothed profile is shown as a black solid line. . . 85 2.23∆
PRE profiles for the IDRs of USH3 A1C, A27C and A59C. The respectivespin label positions are indicated with red vertical lines. . . 86 2.24 Overlapped
∆
PRE profiles for the IDRs of USH3 A27C (purple) and A59C2.25
∆
PRE profiles of SH4-UD A2C, A27C and A59C. The respective spin label positions are indicated with red vertical lines. The respective heat maps are also provided (lower plots, top), along with those from the equivalent IDRs of USH3 constructs (lower plots, bottom). . . 88 2.26 Overlapped∆
PRE profiles for: top) SH4-UD A27C (blue) and A59C (red);bottom) IDRs of USH3 A27C (purple) and A59C (green). . . 89 2.27 Intermolecular PRE control between spin labeled SH4-UD A59C and 15N
SH4-UD. The red line indicates the expected no interaction intensity ratio value. The grey area represents a confidence interval of
±
3 SD of the experimental PRE values. . . 90 2.28∆
PRE profiles for the IDRs of USH3 A27C∆10
and∆20
. The spin labelposition is indicated with red vertical lines. The respective heat maps are also provided (lower plots, top), along with those from full length IDR (lower plots, bottom). . . 91 2.29 PRE profiles for SH3 domains of USH3 A27C full length,
∆10
, and∆20
plotted over PDB:4HXJ as a red-white color scale. Unassigned residues are colored in grey. . . 92 2.30 Overlapped
∆
PRE profiles for: top) SH4-UD A27C (blue) and A59C (red);bottom) IDRs of USH3 A27C (purple) and A59C (green). Phenylalanines and histidines positions are marked with vertical lines and text. Prolines are also marked, with a grey area delimiting positions
±1
around them. The 14RRR16 motif in the SH4 domain is highlighted in yellow. . . . . . 942.31 Cartoons depicting the network of long range contacts detected by PRE in SH4-UD and USH3 from all constructs. Spin label positions are highlighted in red in the sequences. Intra-IDR interactions are quantitatively repre-sented as red lines, while SH4-UD:SH3 contacts are qualitatively indicated with blue lines. . . 95 2.32 Alignment of c-Src homologues and closest SFKs from the SrcA subfamily.
Prolines are highlighted in green, phenylalanines in orange, and histidines in blue. Particularly conserved motifs containing hydrophobic residues are marked in yellow. . . 99 2.33
∆
PRE profiles of all SH4-UD F#A mutants. Spin label positions areindicated with red vertical lines, while F#A substitutions are drawn in blue. The respective heat maps are also provided (lower plots, top), along with those from the wild type reference (lower plots, bottom). *: The F64A construct corresponds to the triple63LFG65to63AAA65mutant above
2.34 CSP induced by each F#A mutation in USH3. F#A substitutions are indicated with blue lines. The red line represents a significance threshold defined in Methods and Materials. . . 103 2.35 SH3 domain residues affected by USH3 F#A mutations plotted over
PDB_4HXJ. Green: affected by F32A and/or F54A substitution; blue: affected by F64A and/or F67A replacement; purple: affected by both mutation pairs (F32-F54 and F64-F67). . . 104 2.36 CSP induced by cyclization of SH4-UD A27C A59C and E22C T72C
con-structs. Cysteine positions are indicated with blue lines. The red line represents a significance threshold defined in Methods and Materials. . . 106 2.37 CSP induced by addition of 1:1 SH3 to cyclized SH4-UD C27-C59 and
C22-C72 constructs. Cysteine positions are indicated with blue lines. The red line represents a significance threshold defined in Methods and Materials. 106 2.38 CSP of USH3 H25A and H47A vs USH3 WT. H#A substitutions are
in-dicated with blue lines. The red line represents a significance threshold defined in Methods and Materials. . . 108 2.39 SH3 cartoon displaying the loop mutations . . . 109 2.40 CSP of USH3 loop mutants vs USH3 WT. Mutations are indicated with
blue lines. The red line represents a significance threshold defined in Meth-ods and Materials. Notice that the CSP scale for the IDRs is half of that for the SH3 residues. . . 110 2.41 Coulombic potential of the SH3 domain over PDB:4HXJ. Calculated using
the Coulombic surface coloring routine included in Chimera 1.11 (Pettersen et al. 2004). . . 113 2.42 Das-Pappu diagram obtained using the CIDER software (Holehouse et al.
2017). The black X denotes the position of c-Src SH4-UD region. . . 114 2.43 Interface between the SH3 (red) and SH1 (blue) domains with the
SH2-SH1 linker (green) in A) closed c-Src (PDB:2SRC), and B) open c-Src (PDB:1Y57). H-bonds are highlighted in orange. . . 117 2.44 USH3 A59C PRE as shown in 2.19 plotted over the SH3 domain in c-Src
structure PDB:2SRC. . . 118 2.45 RDCs (top) and CSP (bottom) of SH4-UD pS17 (green line) vs the
unmod-ified form (blue line). Adapted with permission from Pérez et al. (2009). . . . 120 2.46 1
H
−
15N
SOFAST HMQC spectra of reduced (diamagnetic) SH4-UDA27C tagged with MTSL before (purple) and after (green) in vitro phos-phorylation of S17. . . 121
2.47
∆
PRE of SH4-UD A27C pS17 (orange) and the unmodified reference (blue). The vertical blue line indicates the position of S17. Phenylalanines and histidines positions are marked with vertical lines and text. Prolines are also marked, with a grey area delimiting positions±1
around them. The 14RRR16 motif in the SH4 domain is highlighted in yellow. . . . . . 1212.48 Co-evolutionary couplings within c-Src USH3 displayed in gray scale . . 124 2.49 Sequence Human Yes USH3 (IDR on top, SH3 domain at the bottom),
with the corresponding secondary structure elements. . . 125 2.50 PRE profile of Yes USH3 with a MTSL paramagnetic tag at native C42. 127 2.51
∆
PRE profile of Yes USH3 with a MTSL paramagnetic tag at C42. . . . 128 2.52 PRE profile of Yes USH3 C42-MTSL mapped over Yes SH3 crystalstruc-ture PDB:2HDA. Notice that the PPII binding area is now facing the reader. . . 128 2.53 Comparison of Yes (blue) and c-Src (orange) SH3 domains (PDBs:2HDA;4HXJ)
. . . 129 2.54 Structure of the 5-doxyl stearic acid spin probe. Notice the nitroxide
radi-cal attached to the fatty acid chain. . . 134 2.55 PRE profile of the myrUSH3 AAA construct using 5-DSA doped
param-agnetic vesicles at 298 K. . . 135 2.56 Polarization vs temperature curves at
B
0 = 14 T for electron (green line)and1H (black line). The practical DNP polarization gain for1H is indicated
with a black arrow. Courtesy of Bridge12 Technologies, Inc. . . 138 2.57 DNP MAS solid state NMR instrument scheme. Reproduced with
permis-sion from Rosay et al. (2016) . . . 139 2.58 Structures of TOTAPOL and AMUPol biradicals . . . 139 2.59 SDS-PAGE gel from myrUSH3 WT purification. PW: Pellet wash with
Triton before affinity purification; FT: Flow-through from Ni-NTA affinity cartidge; W1: Wash with 10 mM imidazole; W2: Wash with 200 mM im-idazole; E: Elution with 400 mM imidazole and 0.05 % Triton. Notice the degradation in W2. Non-degraded protein loss in W2 was latter reduced using 100 mM imidazole. See Methods and materials for further details on buffer composition. . . 143 2.60 Structures of DMPC and DMPG. Notice that DMPC is a zwitterion,
whereas DMPG is negatively charged. . . 144 2.61 DLS stability test for the DMPC/DMPG LUV stock and pellet. . . 144 2.62 LUV-bound myrUSH3 AAA sample preparation scheme. . . 145 2.63 1D hC CP (left) and INEPT (right) MAS ssNMR spectra without DNP
2.64 DLS stability test upon pellet deep freezing. . . 150 2.65 DNP enhancement (
ϵ
) estimation at different temperatures on 13C labeledmyrUSH3 AAA bound to lipid LUVs. . . 151 2.66 50 and 100 ms mixing time hCC DARR of myrUSH3 AAA bound to lipid
LUVs at 100 K. . . 152 2.67 50 ms mixing time hCC DARR of myrUSH3 AAA bound to lipid LUVs at
100 K and 150K. The methyl region with new signals is highlighted in red. 153 2.68 50 and 10 ms mixing time hCC DARR of myrUSH3 AAA bound to lipid
LUVs at 170 K. . . 154 2.69 PLUQin automated assignment for a manually selected set of peaks of
the hCC DARR spectrum with 10 ms mixing time shown in figure 2.68 (background). . . 155 2.70 10 ms mixing time hNCACX of myrUSH3 AAA bound to lipid LUVs at
100 K. . . 155 3.1 Comparison of the specificity in long range IDR:SH3 contacts as detected
by PRE (see figure 2.20) vs the EOM-fitted IDR ensemble representing SAXS experimental data (see figure 2.16) . . . 159 5.1 Sequence conservation logo for the human Src Family Kinases, including
Fgr (part 1). Generated with WebLogo 3.6.0 (Crooks 2004). . . 179 5.2 Sequence conservation logo for the human Src Family Kinases, including
Fgr (part 2). Generated with WebLogo 3.6.0 (Crooks 2004). . . 180 5.3 Sequence conservation logo for the human Src Family Kinases, including
Fgr (part 3). Generated with WebLogo 3.6.0 (Crooks 2004). . . 181 5.4 CSP mapping for USH3 WT (red dot), K5A S6A (triangle),
∆10
(square)and
∆20
(pentagon) (part 1). The origin positions correspond to the respective isolated SH3 signals. Relative scale between∆δ
1H
(x axes)and
∆δ
15N
(y axes) is indicated as a blue cross representing 0.01 ppm. . 1825.5 CSP mapping for USH3 WT (red dot), K5A S6A (triangle),
∆10
(square) and∆20
(pentagon) (part 2). The origin positions correspond to the respective isolated SH3 signals. Relative scale between∆δ
1H
(x axes)and
∆δ
15N
(y axes) is indicated as a blue cross representing 0.01 ppm. . 1835.6 CSP mapping for USH3 WT (red dot), K5A S6A (triangle),
∆10
(square) and∆20
(pentagon) (part 3). The origin positions correspond to the respective isolated SH3 signals. Relative scale between∆δ
1H
(x axes)5.7 CSP mapping for USH3 WT (red dot), K5A S6A (triangle),
∆10
(square) and∆20
(pentagon) (part 4). The origin positions correspond to the respective isolated SH3 signals. Relative scale between∆δ
1H
(x axes)and
∆δ
15N
(y axes) is indicated as a blue cross representing 0.01 ppm. . 1855.8 PRE and
∆
PRE profiles and heat map for SH4-UD A2C. . . 186 5.9 PRE and∆
PRE profiles and heat map for SH4-UD A27C. . . 186 5.10 PRE and∆
PRE profiles and heat map for SH4-UD A59C. . . 187 5.11 PRE profiles and heat map for USH3 A27C∆10
and USH3 A27C∆20
. 188 5.12 PRE and∆
PRE profiles and heat map for USH3 A27C∆10
IDR. . . . 189 5.13 PRE and∆
PRE profiles and heat map for USH3 A27C∆20
IDR. . . . 189 5.14 PRE and∆
PRE profiles and heat map for SH4-UD A27C F32A. . . 190 5.15 PRE and∆
PRE profiles and heat map for SH4-UD A27C F52A. . . 190 5.16 PRE and∆
PRE profiles and heat map for SH4-UD A27C F64A. . . 191 5.17 PRE and∆
PRE profiles and heat map for SH4-UD A27C F67A. . . 191 5.18 Comparison of H25, H47, and H125 between 1H
−
15N
SOFAST HMQCspectra of two USH3 WT samples in nearly identical experimental condi-tions (temperature, buffer, concentration, etc., see Methods and Materials for details). . . 192 5.19 PRE and
∆
PRE profiles and heat map for SH4-UD A27C pS17. . . 193List of Tables
1.1 Selected list of available methods for structural ensemble determination as of 2017. Adapted with permission from Bonomi et al. (2017). . . 43 2.1 Integrated CSP values for different regions of the SH3 domain for USH3
WT and the respective relative changes (%) for the different SH4 variants. Central: 95 - 143; RT loop: 94 - 107; nSrc loop: 111 - 120. . . 66 2.2 myrUSH3 AAA construct amino acid composition, full length (residues 2
-156) and disaggregated for the IDR (2 - 85) and the SH3 domain (86 - -156). 147 4.1 Table of constructs containing cloning details and termini modifications
respect the wild type sequences. . . 167 4.2 Plasmids used and their respective antibiotic resistances used in all culture
Abbreviations
ATP Adenosine triphosphate BSA Bovine Serum Albumine CaM Calmodulin
CE Cross Effect CP Cross Polarization CS Chemical Shift
CSP Chemical Shift Perturbation
DARR Dipolar Assisted Rotational Resonance DLS Dynamic Light Scattering
DMPC 1,2-Dimyristoyl-sn-glycero-3-phosphorylcholine DMPG 1,2-Dimyristoyl-sn-glycero-3-phosphorylglycerol DNP Dynamic Nuclear Polarization
DSA Doxyl Stearic Acid
DSS 4,4-dimethyl-4-silapentane-1-sulphonic acid EOM Ensemble Optimization Method
GST Glutathione S-Transferase
HEPES 4-(2-hydroxyethyl)-1-piperazineethanesulphonic acid HMM Hidden Markov Model
HMQC Heteronuclear Multiple Quantum Coherence HSQC Heteronuclear Single Quantum Coherence IDP Intrinsically Disordered Protein
ITC Isothermal Calorimetry
INEPT Insensitive Nuclei Enhanced by Polarization Transfer IDR Intrinsically Disordered Region
LC-MS Coupled Liquid Cromatography and Mass Spectrometry LUV Large Unilamellar Vesicle
MTSL (1-oxyl-2,2,5,5-tetramethyl-2,5-dihydro-1H-pyrrol-3-yl)methyl methanesulfonothioate
MW Micro Wave
NMR Nuclear Magnetic Resonance NMT N-Myristoyl Transferase NOE Nuclear Overhauser Effect NUS Non Uniform Sampling
MAS solid state Nuclear Magnetic Resonance nRTK non-Receptor Tyrosine Kinase
PIC Protease Inhibitor Cocktail PKA Protein Kinase A
PMSF Phenylmethylsulphonylfluoride PPII PolyProline type II helix
PRE Paramagnetic Relaxation Enhancement RDC Residual Dipolar Coupling
pRDC paramagnetic Residual Dipolar Coupling RSV Rous Sarcoma Virus
RTK Receptor Tyrosine Kinase SAXS Small Angle X-ray Scattering SD Standard Deviation
SDS-PAGE Sodium dodecyl sulphate polyacrylamide Gel Electrophoresis SFK Src Family Kinases
SH Src Homology domains
SH4-UD Construct formed by SH4 and Unique Domains SPR Surface Plasmon Resonance
TEV Tobacco Etch Virus
TRIS-HCl tris(hydroxymethyl)aminomethane hydrochloride ULBR Unique Lipid Binding Region
Chapter 1
Introduction
In this section I first introduce the subject of this thesis, the human tyrosine kinase c-Src and the related Src Family Kinases (SFK). I also briefly review the role of c-Src in cancer and its relevance as a drug target. Then, I present the topic of Intrinsically Dis-ordered Proteins (IDPs) with a special emphasis on IDP protein binding and protein fuzzy complexes, relevant for the study of the N-terminal region of c-Src which includes ordered and disordered regions. Finally, I discuss the biophysical characterization of IDPs, focusing on the Nuclear Magnetic Resonance (NMR) techniques used in this thesis.
1.1
A historical overview of Src
Nowadays Src is a scientific hot topic, mostly because of its implication in tumoral diseases, with ~4 peer-reviewed research papers steadily published everyday during the last 15 years1. However, Src history goes a century back in time, well before the advent of
modern structural biology (figure 1.1).
As extensively reviewed in Martin (2001) and Martin (2004), the first findings date from the 1910s, when Peyton Rous observed an avian spindle-cell sarcoma that could be trans-planted and induce the disease to healthy chickens (Rous 1910). The finding of cell filtrates able to provoke tumors (Rous 1911) led to the identification of the Rous Sarcoma
Figure 1.1: Key events in Src historical timeline until 2000. Reproduced with permission from Martin (2001).
Virus (RSV), which granted him the Nobel prize in Medicine in 1966 for the discovery of tumor-inducing viruses.
During the 1950 - 1960s, extensive research was done on a large number of viral strains. Special interest was raised by the capacity of RSV and other related RNA retroviruses to induce cell transformation in several types of mammalian cells, a fact that defied the established knowledge about oncogenic viruses at the time. These efforts led to the identification of the key transforming factor in the 1970s: the viral Src (v-Src) gene and its protein product (Wang et al. 1976; Brugge et al. 1978). Also in the late 1970s a cellular analogue was discovered: c-Src (Stehelin, Guntaka, et al. 1976; Stehelin, Varmus, et al. 1976). Most importantly, evidences showed that the Src gene is not viral but cellular in origin, and is widely spread among vertebrates. These findings led to the second Nobel prize derived from Src research, awarded to J. Michael Bishop and Harold E. Varmus in 1989. Decades of research in RSV and other oncogenic viruses thus permeated to the field of cancer biology. The term oncogene was first coined by Huebner & Todaro (1969) referring to the endogenous viral information carried by cells that, upon activation, could cause cancer. The name proto-oncogene was then defined to emphasize that the cellular precursors of the oncogenes lack transforming capacity unless mutated or over-expressed. The ground-breaking discovery of this first proto-oncogene and its role in cancer sparked a whole research area (Bister 2015). By the early 1980s, Src was characterized as a tyrosine kinase (Hunter & Sefton 1980), revealing a new enzyme class2 later found to be key in
cell signaling. It was soon observed that the viral forms of Src had a much higher activity than c-Src, consistently with a lower transforming capacity of the latter and a number of variations in sequence. Therefore, during the following three decades, much endeavor was put on c-Src domain architecture, modulation, and function. I discuss those aspects in more detail later in this section.
2At the time, only serine and threonine kinases were known. In fact, Src was initially thought to
Significant contributions to the field of structural biology stem from Src research. Novel domains were recognized in Src and other related proteins, and were thus termed Src Homology domains (SH#). Besides the catalytic SH1 domain, two protein-binding domains related to Src activity were described, namely SH2 and SH3 (Sadowski et al. 1986; Mayer et al. 1988). These common functional elements are widespread among signaling proteins, which led to the concept of modular protein interaction domains that is now in the basis of cell signaling (Sudol 1998; Pawson 2004).
The N-terminal region remained obscure until recent years due to its intrinsically dis-ordered nature. The concept of intrinsic disorder (Dunker et al. 2001) will be further detailed in following sections, but in simple terms it refers to proteins (or regions) that do not adopt a single, stable conformation, but remain highly dynamic. That conforma-tional heterogeneity of intrinsically disordered regions (IDRs) precludes crystallization, and therefore they are excluded from X-ray studies. It was found that the very N-terminal ~20 residues were important for c-Src to bind lipids via clusters of basic residues and
co-translational myristoylation, so determining cellular location and activity (Patwardhan & Resh 2010). Thus the region was termed SH4 domain (Silverman 1992; Buser et al. 1994). More details on c-Src structure, regulation, lipid binding and distribution are given in the following sections.
The rest of the intrinsically disordered region was observed to be poorly conserved among Src-related proteins (see section 1.4 below) both regarding sequence and length, and was therefore named Unique domain. The birth and explosive growth of the study of intrin-sically disordered proteins from the beginning of the 2000s turned the focus towards these N-terminal regions. Although the Unique domain was initially considered a simple tether between the folded core and the lipid anchoring SH4 domain, functional elements have been described during the last years by our group and others. Gingrich et al. (2004) found that the Unique domain of c-Src was capable to establish protein-protein interactions by binding the NMDA receptor. Later, our group confirmed this capacity by describing the interaction between the Unique domain and calcium-loaded calmodulin (Pérez et al. 2013). In the same work, it was also found that the Unique domain could also bind to membranes through a specific region, which was termed Unique Lipid Binding Region (ULBR). Besides that, both the SH4 and Unique domains contain multiple phosphory-lation sites (Amata et al. 2013; Amata et al. 2014). While some have been functionally characterized, such as S17, which inhibits SH4 lipid binding upon phosphorylation, most of them remain undefined.
Finally, after more than 100 years of accumulated knowledge since the discovery of the RSV, proto-oncogenes (and c-Src among them) are nowadays key targets for the treatment
of several human tumors, as reviewed in the following sub-section.
1.2
c-Src function, cell signaling, and cancer
Protein phosphorylation is the most widespread post-translational modification. The transfer of a phosphate group from an ATP molecule to the hydroxyl group of serine, threonine or tyrosine side chains is catalyzed by kinase enzymes, while the reverse reaction is carried out by phosphatases.
Figure 1.2: Phosphorylation/dephosphorylation reactions.
This modest modification can however prompt important structural changes in the sub-strate, via interactions of the new phosphate dianion with positively charged groups or H-bond formation. The typical effect on substrate activity is on/off switching upon phosphorylation or dephosphorylation. Reaction specificity and reversibility allows for selective, time dependent response to external stimuli. Further control on kinase and phosphatase expression and activity provides means for tight control and emergence of complex patterns and networks.
Thus unsurprisingly, one of the major biological functions of phosphorylation is cell sig-naling and cycle control. Sigsig-naling pathways have evolved along with organism com-plexity and are central regulatory elements for correct and coordinated cell behavior, specially in superior organisms. Aberrant regulation is most critical in neoplasia, defined by deregulated cell proliferation and, if malignant, capacity to invade and survive (Blume-Jensen & Hunter 2001). In those cases, perturbations in the delicate balance between cell division, growth and apoptosis can lead to cancer.
Introduced by Manning (2002), the term kinome corresponds to the protein kinase com-plement of the human genome. It comprises more than 500 kinases accounting for ~2 % of the genome. The most common phosphorylations occur in serines by far (86.4 %), followed by threonines (11.8 %) and, last but not least, tyrosines (1.8 %) (Johnson 2009). It is remarkable that the tyrosine kinase family underwent an explosive growth with the
appearance of Metazoa, and are thus associated with complex organisms (Manning et al. 2002).
Figure 1.3: Human kinome map courtesy of Cell Signaling Technology, Inc. c-Src is indicated as a red circle. AGC Containing PKA, PKG, PKC families; CAMK Calcium/calmodulin-dependent protein kinase;
CK1 Casein kinase 1; CMGC Containing CDK, MAPK, GSK3, CLK families; STE Homologs of yeast Sterile
7, Sterile 11, Sterile 20 kinases; TK Tyrosine kinase; TKL Tyrosine kinase–like.
Albeit the >90 tyrosine kinases encoded in the human genome are a minority of the total kinases and generate a small fraction of the total phosphorylated substrates in cells, they are specially involved in signal transduction (Paul 2004). More specifically, c-Src and the closely related Src Family Kinases (later reviewed in this section) occupy a critical place in the signaling network and control important cellular functions such as proliferation, differentiation, survival or motility (Thomas & Brugge 1997). Thus, abnormal response to stimuli induces downstream effects in pathways that prevent uncontrolled growth and receive apoptotic signals.
Being the first proto-oncogene discovered and an ubiquitously expressed signaling hub, human c-Src correlation with cancer was soon sought. As reviewed by Irby & Yeatman (2000), since the early 1980s and through the 1990s numerous papers highlighted c-Src
en-hanced activity in a range of tumoral pathologies in breast, colon, lung, prostate, bladder, brain, and pancreas among others. Surprisingly, it turned out that activating mutations are seldom found, the first one reported only by 1999 (Yeatman et al. 1999). Instead, high c-Src protein levels and, most importantly, up-regulated activity has been consis-tently linked to tumor initiation and progression, but specially the latter. Src-dependent mechanisms have also been reported for latent bone metastasis in breast cancer (X. H.-F. Zhang et al. 2009).
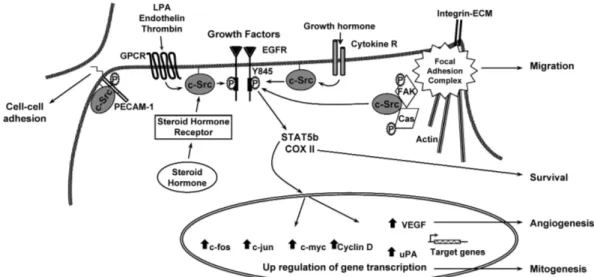
Furthermore, not only c-Src but many of its substrates are also linked to tumoral processes. In most cases, it is in collaboration with other cellular effectors that c-Src oncogenic potential develops. The most important cooperating partners associated to Src are EGF receptors, FAK tyrosine kinase and sex steroid hormone receptors (Ishizawar & Parsons 2004).
Figure 1.4: Oncogenic processes regulated by c-Src. Reproduced with permission from Ishizawar & Parsons (2004).
One of the most studied disease models is colorectal cancer. Upregulated c-Src activity has been reported to happen in the very first stages of the disease, to increase with progression and is associated with poor prognosis (Cartwright & Eckhart 1990; Anon 1993). Because of its importance and occurrence, this thesis has been developed within the project “c-Src Unique domain signaling in colorectal cancer”, funded by the Fundació Marató TV3.
Given their close connection with cancer, kinases have become important therapeutic targets during the last 20 years (J. Zhang et al. 2009), and constitute a good example
of modern targeted molecular pharmacology. One of the first successful tyrosine kinase inhibitors was Imatinib, developed to target the Bcr-Abl oncogenic kinase in chronic myelogenous leukemia, which supposed a paramount hallmark (Capdeville et al. 2002). As of 2016, the FDA has approved the use of 28 kinase inhibitors, most of them targeting tyrosine kinases associated to tumoral diseases (Wu et al. 2016). The vast majority of them are ATP competitors that bind the nucleotide binding site of the catalytic domain.
Figure 1.5: Kinase inhibitors approved as of 2016 plotted over the human kinome map shown in figure 1.4 with the names of targeted enzymes. Reproduced with permission from Wu et al. (2016).
ATP mimicking drugs have however some important drawbacks, mostly derived from their selectivity for a very common motif in Nature. The first is one is limited selectivity in some cases, which may rise unexpected side effects by interfering with the activity of other kinases related to the primary target. Signal pathway rewiring only but hinders the prediction of unexpected toxicities derived from this phenomenon. In addition, besides the >500 human tyrosine kinases, some other ~2 000 proteins contain nucleotide binding sites, which adds more potential off-targeting problems. Finally, there is the problem of acquired drug resistance, mostly by mutations in the catalytic domain. This complication typically arises due to the strong selective pressure induced by the cytotoxic effects of the
treatment.
Due to these issues, alternative strategies are being developed, such as exploiting the synergistic effect of drug combinations (several inhibitors, or inhibitors and other drugs such as rapamycin) or allosteric targeting. The latter is an interesting option with some examples of success, such as GNF-2, a drug that binds the myristate binding site in Bcr-Abl (Fallacara et al. 2014). Thanks to our increasing understanding of the structural characteristics of kinases, their mechanisms and interactions, it is expected that this field will provide new efficient drugs in the future (J. Zhang et al. 2009; Cowan-Jacob et al. 2014).
In the particular case of Src, success has been limited due to these difficulties despite the strong body of knowledge accumulated over the years. According to the Open Tar-get database (Koscielny et al. 2017), three Src inhibitors have reached phase IV clinical research to date: Dasatinib, Bosutinib, and Vandetanib. Another four compounds, Sara-catinib, Ilorasertib, KX2-391, and XL-228, are already in phase III. All of them are ATP competitors except KX2-391, which binds to the peptide binding region of the catalytic domain.
The close structural resemblance between the c-Src and other tyrosine kinases such as the Src Family Kinases (SKFs, see section 1.4) makes drug specificity a specially relevant matter if one desires to design precise therapeutic inhibition strategies. Thus, given the importance of the target, Src drug development is an open and active field with an special emphasis on mechanisms other than ATP agonism, such as targeting allosteric networks, to improve efficacy and reduce off-target toxicity (Dar & Shokat 2011).
1.3
c-Src structure, cellular location and regulation
As introduced in the previous section, the discovery of the Src Homology domains led to the concept of modular protein interaction domains: functional building blocks that are pervasively found in Nature in different arrangements. Although there may be a certain degree of sequence variability which determines particular details, e.g. specificity or affinity, the fold and basic function are highly conserved.
There are 1 306 tyrosine kinases deposited in the Pfam database (Finn et al. 2016) sharing the same domain arrangement as c-Src: A variable disordered N-terminal region, followed by a cassette formed by SH3 and SH2 protein-binding domains and a catalytic SH1 domain connected by relatively short flexible coils, and finally a short regulatory C-terminal tail.
Figure 1.6: c-Src domain architecture and sequence.
The N-terminal intrinsically disordered region makes a difference between two main groups of tyrosine kinases: receptor (RTKs) and non-receptor (nRTKs). Both types associate to the cellular membrane for signal transduction. However, while RTKs have trans-membrane and extracellular receptor domains coupled to the intracellular kinase domain, nRTKs are exclusively intracellular. The specific membrane anchoring mechanism is a key determinant for nRTK activation, transport, cellular location and, ultimately, activ-ity (Resh 2006; Patwardhan & Resh 2010). In the case of nRTKs sharing c-Src domain architecture, the N-terminal intrinsically disordered region is responsible for binding the inner face of the membrane.
1.3.1
The SH4 domain
As introduced in the former section, the membrane anchoring mechanism of c-Src involves the initial 20 amino acids, which form a disordered but conserved region termed SH4 domain. SH4 lipid binding is controlled by a cooperative two-signal mechanism that involves protein lipidation and electrostatic interactions (Resh 1999).
Myristoylation is a co-translational modification that takes place directly in the protein nascent chain at the ribosome by the N-myristoyl Transferase enzyme (NMT). NMT recognizes an MGxxxZ consensus sequence, where x is any amino acid and Z is S or T, and cleaves the initial methionine to further create an amide bond between a myristate group and the now N-terminal glycine.
c-Src remains in the perinuclear region until it is activated upon phosphorylation of its C-terminal regulatory tail (see below). Then, it is transported to the cellular membrane. About 10 of the 14 myristate moiety carbons penetrate in the membrane driven by hy-drophobicity. However, only-myristate lipid binding is weak, with a
K
d around 10-4
insufficient to provide a stable anchor.
The second c-Src membrane-binding signal is a cluster of basic residues of the SH4 do-main, organized in two sets: 5KSKPK8 and 14RRR16. The positively charged residues
electrostatically interact with the inner membrane leaflet, enriched in acidic phospho-lipids (Buser et al. 1994; Sigal et al. 1994). The additional binding sums cooperatively to that of myristate, leading to a 3 000-fold increase in affinity. Remarkably, the SH4 domain is depleted of hydrophobic residues so, unlike for the myristoyl moiety, there is no insertion in the membrane whatsoever. The anchor is therefore formed by a stitch and
a plaster that efficiently fasten the rest of the protein to the surface.
Figure 1.7: Cellular membrane binding mechanisms of receptor (left) non-receptor (right) tyrosine kinases. A) Only myristoylation (labile); B) myristoylation + electrostatics; C) myristoylation + palmitoylation.
1.3.2
The Unique domain
The next 65 residues following the SH4 domain form a lowly conserved region both in terms of length and sequence present in all c-Src related SFK members. In consequence, it has been termed the Unique domain. All SFK Unique domains are predicted to be intrinsically disordered regions (Santos & Siltberg-Liberles 2016). In the case of c-Src, our group was the first to provide experimental evidence of this property by NMR and Small Angle X-ray Scattering (SAXS) studies (Pérez et al. 2009). It was also shown that, although disordered, the Unique domain displays a certain degree of pre-organization - i.e. it is not a random coil (see a more detailed description in sub-section 2.1.1).
functional relevance of c-Src Unique domain remained obscure until recent years when, besides other protein-protein interactions and phosphorylation events described above, an additional Unique domain lipid binding region was described (Pérez et al. 2013). Unlike the SH4 domain, this membrane binding motif does contain hydrophobic residues like L62, F64 and F67, but neither penetrates in the lipid layer.
1.3.3 The SH3 domain
Adjacent to the Unique domain is the SH3 domain, the first folded domain forming the core cassette shared by all SFKs (Yu et al. 1992). It is a small folded domain, only 65 amino acid long arranged in a
β
sandwich made of five antiparallel strands. Between strandsβ1
-β2
, andβ2
-β3
, are two prominent and flexible loops, named RT and nSrc, respectively. The latter has an isoform present in neural tissue in which T117 changes for TRKVDVR. A smaller loop termed distal extends betweenβ3
-β4
, and finally a short 310helix kink is located between strands 4 and 5. Theβ
sheet formed by strands 2, 3 and4 forms an hydrophobic surface that is responsible for the main SH3 function: recognition of polyproline II helices (PPII). The RT and nSrc loops lay at one of the edges, and participate in additional, weaker interactions with the ligand. SH3-PPII binding serves a dual function: it binds the enzyme ligand or other substrates related with localization, and also stabilizes an inactive conformation via intramolecular interactions (see below). Two additional roles have been recently discovered by our group: lipid binding and in-teraction with the intrinsically disordered SH4 and Unique domains (Pérez et al. 2013). The RT and nSrc loops show weak interaction with lipids as shown by NMR experiments but, most importantly, they are also sensitive to the presence of the N-terminal IDR. These results led to further studies in which it was demonstrated that the SH3 domain acts as a scaffold for the IDR via multiple weak contacts (Maffei et al. 2015).
1.3.4
The SH2 domain
Towards the C-terminus, it follows the SH2 domain, a 100 amino acid long phosphoty-rosine (pTyr) binding module (Filippakopoulos et al. 2009). While pTyr constitutes the main recognition feature, adjacent residues -2 to +4 provide further affinity and selectiv-ity. The tertiary structure is formed by a three stranded
β
sheet and twoα
helices, one packed against each face. The pTyr binding site is located at one border of the sheet, in the cleft formed by the extremes of the helices. As the SH3 domain, SH2 also fulfills abi-nary role, one as an auto-regulatory switch (see below), and another recruiting substrates. A short but functionally important 22 amino acid PPII helix segment links the SH2 and SH1 catalytic domain, whose role I comment below regarding c-Src regulation.
1.3.5 The SH1 (catalytic) domain
The SH1 domain is 250 amino acids long, and is organized in two parts: a small N-terminal lobe, and a large C-N-terminal lobe, connected by a flexible hinge. The N-lobe is formed by a five-stranded
β
sheet and an importantα
helix (α
C) betweenβ3
andβ4
, while the larger C-lobe consists on five tightly packedα
helices. The key ATP binding site sits in the cleft between lobes (Xu et al. 1997), where two conserved hydrophobic patches, one from each lobe, form the catalytic spine that holds the adenosine group. An additional hydrophobic spine further stabilizes the catalytic site (Foda et al. 2015). Finally, at the C-terminal end of the SH1 domain is the regulatory tail (12 amino acids long). This short segment contains a residue that is crucial for c-Src regulation: Y530. Moreover, the lack of this residue in the constitutionally active v-Src is the main reason of its transforming capacity (Tanaka & Fujita 1986). The work of Matsuda et al. (1990) together previous studies observed that c-Src activity strongly depended both on the SH2 and SH3 domains, and phosphorylation of Y530, suggesting that the folded cassette had a built-in lock. The subsequent X-ray structures of c-Src active and inactive conformations [Xu et al. (1997); Xu et al. (1999); Cowan-Jacob et al. (2005); figure 1.8] provided high detail on the mechanism, which involves large scale domain rearrangement (Huse & Kuriyan 2002). Harrison (2003) eloquently described the main components of c-Src’s auto-inhibitory mechanism as a latch,a clamp and a switch, which I pass to describe in the next sub-section.1.3.6
The auto-inhibitory mechanism of c-Src
Y530 is mostly found phosphorylated in cells (Bjorge et al. 2000), typically due to the action of the CSK or CHK kinases3. This makes the SH2 domain target the C-terminal
regulatory tail and pack tightly against the C-lobe of the SH1 domain, at the opposite side of the catalytic site. As a consequence, conformational rearrangement on the
α
C helix of the lobe blocks the ATP binding pocket thus abrogating activity, hence the denomination: the latch.3The reference provided comprehends a review on the diverse kinases and phosphatases responsible
Figure 1.8: c-Src X-ray structures of the closed (PDB:1SRC) and open (PDB:1Y57) states. Notice that the IDR is missing in both. The domain color legend is the same as in figure 1.6.
The large rearrangement also facilitates the interaction between the SH3 domain and the SH2-SH1. Although it does not contain the exact SH3 recognition motif (K/R)xxPxxP (where x is any amino acid), the linker adopts a PPII helix conformation which binds to the SH3 hydrophobic binding patch. Additionally, the linker is in contact with the N-lobe of the SH1 domain, allowing further interactions between the SH3 domain and the catalytic domain. Therefore, although the SH3-linker interaction is not completely specific, is is effectively sandwiched between the SH3 and SH1 domains. The whole set of contacts further packs the folded cassette in a locked conformation, and destabilizing mutations in this triple interface lead to activation (Gonfloni et al. 1997). The tight packing of the SH2 and SH3 domains against the catalytic SH1 is therefore the clamp referred by Harrison (2003) (see figure 1.9).
Figure 1.9: c-Src activation mechanism. Reproduced with permission from Harrison (2003).
When pY530 is dephosphorylated by the action of phosphatases, the latch and clamp are released: the SH2 and SH3 domains detach from the SH1 domain and swing outwards
(see figure 1.9), while the catalytic site rearranges into an open, active conformation. The latter consist mainly in a displacement of the
α
C helix and breakage of the catalytic spine. Still, subsequent phosphorylation of Y419 in the so-called activation loop of the C-lobe en-hances the enzymatic activity by further stabilizing the ATP binding site. This additional activation step is the switch.The role of inter-domain dynamics is of paramount importance regarding c-Src activ-ity. Using SAXS to study a constitutionally active c-Src mutant (Y520F) in solution, Bernadó et al. (2008) demonstrated that, even when the latch is fully released the SH2-SH3 clamp remains at an equilibrium shifted towards the closed form (85 %). This fact further evidences the need for a finely tuned control mechanism in c-Src, since such a small conformational population have dramatic biological effects. Indeed, the multi-domain cas-sette comprising the SH3, SH2 and SH1 domains exquisitely depends on relative domain traslation and orientation and several intramolecular allosteric mechanisms (Fajer et al. 2017), all components being tightly interdependent (Gonfloni et al. 2000). The network of allosteric connections that serves as a signal relay between the regulatory domains and the catalytic site of c-Src is described and experimentally tested in Foda et al. (2015). The reader may have noticed that the IDR is not mentioned in this canonical auto-inhibitory mechanism. The hinge between the SH3 and Unique domains lies at the op-posite side of the PxxP binding site, so it was classically assumed that the disordered N-terminal region was an extravagant leash to anchor the cassette to the membrane. However, the results obtained by our group in recent years (Pérez et al. 2013; Maffei et al. 2015) showed that the IDR including the SH4 and Unique domains interact with functionally important zones of the SH3 domain. These observations therefore raise the question of whether the IDR is somehow functionally connected with the cassette.
1.4
The Src Family Kinases (SFKs)
The Src Family Kinases is a group of closely related tyrosine kinases comprising eight members in humans: Src, Yes, Fyn, and Fgr as the SrcA subfamily; and Blk, Hck, Lck, and Lyn as the SrcB subfamily (Thomas & Brugge 1997). The more distantly related Frk is considered by some authors as a separate subgroup on its own. As c-Src, all of them are involved in cell signaling pathways, but they differ in expression, cellular location and specificity. For example, c-Src, Yes and Fyn are ubiquitously expressed (although particularly high levels are specific to some cell types), whereas Blk, Fgr, Hck,