A treelet transform analysis to relate nutrient patterns to the risk of
hormonal receptor-de
fined breast cancer in the European
Prospective Investigation into Cancer and Nutrition (EPIC)
Nada Assi
1,2, Aurelie Moskal
1, Nadia Slimani
1, Vivian Viallon
3,4,5, Veronique Chajes
1,
Heinz Freisling
1, Stefano Monni
6, Sven Knueppel
7, Jana Förster
7, Elisabete Weiderpass
8,9,10,11,
Leila Lujan-Barroso
12, Pilar Amiano
13,14, Eva Ardanaz
13,15, Esther Molina-Montes
13,16,
Diego Salmerón
13,17,18, José Ramón Quirós
19, Anja Olsen
20, Anne Tjønneland
20,
Christina C Dahm
21, Kim Overvad
21, Laure Dossus
22,23,24, Agnès Fournier
22,23,24,
Laura Baglietto
25,26, Renee Turzanski Fortner
6, Rudolf Kaaks
6, Antonia Trichopoulou
27,28,
Christina Bamia
29, Philippos Orfanos
29, Maria Santucci De Magistris
30, Giovanna Masala
31,
Claudia Agnoli
32, Fulvio Ricceri
33, Rosario Tumino
34, H Bas Bueno de Mesquita
35,36,37,
Marije F Bakker
38, Petra HM Peeters
38, Guri Skeie
8, Tonje Braaten
8, Anna Winkvist
39,
Ingegerd Johansson
40, Kay-Tee Khaw
41, Nicholas J Wareham
42, Tim Key
43, Ruth Travis
43,
Julie A Schmidt
43, Melissa A Merritt
37, Elio Riboli
37, Isabelle Romieu
1and Pietro Ferrari
1,*
1International Agency for Research on Cancer, 150 Cours Albert Thomas, 69372 Lyon Cedex 08, France:2UniversitéClaude-Bernard Lyon 1, Villeurbanne, France:3Université de Lyon, Lyon, France:4Université Lyon 1, UMRESTTE, Lyon,
France:5IFSTTAR, UMRESTTE, Bron, France:6Division of Cancer Epidemiology, German Cancer Research Center (DKFZ), Heidelberg, Germany:7Department of Epidemiology, German Institute of Human Nutrition
Potsdam-Rehbruecke, Nuthetal, Germany:8Department of Community Medicine, Faculty of Health Sciences, University of Tromsø,
The Arctic University of Norway, Tromsø, Norway:9Department of Medical Epidemiology and Biostatistics, Karolinska
Institutet, Stockholm, Sweden:10Cancer Registry of Norway, Oslo, Norway:11Department of Genetic Epidemiology,
Folkhälsan Research Center, Helsinki, Finland:12Unit of Nutrition, Environment and Cancer, Cancer Epidemiology Research Program, Catalan Institute of Oncology (ICO), Bellvitge Biomedical Research Institute (IDIBELL), Barcelona, Spain:13CIBER de Epidemiología y Salud Pública (CIBERESP), Madrid, Spain:14Public Health Division of Gipuzkoa,
BioDonostia Research Institute, Health Department, San Sebastian, Spain:15Navarre Public Health Institute, Pamplona,
Spain:16Escuela Andaluza de Salud Pública, Instituto de Investigación Biosanitaria de Granada (Granada.ibs),
Granada, Spain:17Department of Epidemiology, Murcia Regional Health Council, Murcia, Spain:18Department of Health and Social Sciences, Universidad de Murcia, Murcia, Spain:19Public Health Directorate, Asturias, Oviedo, Spain:20Danish Cancer Society Research Center, Copenhagen, Denmark:21Section for Epidemiology, Department of
Public Health, Aarhus University, Aarhus, Denmark:22Inserm, Centre for Research in Epidemiology and Population
Health (CESP), Nutrition, Hormones and Women’s Health Team, Villejuif, France:23Université Paris Sud, UMRS, Villejuif,
France:24IGR, Villejuif, France:25Cancer Epidemiology Centre, Cancer Council of Victoria, Melbourne, Australia: 26Centre for Epidemiology and Biostatistics, School of Population and Global Health, University of Melbourne,
Melbourne, Australia:27Hellenic Health Foundation, Athens, Greece:28Bureau of Epidemiologic Research, Academy of Athens, Athens, Greece:29Department of Hygiene, Epidemiology and Medical Statistics, University of Athens Medical
School, Athens, Greece:30Azienda Ospedaliera Universitaria (AOU) Federico II, Naples, Italy:31Molecular and
Nutritional Epidemiology Unit, Cancer Research and Prevention Institute– ISPO, Florence, Italy:32Epidemiology and
Prevention Unit, Fondazione IRCCS, Istituto Nazionale dei Tumori, Milan, Italy:33Unit of Cancer Epidemiology– CERMS, Department of Medical Sciences, University of Turin and Città della Salute e della Scienza Hospital, Turin, Italy:
34Cancer Registry and Histopathology Unit,’Civile M.P. Arezzo’ Hospital, Ragusa, Italy:35Department for Determinants
of Chronic Diseases (DCD), National Institute for Public Health and the Environment (RIVM), Bilthoven, The Netherlands:
36Department of Gastroenterology and Hepatology, University Medical Centre, Utrecht, The Netherlands:37Department
of Epidemiology and Biostatistics, The School of Public Health, Imperial College London, London, UK:38Department of
Epidemiology, Julius Center for Health Sciences and Primary Care, University Medical Center Utrecht, Utrecht, The Netherlands:39Department of Internal Medicine and Clinical Nutrition, The Sahlgrenska Academy, Göteborg, Sweden: 40Department of Odontology, Umeå University, Umeå, Sweden:41Department of Public Health and Primary Care,
University of Cambridge School of Clinical Medicine, Cambridge, UK:42MRC Epidemiology Unit, University of
Cambridge School of Clinical Medicine, Cambridge, UK:43Cancer Epidemiology Unit, Nuffield Department of
Population Health, University of Oxford, Oxford, UK
Submitted 9 September 2014: Final revision received 12 January 2015: Accepted 20 January 2015: First published online 23 February 2015
Abstract
Objective: Pattern analysis has emerged as a tool to depict the role of multiple nutrients/foods in relation to health outcomes. The present study aimed at extracting nutrient patterns with respect to breast cancer (BC) aetiology.
Design: Nutrient patterns were derived with treelet transform (TT) and related to BC risk. TT was applied to twenty-three log-transformed nutrient densities from dietary questionnaires. Hazard ratios (HR) and 95 % confidence intervals computed using Cox proportional hazards models quantified the association between quintiles of nutrient pattern scores and risk of overall BC, and by hormonal receptor and menopausal status. Principal component analysis was applied for comparison.
Setting: The European Prospective Investigation into Cancer and Nutrition (EPIC). Subjects: Women (n 334 850) from the EPIC study.
Results: Thefirst TT component (TC1) highlighted a pattern rich in nutrients found in animal foods loading on cholesterol, protein, retinol, vitamins B12and D, while
the second TT component (TC2) reflected a diet rich in β-carotene, riboflavin, thiamin, vitamins C and B6,fibre, Fe, Ca, K, Mg, P and folate. While TC1 was
not associated with BC risk, TC2 was inversely associated with BC risk overall (HRQ5 v. Q1= 0·89, 95 % CI 0·83, 0·95, Ptrend< 0·01) and showed a significantly
lower risk in oestrogen receptor-positive (HRQ5 v. Q1= 0·89, 95 % CI 0·81, 0·98,
Ptrend= 0·02) and progesterone receptor-positive tumours (HRQ5 v. Q1= 0·87, 95 %
CI 0·77, 0·98, Ptrend< 0·01).
Conclusions: TT produces readily interpretable sparse components explaining similar amounts of variation as principal component analysis. Our results suggest that participants with a nutrient pattern high in micronutrients found in vegetables, fruits and cereals had a lower risk of BC.
Keywords Nutrient patterns Treelet transform Breast cancer European Prospective Investigation
into Cancer and Nutrition Principal component analysis
Breast cancer (BC) remains the highest incident cancer affecting women worldwide, with almost 1 670 000 cases registered in 2012. It is a major public health concern with mortality from BC accounting for over 522 000 deaths in 2012, including almost 198 000 deaths in Western coun-tries and about 324 000 in less developed regions(1). Established BC risk factors include age, genetic mutations, ethnicity, height, reproductive history, breast-feeding, hormone therapy and diabetes(2–6). Besides these, a number of modifiable lifestyle factors are associated with BC such as smoking(7,8), body fat and obesity(9–11), phy-sical inactivity(10,12,13), alcohol consumption(14–16) and diet(5,17,18). Diet has been suggested to account for up to 25–40 % of preventable causes of cancers; in particular, 50 % of BC deaths are linked to diet, although the con-sensus around this estimate is not unanimous(12,19,20). Standard approaches customarily evaluate the risk of BC associated with one or a group of dietary items, i.e. food(s) or nutrient(s). Nevertheless, associations between diet and disease might be missed when one parses the effect of a limited list of dietary constituents. Although this simplified approach of examining a single food or nutrient at a time has led to important results on the role of an indi-vidual dietary component in BC aetiology, such as fibre from vegetables, alcohol, tea consumption, folate and other micronutrients(12,14,18,20–23), research might benefit from a more comprehensive approach by exploring BC aetiology in terms of an integrated ensemble of dietary characteristics.
To capture the complexity of individuals’ dietary habits, dietary pattern analysis has emerged as a complementary holistic methodology focusing on sets of dietary variables and addressing their inherent interrelations(24). This approach is justified as components of dietary exposure are not independent(25,26)and because it allows to account for complex relationships between nutrients in biological pathways(25). In addition, BC is a multifactorial disease(2–18), the aetiology of which possibly depends on more than a restricted list of dietary items.
Recent investigations carried out in Western popula-tions(27–32)have consistently identified two main dietary pat-terns: the prudent/healthy and the Western/unhealthy(29,33). While diet is related to cultural background, common nutri-ents are present in different combinations of foods; hence looking into diet–disease associations on the nutrient scale could lead to the identification of specific nutritional profiles relevant to BC aetiology.
In the present study, nutrient patterns within the European Investigation into Cancer and Nutrition (EPIC) were related to BC risk. Nutrient patterns were obtained by applying the treelet transform (TT) that has recently been introduced into nutritional epidemiology(34–36)and the well-known principal component analysis (PCA) was used for the sake of comparison(37). TT yields sparse components and reveals the intrinsic structure of the data, thus simpli-fying interpretability. Aspects related to the application of TT to dietary data in the context of a multi-centre study are described and discussed. The association between nutrient
patterns and BC was evaluated using all BC cases and by taking into account the heterogeneity of BC subtypes by integrating information on menopausal and hormone receptor status.
Materials and methods
Study population and exclusion criteria
EPIC is a large prospective cohort of 521 330 healthy men and women designed to evaluate the relationships between dietary habits, nutrition, lifestyle factors and the incidence of cancer. The EPIC cohort includes participants from twenty-three centres in France, Germany, Denmark, Sweden, Norway, Greece, Italy, the Netherlands, Spain and the UK. In most centres, participants were recruited from the general population, the exceptions being France (women were enrolled from a national health insurance scheme covering teachers in the French education system employees), Italy (Turin and Ragusa: blood donors; Florence: screening programme participants), Spain (blood donors) and the Netherlands (Utrecht: women participating in BC screening). In Norway, only women from the general population were recruited and in the UK, one-half of the cohort (the Oxford sub-cohort) consisted of‘health-conscious’ individuals from England, Wales, Scotland and Northern Ireland. The design of the study and its rationale along with the recruitment process have been described elsewhere(38).
Among the 521 330 EPIC participants, men were first removed (n 153 427). Women with prevalent cancers at any site at baseline (other than non-melanoma skin can-cer; n 19 853) or lost to follow-up (n 2892) were excluded, as were women who did not complete any dietary ques-tionnaire (n 3315) and those who did not complete a lifestyle questionnaire (n 26). To avoid including extreme values, participants in the top and bottom 1 % of the dis-tribution of the ratio of reported total energy intake to energy requirement (n 6753) were excluded. After exclu-sion of non-first BC cases (n 2) the cohort included 335 062 women upon whom the dietary patterns were derived. An additional number of women (n 212) with missing information on BC status were excluded, which left 334 850 women retained for the statistical analyses. Cancer assessment
Incident BC cases were identified through population cancer registries (Denmark, Italy, Netherlands, Norway, Spain, Sweden and UK) or through active follow-up (France, Germany, Naples and Greece), as detailed in Ferrari et al.(21). Information on oestrogen receptor (ER) and progesterone receptor (PR) statuses was provided by each centre on the basis of pathology reports.
Dietary assessment
Long-term usual dietary intake was assessed at baseline using country-specific and validated dietary questionnaires
(self-administered FFQ, semi-quantitative or interviewer-performed)(38–40). In the validation studies, the dietary questionnaires were compared with a reference method which was in most centres 24 h dietary recalls, except in Sweden and the UK, where food records were used. Gen-erally, the correlation coefficients were between 0·40 and 0·70 for all nutrients examined which was considered satisfactory(41). Individual intakes of twenty-three nutrients and total energy were estimated using a common food composition database, the EPIC Nutrient Database (ENDB), which was compiled from national food composition data-bases of the ten countries represented in EPIC following standardized procedures(42,43).
Lifestyle questionnaires
Information on sociodemographic characteristics, includ-ing education, and lifestyle habits such as levels of phy-sical activity, tobacco smoking, as well as consumption of alcohol and drinking habits, were collected using lifestyle questionnaires. In addition, anthropometric measures and past medical information were gathered at recruitment(38).
Nutrient pattern assessment
EPIC-wide nutrient patterns were derived among female participants in EPIC using TT in the main analysis and PCA in the sensitivity analysis. The sample covariance matrix of twenty-three log-transformed nutrient densities, computed using alcohol-free energy intake(44), was consistently used. The use of the sample covariance matrix allows variability to be informative in the pattern discovery phase. The distribution of nutrient consumption tends to be log-normal and may not be best described by the mean and variance on the original scale. Moreover micro- and macronutrients are expressed on different scales (micro-grams, milligrams or grams). The nutrient densities were log-transformed to remove scale dependence and render their variance (or covariance) independent of the unit of measure. In line with previous work(28,45,46), alcohol intake was not included and was considered as a lifestyle factor. Total fat was divided into MUFA, PUFA and SFA, and total carbohydrates were broken down into starch and sugar. The micro- and macronutrients studied were Ca,β-carotene, cholesterol, MUFA, PUFA, SFA, Fe, fibre, K, Mg, P, protein, retinol, riboflavin, starch, sugar, thiamin, vitamins B6, B12, C, D, E and folate. The list of nutrients as
well as the approach described for their handling is con-sistent with the nutrient patterns initiative within EPIC described by Moskal et al.(45).
Pattern extraction
The TT method used for pattern extraction is described in detail by Gorst-Rasmussen and co-workers(35,47). Briefly, TT is a dimension reduction technique aimed at convert-ing a set of observations of possibly correlated variables into orthogonal components. TT scores, corresponding to
the projection of data onto components, generally have a small degree of correlation, unlike PCA scores that are always uncorrelated. The number of retained components was based on the percentage of explained variance, scree plots and interpretability. The nutrient patterns were defined after the inspection of factor loadings, i.e. eigen-vectors, expressing the contribution of nutrients to a given component. Score variables were determined for each component of TT and reflected adherence to a given type of diet/nutrient profile. TT combines the quantitative pattern extraction capabilities of PCA with interpretational advantages of hierarchical clustering of variables. In TT, the two variables displaying the highest correlation (or covariance) are identified, and a PCA is performed on them. The two variables are then replaced with the score of their first PCA component and a merge is indicated in
the cluster tree. This operation is re-iterated until all vari-ables have joined the cluster tree. In this way, TT produces a hierarchical grouping of variables which may reveal intrinsic characteristics of data structure. An important feature of TT is that it introduces sparsity into factors, making many factors loadings exactly equal to zero, potentially simplifying the interpretation. Alongside the cluster tree dendrogram produced by TT (as exemplified in Fig. 1), TT yields a coordinate system for the data at each level of the cluster tree. Selecting a cluster tree level (cut-level) for the TT cluster tree amounts to choosing the level of detail desired in the dimension reduction of data. More variation can be explained at the cost of factor sparsity when the cluster tree is cut near its‘root’. If the data have p variables, there are p– 1 possible cut-levels. After deciding on the number of components to retain, we performed a tenfold cross-validation to identify the opti-mal level, i.e. the point at which increasing the cut-level does not substantially increase the variation of the retained patterns. We also performed a sensitivity analysis to assess the effect of different cut-levels(35,48).
Consistently, a PCA was also applied for the sake of comparison(37). This technique yields orthogonal compo-nents that are invariant to the number of subsequent components retained. PCA identifies the best linear com-bination of the variables accounting for the most variance observed in the original data, producing components with uncorrelated scores. Results of TT analysis were compared withfindings obtained with the more classic PCA method. To make the comparison easier, and because TT returns sparse vectors, only nutrients with absolute loadings greater than 0·2 were retained to identify a given pattern in PCA.
Patterns and breast cancer risk
The associations between nutrient patterns and risk of BC were investigated by using Cox proportional hazards regression models to estimate hazard ratios (HR) and 95 % confidence intervals. Breslow’s method was adopted for handling time ties(49). The time at entry was the age at recruitment and the time of exit was the age at cancer diagnosis, death, loss or end of follow-up, whichever happenedfirst. Models were stratified by centre, to control for differences in questionnaire designs, follow-up pro-cedures and other centre-specific effects, as well as for age at recruitment (1-year categories)(50). Analyses were per-formed by considering the TT (and principal component (PC)) scores in quintiles to appreciate potential departure from linearity. Statistical analyses were adjusted for base-line menopausal status (premenopausal and perimeno-pausal (reference) or postmenoperimeno-pausal and women who underwent an ovariectomy), baseline alcohol intake (never drinkers (reference), former drinkers, drinkers only at recruitment, lifetime drinkers, unknown), height (con-tinuous), BMI (below (reference) or above 25 kg/m2), schooling level (none, primary (reference), technical/
β-Carotene 4 1,3 2 Ca P Riboflavin Total fibre K Vitamin B6 Folate Thiamin Vitamin C Fe Mg PUFA Vitamin E Sugar Cholesterol Vitamin B12 Protein Retinol Vitamin D MUFA SFA Starch Cut-level 0 5 10 15 20
Fig. 1 Cluster tree produced by the treelet transform algorithm applied to twenty-three log-transformed nutrient densities for 335 062 women in the European Prospective Investigation into Cancer and Nutrition (EPIC). The dashed line indicates the chosen cut-level (16) to extract components. The highest-variance factors, i.e. treelet components at this level of the tree, are indicated with numbered circles. The nutrients related to these nodes have non-zero loadings on the given component. Components 1 and 3 share the same node but the variable loadings differ
professional/secondary, longer education, unknown/ unspecified), age at first full-term pregnancy (nulliparous (reference),≤21 years, 21–30 years, >30 years, unknown or missing), age at menarche (≤12 years (reference), 12–14 years, >14 years, missing), age at menopause (≤50 years (reference),>50 years, premenopausal or missing), use of hormone replacement therapy (never (reference), ever, unknown), level of physical activity (categorical, metabolic equivalents of task (MET)/h: inactive (refer-ence), moderately inactive, moderately active, active, unknown) and alcohol-free energy (continuous). Use of oral contraceptive pills (never (reference), ever or unknown) and smoking status (never smokers (reference), ex-smokers, current smokers, unknown) were evaluated but not retained in thefinal models, due to limiting con-founding exerted by these variables.
The overall significance of a score variable in categories was evaluated using the likelihood ratio test statistics (PLRT) with df= 4. Additionally, P values for trend (Ptrend)
were computed by modelling a score variable with quintile-specific medians as continuous. The association between nutrient patterns and BC risk was evaluated in pre- and postmenopausal women and according to BC hormonal receptor status (ER/PR status). Interaction between menopausal status and pattern scores was explored. In addition, tests of heterogeneity of associations according to receptor status were performed using the data-augmentation method(51) by comparing the differ-ence in the log likelihood between a model with receptor status-specific variable and a model with a single HR estimate for the two categories of receptor status to a χ2 distribution with df= 1 (Pheterogeneity).
Departure from linearity was explored with restricted cubic splines(52), usingfive knots corresponding to the 1st and 99th percentiles and medians of the centred scores of quintiles 1, 3 and 5. Spline plots were produced by taking the median of the first quintile as reference. Departures from linearity were assessed via an evaluation of the joint significance of variables other than the linear one included in the model using Wald’s test on df = 3. Associations
between all of the PC and BC were investigated in a consistent way.
Statistical tests were two-sided, the per-test significance level was set to α = 0·05. All analyses were performed using the SAS statistical software package version 9·3; the ‘tt’ package in the STATA statistical software package release 12 was used to perform TT.
Results
A total of 11 576 BC cases were recorded in 11·5 years of median follow-up time and 3 670 439 person-years. Based on the information obtained at baseline, 2827 cases were premenopausal, 5872 were postmenopausal, 2548 were perimenopausal and 328 cases had a bilateral ovariectomy. Among incident cases, information on hormone receptor status for ER and PR was available only in 62 % and 52 % of total cancer cases, respectively, and was distributed as fol-lows: 81 % ER+ and 19 % ER− tumours and 63 % PR+ and 37 % PR− tumours. Descriptive information of the study sample by EPIC country is available in Table 1.
Identification of nutrient patterns
Inspection of factor loadings allowed an initial identifica-tion of four nutrient patterns with TT, explaining 62 % of total nutrient intake variability within individuals. After a tenfold cross-validation along with a sensitivity analysis strategy and after evaluating the interpretability of each pattern, we chose to cut the cluster tree at level 16. Loadings of components 1 and 2 are shown in Table 2. TT yielded a dendrogram shown in Fig. 1, with numbered nodes indicating the four highest-variance factors, where factors 1 and 2 were identified as the first two components after setting the cut-level to 16 indicated by the dashed line. This dendrogram reveals the correlation structure of the log-transformed nutrient densities. The first treelet component (TC1) loaded on vitamin D, vitamin B12,
cholesterol, protein and retinol, suggesting a diet rich in animal products. The second treelet component (TC2)
Table 1 Numbers of women and breast cancer (BC) cases (first tumours only) in the European Prospective Investigation into Cancer and Nutrition (EPIC) cohort by country
Country No. of women Person-years No. of BC cases Follow-up time (years)* Age at enrolment (years)*
France 67 356 699 216 3187 11·8 51·5 Italy 30 498 341 417 1047 11·7 50·9 Spain 24 846 299 575 495 12·6 47·7 UK general population 17 145 200 812 719 12·3 55·6 UK health-conscious 35 368 385353 761 11·3 41·5 Netherlands 26 839 315 554 916 12·2 52·7 Greece 15 224 148 594 198 10·7 53·6 Germany 27 390 272 011 834 10·9 48·4 Sweden 26 339 349 110 1095 13·9 50·6 Denmark 28 693 316 601 1340 11·6 56·3 Norway 35 152 342 195 984 10·1 48·0 Total 334 850 3 670 439 11 576 11·5 51·0
presented high positive loadings on β-carotene, thiamin, fibre, vitamin C and folate, and singled out some nutrients with mild loadings (<0·2), i.e. Fe, Ca, K, Mg and P (Table 2). TC2 may evoke a diet rich in vegetables, fruits and cereals. While the third treelet component (TC3) was largely driven by vitamin D, the fourth treelet component (TC4) was less straightforward to characterize, as dis-played in the online supplementary material, Supple-mental Table 1. Distributions of known risk factors for BC by quintiles of TT scores for thefirst two components are displayed in Table 3.
PC loadings are displayed in the online supplementary material, Supplemental Table 2. PCA produced patterns similar to TT with respect to the amount of variability explained and the nutrients contributing to the definition of each component: with PC1 displaying high loadings for cholesterol, retinol, vitamin B12and vitamin D and
nega-tive loadings for vitamin C andβ-carotene; and PC2 sug-gesting a micronutrient-dense pattern rich in fruits, vegetables, plant foods and dairy. The first two compo-nents (in TT and PCA) explained the most variability and were the most informative with respect to capturing meaningful nutrient patterns, and thus were further related to BC risk in disease models.
Nutrient patterns and breast cancer risk
Scores of nutrient patterns were related to BC risk. TC1 showed no statistically significant association with BC risk with HRTC1 Q5 v. Q1= 1·05 (95 % CI 0·98, 1·13, Ptrend= 0·36,
PLRT= 0·39), while TC2 was significantly associated with
BC risk with HRTC2 Q5 v. Q1= 0·89 (95 % CI 0·83, 0·95,
Ptrend< 0·001, PLRT= 0·02), as shown in Table 4. The
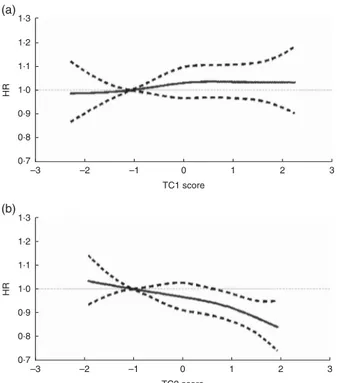
relationship between TT scores and BC risk was modelled through restricted cubic splines (RCS) and is presented in Fig. 2. Overall, there was a significant progressive decrease in BC risk for the second component. TC2 scores showed a linear decrease in BC risk (RCSTC2Ptrend= 0·02).
However, no departure from linearity was observed (PWald non-linearity= 0·94 and 0·77, respectively, in TC1 and
TC2; Fig. 2). Analyses of interaction between TC (or PC) scores and menopausal status were not statistically significant (results not shown).
Hormonal receptor status
In ER−tumours, no significant association with BC risk was observed for TC1 and TC2 scores (Table 4). For ER+ tumours there was a decrease in BC risk in the fourth and fifth quintiles of TC2 scores with HRQ4 v. Q1= 0·90 (95 % CI
0·83, 0·99) and HRQ5 v. Q1= 0·89 (95 % CI 0·81, 0·98,
Ptrend= 0·02; Table 4). Regarding PR−tumours (see online
supplementary material, Supplemental Table 3), the sec-ond component TC2 showed a decreased BC risk with HRQ5 v. Q1= 0·84 (95 % CI 0·72, 0·98). For PR+tumours,
TC2 was linked with a decreased BC risk in participants in thefifth quintile with HRQ5 v. Q1= 0·87 (95 % CI 0·77, 0·98).
No significant association was seen for ER−/PR−tumours (Table 5). TC2 was linked with a decreased BC risk trend in ER+/PR+ tumours with HRQ5 v. Q1= 0·86 (0·76, 0·98,
Ptrend< 0·01; Table 5). Tests of heterogeneity yielded no
significant results.
PCA derived components displayed a significant increase in BC risk for PC1 in participants in the highest quintile and a decreasing trend of BC risk for PC2, as shown in the online supplementary material, Supple-mental Table 4 and SuppleSupple-mental Fig. 1. Results of asso-ciations of PC with tumours by hormone receptor status are displayed in the online supplementary material, Sup-plemental Tables 4 and 5.
Discussion
In the present study, the role of nutrient patterns in the aetiology of BC was explored through the use of TT, a multivariate method recently introduced to the landscape of nutritional epidemiology(34–36). The association was evaluated in the context of the EPIC study, characterized by large variability of dietary habits and by a large number of incident cancer cases across participating centres(38).
In recent years, dietary pattern analysis has emerged as a promising technique, complementary to methods focusing on individual foods or food components, to investigate the relationships between diet and risk of disease(25). A systematic review and meta-analysis on dietary patterns in BC aetiology(33) selected eighteen Table 2 Loadings of the first two components from treelet transform
(TT; cut-level 16) TT 16 loadings Variable* TC1 TC2 Ca 0·153 β-Carotene 0·721 Cholesterol 0·294 MUFA PUFA SFA Fe 0·109 Fibre 0·183 K 0·157 Mg 0·144 P 0·074 Protein 0·086 Retinol 0·679 Riboflavin 0·141 Starch Sugar Thiamin 0·217 Vitamin B6 0·185 Vitamin B12 0·421 Vitamin C 0·452 Vitamin D 0·517 Vitamin E Folate 0·235 Explained variance 26 % 21 %
TC1, treelet component 1; TC2, treelet component 2. *Log-transformed nutrient variables.
relevant studies from case–control and cohort studies that used combinations of foods and micronutrients to identify dietary patterns(17,27,53–66). Two a posteriori defined patterns emerged consistently: the Western/unhealthy (in seventeen studies) and the prudent/healthy (eighteen
studies)(33). In the aforementioned meta-analysis(33), the prudent/healthy dietary pattern, rich in intakes of vege-tables, leafy vegevege-tables, legumes andfish, was associated to decreased BC risk (relative risk comparing top v. bottom categories= 0·89, 95 % CI 0·82, 0·99), while the Western/
Table 3 Lifestyle and dietary baseline characteristics* according to the lowest, middle and highest quintiles of treelet transform (cut-level 16) scores for the first and second components among 334 850 women in the European Prospective Investigation into Cancer and Nutrition (EPIC)
TC1 TC2
Q1 Q3 Q5 Q1 Q3 Q5
Mean SD Mean SD Mean SD Mean SD Mean SD Mean SD
No. of women 66 988 66 977 66 955 66 961 66 969 66 970
Age (years) 50·2 11·8 50·8 9·5 52·0 8·1 49·6 9·3 51·1 9·5 52·2 10·9
Weight (kg) 63·0 11·6 64·8 11·8 65·0 11·9 64·0 11·9 64·0 11·7 63·8 11·5 Height (cm) 160·1 7·1 162·6 6·5 163·0 6·5 162·0 6·9 162·5 6·7 162·0 6·5 Non-alcohol energy (kJ/d) 7565 2280 7573 2171 7368 2121 8309 2406 7623 2138 6820 1929 Non-alcohol energy (kcal/d) 1808 545 1810 519 1761 507 1986 575 1822 511 1630 461
% % % % % % BMI class Below 25 kg/m2 57 59 57 58 58 59 Above 25 kg/m2 43 41 43 42 42 41 Schooling level None 11 3 2 5 5 4 Primary 25 22 26 33 23 17 Technical/professional/secondary 35 47 50 44 46 44 Longer education 25 23 19 16 23 28 Unspecified/unknown 4 5 3 2 3 8
Use of hormone replacement therapy
Never 82 68 60 71 68 69
Ever 16 25 31 20 25 27
Unknown 2 7 9 9 7 4
Age at first term pregnancy
Nulliparous 21 13 11 13 14 19 ≤21 years 16 18 24 20 18 17 21–30 years 52 56 54 54 56 52 >30 years 9 9 7 8 8 8 Unknown 3 5 4 5 4 5 Age at menarche ≤12 years 38 35 33 33 35 39 12–14 46 46 47 46 47 45 >14 years 15 15 17 16 16 14 Unknown 1 4 4 5 3 3 Age at menopause ≤50 years 19 16 18 17 17 18 >50 years 19 18 19 16 18 19 Unknown 63 66 63 67 65 62 Menopausal status
Pre and peri 55 55 49 60 53 49
Post and ovariectomy 45 45 51 40 47 51
Alcohol drinkers Never 16 6 4 8 8 9 Former 6 3 2 4 3 4 Only at recruitment 17 11 8 6 11 19 Lifetime 51 56 46 44 54 57 Unknown 10 22 40 38 24 11 Physical activity Inactive 31 20 16 25 20 21 Moderately inactive 33 33 28 30 31 33 Moderately active 21 23 18 18 22 24 Active 13 15 12 12 14 17 Unknown 2 10 25 15 13 5
TC1, treelet component 1; TC2, treelet component 2; Q1, quintile 1; Q3, quintile 3; Q5, quintile 5.
unhealthy pattern, characterized by intakes of high-fat dairy products, red meat, processed meats and French fries, was not associated with BC risk. A recent study of the California Teachers Cohort identified a plant-based pattern, which was related to a reduction of BC risk(67). In parallel, increasing evidence is accumulating that adher-ence to the a priori defined Mediterranean pattern is associated with a decreased BC risk(68–70), although results from these studies are not totally consistent, particularly for premenopausal women(70,71).
The dimension reduction techniques used herein were applied to nutrient densities. Nutrients are present in dif-ferent combinations of foods, are less country-specific and are directly involved in biological reactions(72). By exploring macro- and micronutrients, the present study aimed to provide an exhaustive representation of indivi-duals’ diet. Log-transformation was used to address scaling issues that can arise because macro- and micronutrients are expressed in different units. In this way, the variance and the components’ decomposition are invariant to the unit of measure. Dietary normalization was achieved using equal energy, i.e. by dividing nutrient intakes by energy intake, minus energy from alcohol intake(44). Most nutrients are associated with total energy because
either they contribute to total energy directly or because people with higher energy values tend to display larger intakes of specific nutrients(44,73).
Thefirst two patterns were retained as they were the most interpretable and depicted realistic nutrient patterns that could ultimately be linked with disease risk. Thefirst pattern identified a diet characterized by animal products as opposed to a vegetarian diet, and was associated with a non-significant increase of 5 % in BC risk (TT). TC1 was quite comparable to a Western pattern. Two recent reviews on dietary patterns and BC(74,75)showed that diets rich in high-fat foods and processed meats were associated with an increased BC risk, although thefindings described in both reviews have not been conclusive in this respect with most results reporting a positive association between Western-like dietary pattern and BC being not statistically significant(74,75).
In our study, the micronutrient-dense pattern characterized by a diet rich in vitamins and minerals, akin to a prudent pattern, was associated with an 11 % reduction in BC risk (TT), in line with previousfindings(33,74,75). The protective effect may come from the anti-carcinogenic properties of nutrients such as β-carotene, vitamins C and E, that may exert an antioxidant effect on oestrogen metabolism and reduce cell proliferation(75). The TT components were
Table 4 Hazard ratios (HR) and 95 % confidence intervals for breast cancer (BC) by quintiles of pattern scores (first and second components of treelet transform, cut-level 16) for overall, oestrogen receptor-positive (ER+) and oestrogen receptor-negative (ER−) tumours in 334 850
women in the European Prospective Investigation into Cancer and Nutrition (EPIC)
TC1 TC2 Model* Person-years No. of BC cases HR 95 % CI PLRT† Ptrend‡ Person-years No. of BC cases HR 95 % CI PLRT† Ptrend‡ Overall Q1 730 785 1784 1·00 Ref. 0·39 0·36 747 690 2317 1·00 Ref. 0·02 <0·001 Q2 738 136 2342 1·06 0·99, 1·13 736 718 2307 0·95 0·89, 1·00 Q3 735 683 2376 1·04 0·97, 1·11 729 544 2365 0·95 0·89, 1·01 Q4 737 533 2513 1·06 0·99, 1·14 725 903 2350 0·94 0·88, 1·00 Q5 728 303 2561 1·05 0·98, 1·13 730 584 2237 0·89 0·83, 0·95 ER+ Q1 725 634 885 1·00 Ref. 0·55 0·47 740 268 1133 1·00 Ref. 0·13 0·02 Q2 731 571 1214 1·07 0·98, 1·17 729 915 1140 0·92 0·84, 1·00 Q3 728 782 1212 1·06 0·97, 1·16 722 467 1192 0·92 0·84, 1·00 Q4 729 703 1247 1·08 0·98, 1·19 719 201 1193 0·90 0·83, 0·99 Q5 720 422 1272 1·05 0·95, 1·16 724 261 1172 0·89 0·81, 0·98 ER– Q1 721 118 227 1·00 Ref. 0·94 0·43 734 469 287 1·00 Ref. 0·25 0·06 Q2 725 180 302 1·03 0·86, 1·23 724 168 318 1·06 0·90, 1·24 Q3 722 496 301 0·99 0·82, 1·18 716 332 288 0·93 0·78, 1·10 Q4 723 410 316 1·01 0·83, 1·22 713 221 288 0·93 0·78, 1·12 Q5 714 166 292 0·95 0·78, 1·16 718 180 257 0·87 0·71, 1·05 Pheterogeneity§ 0·70 0·12
TC1, treelet component 1; TC2, treelet component 2; Q1, quintile 1; Q2, quintile 2; Q3, quintile 3; Q4, quintile 4; Q5, quintile 5; Ref., reference category. *Models were stratified by study centre and age in 1-year categories and adjusted for baseline menopausal status (premenopausal and perimenopausal (reference) or postmenopausal and women who underwent an ovariectomy), baseline alcohol intake (never drinkers (reference), former drinkers, drinkers only at recruitment, lifetime drinkers, unknown), height (continuous), BMI (below (reference) or above 25 kg/m2), schooling level (none, primary (reference), technical/
professional/secondary, longer education, unknown/unspecified), age at first full-term pregnancy (nulliparous (reference),≤21 years, 21–30 years, >30 years, unknown or missing), age at menarche (≤12 years (reference), 12–14 years, >14 years, missing), age at menopause (≤50 years (reference), >50 years, pre-menopause or missing), use of hormone replacement therapy (never (reference), ever, unknown), level of physical activity (inactive (reference), moderately inactive, moderately active, active, unknown) and alcohol-free energy (continuous).
†PLRT,P values for the likelihood ratio test (LRT) that was used to evaluate the overall significance of a score variable in quintile categories compared with a
χ2
distribution with df= 4.
‡Ptrend,P values obtained by modelling score variables with quintile-specific medians as continuous variables.
highly correlated with those of PCA (ρTC1,PC1= 0·91, ρTC2, PC2= 0·86). TT and PCA provided overall consistent findings
in terms of pattern identification and amount of total variability explained. Further analyses were conducted by menopausal status at cohort enrolment, showing no differential association in pre- and postmenopausal women. Analyses carried out by hormonal receptor status showed that the second TT nutrient pattern was related to a sig-nificant decrease in BC risk for ER+, PR+, PR−and ER+/PR+
tumours. These results are complementary to previous lit-eraturefindings on dietary patterns and hormonal defined risk of BC(58,67,70,75). Indeed, Fung et al. found that a prudent dietary pattern was linked with decreased ER−risk (relative risk= 0·62, 95 % CI 0·45, 0·91)(76). ER−/PR−tumour risk was reduced in postmenopausal women among participants in the highest quintiles of a plant-based pattern and an a priori defined Mediterranean diet by 34 % and 20 %, respec-tively(67,70). Results from the Pooling Project of Prospective Studies of Diet and Cancer found a protective association between total fruit or fruit and vegetable consumption in ER−tumours but not in ER+tumours or overall BC risk(77).
Whereas a large portion of the scientific literature on dietary patterns has used factor analysis or principal com-ponent factor analysis(74), the current paper promotes the use of TT. While PCA produces patterns that are eigenvec-tors of a covariance/correlation matrix of starting variables, TT is a multivariate technique that yields components by aggregating variables according to covariance/correla-tion(78), while at the same time exploring the clustering structure of variables, combining features of PCA with those of cluster analysis. Eventually, TT produces a cluster tree revealing the hierarchical grouping structure of variables. The dendrogram allows a visual inspection of the way dif-ferent nutrients cluster, possibly easing interpretability of patterns. In addition, loadings are sparse, i.e. some of them are equal to zero as they do not pertain to the clustering node of the component so that a limited number of variables contributes to each treelet component.
In line with other clustering techniques(79), TT users are confronted with subjective decisions to select the appro-priate cut-level for the cluster tree. Information on the grouping structure of variables that have joined (or not) the tree are specific to each level of the TT tree. By choosing a cut-level, the user decides on how much information to extract and the degree of sparsity of the components. If the tree is cut near the‘root’, all nutrient variables join the tree. The information would be comparable to PCA output, i.e. all variables would contribute to treelet components. If the tree is cut closer to the‘leaves’, i.e. when the cut-level is lower, loadings are sparse as many are equal to zero, possibly making the interpretation easier. By contrast, this may lead to components that do not capture dietary complexity and are therefore not informative. As pointed out by Meins-hausen and Bühlmann, the use of TT leads to a trade-off between amount of variability explained and sparsity. The objective is to‘make the results as sparse as possible but not any sparser’(48). To identify an optimal cut-level,
cross-validation can be used. Once the cut-level is chosen, the loadings computed are invariant to the number of compo-nents to be retained; hence keeping n compocompo-nents is an a priori parameter to be specified in the cross-validation step. The present study relied on dietary questionnaires to assess nutrient intakes, which are prone to measurement errors and may lack information on some relevant nutri-ents. Questionnaires were country-specific, potentially
1.3 1.2 1.1 1.0 0.9 0.8 0.7 –3 –2 –1 0 1 2 3 TC1 score HR 1.3 1.2 1.1 1.0 0.9 0.8 0.7 –3 –2 –1 0 1 2 3 TC2 score HR (a) (b)
Fig. 2 Relationship between nutrient patterns derived from treelet transform and breast cancer risk (———, hazard ratio (HR);– – – – –, associated 95 % CI), obtained by using restrictive cubic splines with values of 1st and 99th percentiles and medians of quintiles 1, 3 and 5 used as knots, among 334 850 women in the European Prospective Investigation into Cancer and Nutrition (EPIC): (a) first treelet component (TC1), P non-linearity= 0·94, Ptrend= 0·88; (b) second treelet component (TC2),
Pnon-linearity= 0·77, Ptrend= 0·02. Models were stratified by study
centre and age in 1-year categories and adjusted for baseline menopausal status (premenopausal and perimenopausal (reference) or postmenopausal and women who underwent an ovariectomy), baseline alcohol intake (never drinkers (reference), former drinkers, drinkers only at recruitment, lifetime drinkers, unknown), height (continuous), BMI (below (reference) or above 25 kg/m2), schooling level (none, primary (reference), technical/
professional/secondary, longer education, unknown/unspecified), age at first full-term pregnancy (nulliparous (reference), ≤21 years, 21–30 years, >30 years, unknown or missing), age at menarche (≤12 years (reference), 12–14 years, >14 years, missing), age at menopause (≤50 years (reference), >50 years, pre-menopause or missing), use of hormone replacement therapy (never (reference), ever, unknown), level of physical activity (inactive (reference), moderately inactive, moderately active, active, unknown) and alcohol-free energy (continuous). Ptrend was obtained by evaluating the joint significance of
variables other than the linear one in the model by using Wald’s test with df = 3
introducing systematic between-country differences in nutrient assessment. However, in the EPIC study, harmo-nized composition tables across European countries were used to translate food into nutrient intakes(42), thus size-ably improving the comparability of nutrient intakes.
One key element in pattern literature is reproducibility of patterns across populations. With twenty-three centres from ten countries, EPIC accounts for a wide heterogeneity in diet(80,81). Previousfindings in Moskal et al.’s study(45) on the EPIC data showed that more than 75 % of the variance that would be captured by centre-specific PC was captured by PC from overall PCA. This evidence suggested that overall PCA combining data from all EPIC centres allows capturing a good proportion of the variance explained by each EPIC centre. This motivated the choice of applying pattern decomposition on the overall data.
Conclusion
The current study presented results of a nutrient pattern analysis in an international setting using a new tool, TT, and subsequently related the patterns to risk of developing BC. TT is a complementary method to PCA in nutritional epi-demiology as it produces readily interpretable sparse com-ponents. In the EPIC study, nutrient patterns characterized by a diet rich in macronutrients of animal origin, such as
cholesterol or SFA, were associated with a non-significant increase in BC risk while a diet rich in vitamins, minerals and β-carotene, indicating a more plant-based diet, was associated with a significant decreased BC risk. This decrease was also significant for ER+, PR+, PR−and ER+/PR+
tumours.
Acknowledgements
Acknowledgement: The authors thank Dr Anders Gorst-Rasmussen (Department of Cardiology, Aalborg University Hospital) for his critical input and useful discussions about the manuscript. Financial support: The coordination of the EPIC study isfinancially supported by the European Com-mission (Directorate General for Health and Consumer Affairs) and the International Agency for Research on Cancer (IARC). The national cohorts are supported by: the Health Research Fund (FIS) of the Spanish Ministry of Health RTICC ‘Red Temática de Investigación Cooperativa en Cáncer (grant numbers Rd06/0020/0091 and Rd12/0036/0018), the Regio-nal Governments of Andalucía, Asturias, Basque Country, Murcia (project 6236) and Navarra, and the Instituto de Salud Carlos III, Redes de Investigacion Cooperativa (RD06/0020) (Spain); the Danish Cancer Society (Denmark); the Ligue Contre le Cancer, the Institut Gustave Roussy, Mutuelle Générale de l’Education Nationale and the Institut National
Table 5 Hazard ratios (HR) and 95 % confidence intervals for breast cancer (BC) by quintiles of pattern scores (first and second components of treelet transform, cut-level 16) for oestrogen receptor-positive + progesterone receptor-positive (ER+/PR+) and oestrogen
receptor-negative + progesterone receptor-receptor-negative (ER−/PR–) tumours in 334 850 women in the European Prospective Investigation into Cancer and Nutrition (EPIC) TC1 TC2 Model* Person-years No. of BC cases HR 95 % CI PLRT† Ptrend‡ Person-years No. of BC cases HR 95 % CI PLRT† Ptrend‡ ER+/PR+ Q1 723 508 568 1·00 Ref. 0·16 0·26 737 812 753 1·00 Ref. 0·15 <0·01 Q2 728 884 811 1·15 1·03, 1·29 727 617 777 0·95 0·86, 1·05 Q3 725 948 750 1·10 0·98, 1·23 719 931 777 0·94 0·84, 1·04 Q4 726 667 751 1·11 0·98, 1·25 716 303 720 0·89 0·79, 0·99 Q5 717 569 773 1·11 0·98, 1·26 720 914 626 0·86 0·76, 0·98 ER−/PR– Q1 720 830 172 1·00 Ref. 0·60 0·31 734 117 218 1·00 Ref. 0·26 0·08 Q2 724 871 235 1·09 0·89, 1·33 723 844 241 1·05 0·87, 1·26 Q3 722 003 207 0·93 0·75, 1·15 715 963 207 0·88 0·72, 1·08 Q4 722 988 222 0·98 0·79, 1·23 712 804 210 0·93 0·76, 1·14 Q5 713 798 214 0·97 0·77, 1·22 717 762 174 0·85 0·68, 1·06 Pheterogeneity§ 0·19 0·27
TC1, treelet component 1; TC2, treelet component 2; Q1, quintile 1; Q2, quintile 2; Q3, quintile 3; Q4, quintile 4; Q5, quintile 5; Ref., reference category. *Models were stratified by study centre and age in 1-year categories and adjusted for baseline menopausal status (premenopausal and perimenopausal (reference) or postmenopausal and women who underwent an ovariectomy), baseline alcohol intake (never drinkers (reference), former drinkers, drinkers only at recruitment, lifetime drinkers, unknown), height (continuous), BMI (below (reference) or above 25 kg/m2), schooling level (none, primary (reference), technical/ professional/secondary, longer education, unknown/unspecified), age at first full-term pregnancy (nulliparous (reference),≤21 years, 21–30 years, >30 years, unknown or missing), age at menarche (≤12 years (reference), 12–14 years, >14 years, missing), age at menopause (≤50 years (reference), >50 years, pre-menopause or missing), use of hormone replacement therapy (never (reference), ever, unknown), level of physical activity (inactive (reference), moderately inactive, moderately active, active, unknown) and alcohol-free energy (continuous).
†PLRT,P values for the likelihood ratio test (LRT) that was used to evaluate the overall significance of a score variable in quintile categories compared with a χ2
distribution with df= 4.
‡Ptrend,P values obtained by modelling score variables with quintile-specific medians as continuous variables.
de la Santé et de la Recherche Médicale (France); the Deutsche Krebshilfe, the Deutsches Krebsforschungszen-trum and the Federal Ministry of Education and Research (Germany); the Hellenic Health Foundation, the Stavros Niarchos Foundation and the Hellenic Ministry of Health and Social Solidarity (Greece); the Italian Association for Research on Cancer (AIRC) and the National Research Council (Italy); the Dutch Ministry of Public Health, Welfare and Sports, the Netherlands Cancer Registry, LK Research Funds, Dutch Prevention Funds, Dutch Zorg Onderzoek Nederland, the World Cancer Research Fund and Statistics Netherlands (Netherlands); the European Research Council (2009-AdG 232997) and the Nordforsk, Nordic Centre of Excellence programme on Food, Nutrition and Health (Norway); the Swedish Cancer Society, the Swedish Research Council and the Regional Governments of Skåne and Västerbotten (Sweden); Cancer Research UK, the Med-ical Research Council, the Stroke Association, the British Heart Foundation, the Department of Health, the Food Standards Agency and the Wellcome Trust (UK). The work undertaken by N.A. was supported by a Université de Lyon doctoral grant (EDISS doctoral school). Conflict of interest: None. Authorship: The authors’ responsibilities were as fol-lows. N.A. performed statistical analyses; N.A. and P.F. interpreted the findings and developed a first draft of the manuscript; A.M., N.S., V.V., V.C., H.F., S.M., S.K., J.F., E.W., L.L.-B. and I.R. contributed to the writing of the manuscript; P.A., E.A., E.M.-M., D.S., J.R.Q., A.O., A.Tj., C.C.D., K.O., L.D., A.F., L.B., R.T.F., R.K., A.Tr., C.B., P.O., M.S.D.M., G.M., C.A., F.R., R.Tu., H.B.B.d.M., M.F.B., P.H.M.P., G.S., T.B., A.W., I.J., K.-T.K., N.J.W., T.K., R.Tr., J.A.S., M.A.M. and E.R. substantially contributed to the interpretation of results and critically revised the content of the manuscript; and all authors contributed to the planning, execution and inter-pretation of the submitted manuscript, and read and approved the final manuscript. Ethics of human subject participation: This study was conducted according to the guidelines laid down in the Declaration of Helsinki and all procedures involving human subjects were approved by the IARC and the local ethical review committees. Written informed consent was obtained from all participants.
Supplementary material
To view supplementary material for this article, please visit http://dx.doi.org/10.1017/S1368980015000294
References
1. Bray F, Ren JS, Masuyer E et al. (2013) Estimates of global cancer prevalence for 27 sites in the adult population in 2008. Int J Cancer 132, 1133–1145.
2. Key TJ, Verkasalo PK & Banks E (2001) Epidemiology of breast cancer. Lancet Oncol 2, 133–140.
3. Collaborative Group on Hormonal Factors in Breast Cancer (2001) Familial breast cancer: collaborative reanalysis of individual data from 52 epidemiological studies including
58 209 women with breast cancer and 101 986 women without the disease. Lancet 358, 1389–1399.
4. Green J, Cairns BJ, Casabonne D et al. (2011) Height and cancer incidence in the Million Women Study: prospective cohort, and meta-analysis of prospective studies of height and total cancer risk. Lancet Oncol 12, 785–794.
5. Chlebowski R (2007) Lifestyle change including dietary fat reduction and breast cancer outcome. J Nutr 137, 1 Suppl., 233S–235S.
6. Anothaisintawee T, Wiratkapun C, Lerdsitthichai P et al. (2013) Risk factors of breast cancer: a systematic review and meta-analysis. Asia Pac J Public Health 25, 368–387. 7. McKenzie F, Ellison-Loschmann L, Jeffreys M et al. (2013)
Cigarette smoking and risk of breast cancer in a New Zealand multi-ethnic case–control study. PLoS One 8, e63132.
8. Terry PD & Goodman M (2006) Is the association between cigarette smoking and breast cancer modified by genotype? A review of epidemiologic studies and meta-analysis. Cancer Epidemiol Biomarkers Prev 15, 602–611.
9. Rohan TE, Heo M, Choi L et al. (2013) Body fat and breast cancer risk in postmenopausal women: a longitudinal study.
J Cancer Epidemiol 2013, 754815.
10. McCullough LE, Eng SM, Bradshaw PT et al. (2012) Fat orfit: the joint effects of physical activity, weight gain, and body size on breast cancer risk. Cancer 118, 4860–4568. 11. Amadou A, Hainaut P & Romieu I (2013) Role of obesity in
the risk of breast cancer: lessons from anthropometry. J Oncol 2013, 906495.
12. World Cancer Research Fund/American Institute for Cancer Research (2010) Continuous Update Project Report. Food, Nutrition, Physical Activity, and the Prevention of Breast Cancer. http://www.dietandcancerreport.org/cancer_resource_ center/downloads/cu/Breast-Cancer-2010-Report.pdf
13. Monninkhof EM, Elias SG, Vlems FA et al. (2007) Physical activity and breast cancer: a systematic review. Epidemiol-ogy 18, 137–157.
14. Fagherazzi G, Vilier A, Boutron-Ruault M-C et al. (2014) Alcohol consumption and breast cancer risk subtypes in the E3N-EPIC cohort. Eur J Cancer Prev (Epublication ahead of print version).
15. Tjønneland A, Christensen J, Olsen A et al. (2007) Alcohol intake and breast cancer risk: the European Prospective Investigation into Cancer and Nutrition (EPIC). Cancer Causes Control 18, 361–373.
16. Zhang SM, Lee I-M, Manson JE et al. (2007) Alcohol con-sumption and breast cancer risk in the Women’s Health Study. Am J Epidemiol 165, 667–676.
17. Cui X, Dai Q, Tseng M et al. (2007) Dietary patterns and breast cancer risk in the Shanghai breast cancer study. Cancer Epidemiol Biomarkers Prev 16, 1443–1448. 18. Levi F, Pasche C, Lucchini F et al. (2001) Dietary intake of
selected nutrients and breast-cancer risk. Int J Cancer 91, 260–263.
19. Doll R (1992) The lessons of life: keynote address to the nutrition and cancer conference. Cancer Res 52, 7 Suppl., 2024S–2029S.
20. Anand P, Kunnumakkara AB, Kunnumakara AB et al. (2008) Cancer is a preventable disease that requires major lifestyle changes. Pharm Res 25, 2097–2116.
21. Ferrari P, Rinaldi S, Jenab M et al. (2013) Dietaryfiber intake and risk of hormonal receptor-defined breast cancer in the European Prospective Investigation into Cancer and Nutrition study. Am J Clin Nutr 97, 344–353.
22. Wu AH, Yu MC, Tseng C-C et al. (2003) Green tea and risk of breast cancer in Asian Americans. Int J Cancer 106, 574–579.
23. Shrubsole MJ, Jin F, Dai Q et al. (2001) Dietary folate intake and breast cancer risk: results from the Shanghai Breast Cancer Study. Cancer Res 61, 7136–7141.
24. Jacques PF & Tucker KL (2001) Are dietary patterns useful for understanding the role of diet in chronic diseases? Am J Clin Nutr 73, 1–2.
25. Hu FB (2002) Dietary pattern analysis: a new direction in nutritional epidemiology. Curr Opin Lipidol 13, 3–9. 26. Jacobs DR & Steffen LM (2003) Nutrients, foods, and dietary
patterns as exposures in research: a framework for food synergy. Am J Clin Nutr 78, 3 Suppl., 508S–513S. 27. De Stefani E, Deneo-Pellegrini H, Boffetta P et al. (2009)
Dietary patterns and risk of cancer: a factor analysis in Uruguay. Int J Cancer 124, 1391–1397.
28. Edefonti V, Bravi F, Garavello W et al. (2010) Nutrient-based dietary patterns and laryngeal cancer: evidence from an exploratory factor analysis. Cancer Epidemiol Biomarkers Prev 19, 18–27.
29. Nkondjock A, Krewski D, Johnson KC et al. (2005) Dietary patterns and risk of pancreatic cancer. Int J Cancer 114, 817–823.
30. Schulze MB, Hoffmann K, Kroke A et al. (2001) Dietary patterns and their association with food and nutrient intake in the European Prospective Investigation into Cancer and Nutrition (EPIC)-Potsdam study. Br J Nutr 85, 363–373. 31. Vrieling A, Buck K, Seibold P et al. (2013) Dietary patterns
and survival in German postmenopausal breast cancer survivors. Br J Cancer 108, 188–192.
32. De Stefani E, Boffetta P, Ronco AL et al. (2008) Nutrient patterns and risk of lung cancer: a factor analysis in Uruguayan men. Lung Cancer 61, 283–291.
33. Brennan SF, Cantwell MM, Cardwell CR et al. (2010) Dietary patterns and breast cancer risk: a systematic review and meta-analysis. Am J Clin Nutr 91, 1294–1302.
34. Dahm CC, Gorst-Rasmussen A, Crowe FL et al. (2012) Fatty acid patterns and risk of prostate cancer in a case–control study nested within the European Prospective Investigation into Cancer and Nutrition. Am J Clin Nutr 96, 1354–1361. 35. Gorst-Rasmussen A, Dahm CC, Dethlefsen C et al. (2011)
Exploring dietary patterns by using the treelet transform. Am J Epidemiol 173, 1097–1104.
36. Schoenaker DAJM Dobson AJ, Soedamah-Muthu SS et al. (2013) Factor analysis is more appropriate to identify overall dietary patterns associated with diabetes when compared with Treelet transform analysis. J Nutr 143, 392–398. 37. Jolliffe IT (2002) Principal Component Analysis, 2nd ed.
New York: Springer-Verlag.
38. Riboli E, Hunt KJ, Slimani N et al. (2002) European Pro-spective Investigation into Cancer and Nutrition (EPIC): study populations and data collection. Public Health Nutr 5, 1113–1124.
39. Riboli E & Kaaks R (1997) The EPIC project: rationale and study design. European Prospective Investigation into Cancer and Nutrition. Int J Epidemiol 26, Suppl. 1, S6–S14. 40. Kaaks R, Slimani N & Riboli E (1997) Pilot phase studies on the accuracy of dietary intake measurements in the EPIC project: overall evaluation of results. European Prospective Investigation into Cancer and Nutrition. Int J Epidemiol 26, Suppl. 1, S26–S36.
41. Margetts B & Pietinen P (1997) European Prospective Inves-tigation into Cancer and Nutrition: validity studies on dietary assessment methods. Int J Epidemiol 26, Suppl. 1, S1–S5. 42. Slimani N, Deharveng G, Unwin I et al. (2007) The EPIC
nutrient database project (ENDB): afirst attempt to standar-dize nutrient databases across the 10 European countries participating in the EPIC study. Eur J Clin Nutr 61, 1037–1056. 43. Bouckaert KP, Slimani N, Nicolas G et al. (2011) Critical evaluation of folate data in European and international databases: recommendations for standardization in inter-national nutritional studies. Mol Nutr Food Res 55, 166–180. 44. Willett WC, Howe GR & Kushi LH (1997) Adjustment for total energy intake in epidemiologic studies. Am J Clin Nutr 65, 4 Suppl., 1220S–1228S.
45. Moskal A, Pisa P, Ferrari P et al. (2014) Nutrient patterns and their food sources in an international study setting: report from the EPIC study. PLoS One 9, e98647.
46. Imamura F, Lichtenstein AH, Dallal GE et al. (2009) Con-founding by dietary patterns of the inverse association between alcohol consumption and type 2 diabetes risk. Am J Epidemiol 170, 37–45.
47. Gorst-Rasmussen A (2011) tt: treelet transform with Stata. Stata J 12, 130–146.
48. Meinshausen N & Bühlmann P (2008) Discussion of: treelets – an adaptive multi-scale basis for sparse unordered data. Ann Appl Stat 2, 478–481.
49. Thiébaut ACM & Bénichou J (2004) Choice of time-scale in Cox’s model analysis of epidemiologic cohort data: a simulation study. Stat Med 23, 3803–3820.
50. Ferrari P, Day NE, Boshuizen HC et al. (2008) The evalua-tion of the diet/disease relaevalua-tion in the EPIC study: con-siderations for the calibration and the disease models. Int J Epidemiol 37, 368–378.
51. Lunn M & McNeil D (1995) Applying Cox regression to competing risks. Biometrics 51, 524–532.
52. Heinzel H & Kaider A (1997) Gaining more flexibility in Cox proportional hazards regression models with cubic spline functions. Comput Methods Programs Biomed 54, 201–208.
53. Männistö S, Dixon LB, Balder HF et al. (2005) Dietary pat-terns and breast cancer risk: results from three cohort stu-dies in the DIETSCAN project. Cancer Causes Control 16, 725–733.
54. Agurs-Collins T, Rosenberg L, Makambi K et al. (2009) Dietary patterns and breast cancer risk in women partici-pating in the Black Women’s Health Study. Am J Clin Nutr 90, 621–628.
55. Terry P, Suzuki R & Hu FB (2001) A prospective study of major dietary patterns and the risk of breast cancer. Cancer Epidemiol Biomarkers Prev 10, 1281–1285.
56. Sieri S, Krogh V, Pala V et al. (2004) Dietary patterns and risk of breast cancer in the ORDET Cohort. Cancer Epide-miol Biomarkers Prev 13, 567–572.
57. Adebamowo CA, Hu FB, Cho E et al. (2005) Dietary patterns and the risk of breast cancer. Ann Epidemiol 15, 789–795.
58. Fung TT, Hu FB, Holmes MD et al. (2005) Dietary patterns and the risk of postmenopausal breast cancer. Int J Cancer 116, 116–121.
59. Nkondjock A & Ghadirian P (2005) Associated nutritional risk of breast and colon cancers: a population-based case–control study in Montreal, Canada. Cancer Lett 223, 85–91.
60. Velie EM, Schairer C, Flood A et al. (2005) Empirically derived dietary patterns and risk of postmenopausal breast cancer in a large prospective cohort study. Am J Clin Nutr 82, 1308–1319.
61. Hirose K, Matsuo K, Iwata H et al. (2007) Dietary patterns and the risk of breast cancer in Japanese women. Cancer Sci 98, 1431–1438.
62. Murtaugh MA, Sweeney C, Giuliano AR et al. (2008) Diet patterns and breast cancer risk in Hispanic and non-Hispanic white women: the Four-Corners Breast Cancer Study. Am J Clin Nutr 87, 978–984.
63. Wu AH, Yu MC, Tseng C et al. (2009) Dietary patterns and breast cancer risk in Asian American women. Am J Clin Nutr 89, 1145–1154.
64. Cottet V, Touvier M, Fournier A et al. (2009) Post-menopausal breast cancer risk and dietary patterns in the E3N-EPIC prospective cohort study. Am J Epidemiol 170, 1257–1267.
65. Ronco AL, de Stefani E, Aune D et al. (2010) Nutrient pat-terns and risk of breast cancer in Uruguay. Asian Pac J Cancer Prev 11, 519–524.
66. Edefonti V, Decarli A, La Vecchia C et al. (2008) Nutrient dietary patterns and the risk of breast and ovarian cancers. Int J Cancer 122, 609–613.
67. Link LB, Canchola AJ, Bernstein L et al. (2013) Dietary patterns and breast cancer risk in the California Teachers Study cohort. Am J Clin Nutr 98, 1524–1532.
68. Trichopoulou A, Bamia C, Lagiou P et al. (2010) Conformity to traditional Mediterranean diet and breast cancer risk in the Greek EPIC (European Prospective Investigation into Cancer and Nutrition) cohort. Am J Clin Nutr 92, 620–625. 69. Demetriou CA, Hadjisavvas A, Loizidou MA et al. (2012) The Mediterranean dietary pattern and breast cancer risk in Greek-Cypriot women: a case–control study. BMC Cancer 12, 113. 70. Buckland G, Travier N, Cottet V et al. (2013) Adherence to the Mediterranean diet and risk of breast cancer in the European prospective investigation into cancer and nutri-tion cohort study. Int J Cancer 132, 2918–2927.
71. Couto E, Sandin S, Lo M et al. (2013) Mediterranean dietary pattern and risk of breast cancer. PLoS One 8, e55374. 72. Edefonti V, Hashibe M, Ambrogi F et al. (2012) Nutrient-based
dietary patterns and the risk of head and neck cancer: a pooled analysis in the International Head and Neck Cancer Epidemiology consortium. Ann Oncol 23, 1869–1880. 73. Freedman LS, Hartman AM, Kipnis V et al. (1997)
Com-ments on: adjustment for total energy intake in epidemio-logic studies. Am J Clin Nutr 65, 1229–1231.
74. Edefonti V, Randi G, La Vecchia C et al. (2009) Dietary patterns and breast cancer: a review with focus on methodological issues. Nutr Rev 67, 297–314.
75. Albuquerque RCR, Baltar VT & Marchioni DML (2014) Breast cancer and dietary patterns: a systematic review. Nutr Rev 72, 1–17.
76. Fung TT, Rimm EB, Spiegelman D et al. (2001) Association between dietary patterns and plasma biomarkers of obesity and cardiovascular disease risk. Am J Clin Nutr 73, 61–67.
77. Jung S, Spiegelman D, Baglietto L et al. (2013) Fruit and vegetable intake and risk of breast cancer by hormone receptor status. J Natl Cancer Inst 105, 219–236.
78. Gorst-Rasmussen A, Dahm CC, Dethlefsen C et al. (2011) Gorst-Rasmussen et al. respond to‘Dietary pattern analysis’. Am J Epidemiol 173, 1109–1110.
79. Krzanowski WJ (2000) Principles of Multivariate Analysis: A User’s Perpective, 2nd ed. New York: Oxford University Press Inc.
80. Freisling H, Fahey MT, Moskal A et al. (2010) Region-specific nutrient intake patterns exhibit a geographical gradient within and between European countries. J Nutr 140, 1280–1286.
81. Slimani N & Margetts B (2009) Nutrient intakes and patterns in the EPIC cohorts from 10 European countries. Eur J Clin Nutr 63, Suppl. 4, S1–S274.