The study of social reciprocity is an important issue in experimental social psychology because it provides useful information about social dynamic in groups, specifically about mutual influence of social behaviours and its effects in aspects like health, organization dynamics and family assessment (Dabos & Rousseau, 2004; Howe & Recchia, 2005; Liang, Krause, & Bennet, 2001; Väänänen, Buunk, Kivimäki, Pentti, & Vahtera, 2005). Furthermore, studying interactions in groups instead of individual’s reactions towards artificial stimuli increases the generalizability of those studies (Warner, Kenny, & Stoto, 1979). In this field, round robin designs have widely been used in order to obtain proper social interaction data, as most group dynamics occur in round robin situations (Kenny, Mohr, & Levesque, 2001; Marcus, 1998). In round robin designs, all individuals in the group are engaged in all possible pairs, thus, it allows researchers to study the whole group and to gather dyadic interaction data (i.e., personal attraction, play
patterns or speech interactions). Round robin designs also enable researchers to study social reciprocity in groups in controlled experiments. Several examples of experiments and research focused on dyadic interactions can be found in social psychology literature. For example, classic experiments of interpersonal attraction (Friedman, 1976; Newcomb, 1967; Zelen, 1954), interpersonal perception (Albright, Kenny, & Malloy, 1988; Kenny & De Paulo, 1993; Malloy & Albright, 1990), interaction patterns in children (Hall & Cairns, 1984; Howe & Recchia, 2005; Whitley, Ward, & Snyder, 1984), and family dynamics (Cook, 2005; Cook & Kenny, 2004; Delsing, Oud, De Bruyn, & Van Aken, 2003).
Experimental social psychologists should consider some particularities when analyzing social interactions patterns that make some classical statistical tests unsuitable for it. Specifically, most researchers are interested in estimating actors, partners and relationships effects or even describing social systems at different levels (Appleby, 1983; de Vries, 1995, 1998; Hemelrijk, 1990a, b; Kenny & Judd, 1986; Kenny & La Voie, 1984; Landau, 1951; Malloy & Albright, 2001; Rapoport, 1949; Warner et al., 1979; Wasserman & Faust, 1994).
A model to decompose variance in a sociomatrix into its actor, partner and relationship effects has been proposed, the called Social Relations Model (SRM; Kenny & La Voie, 1984; Warner et al., 1979). According to that model, any dyadic variable (for
An overall statistic for testing symmetry in social interactions
David Leiva, Antonio Solanas and Lluís Salafranca
Universidad de Barcelona
The present work focuses on the skew-symmetry index as a measure of social reciprocity. This index is based on the correspondence between the amount of behaviour that individuals address toward their partners and what they receive in return. Although the skew-symmetry index enables researchers to describe social groups, statistical inferential tests are required. This study proposes an overall statistical technique for testing symmetry in experimental conditions, calculating the skew-symmetry statistic (Φ) at group level. Sampling distributions for the skew- symmetry statistic were estimated by means of a Monte Carlo simulation to allow researchers to make statistical decisions. Furthermore, this study will allow researchers to choose the optimal experimental conditions for carrying out their research, as the power of the statistical test was estimated. This statistical test could be used in experimental social psychology studies in which researchers may control the group size and the number of interactions within dyads.
Una prueba estadística global para contrastar la simetría en las interacciones sociales. Este trabajo se centra en el índice de antisimetría como medida de la reciprocidad social. Dicho índice se basa en la correspondencia entre las conductas que cada individuo dirige al resto de sus compañeros y las con-ductas que recibe de éstos. Aunque el índice de antisimetría permite a los investigadores describir los grupos, se requieren técnicas estadísticas de tipo inferencial. El principal objetivo del presente estudio es proponer una prueba estadística para contrastar la simetría, utilizando el índice de antisimetría glo-bal (Φ). Con el fin de permitir a los investigadores sociales la toma de decisiones, se ha estimado la distribución muestral del estadístico de antisimetría a través de simulación Montecarlo. Además, este estudio permite a los investigadores elegir las condiciones experimentales óptimas para llevar a cabo su investigación, puesto que se ha estimado la potencia del contraste estadístico. Esta prueba estadísti-ca puede ser utilizada en experimentos de psicología social en los que los investigadores controlen el tamaño del grupo y el número de interacciones diádicas.
Fecha recepción: 29-5-08 • Fecha aceptación: 4-6-08 Correspondencia: David Leiva
Facultad de Psicología Universidad de Barcelona 08035 Barcelona (Spain) E-mail: [email protected]
instance, attraction of individual A towards individual B) is an additive linear function of a constant parameter, the actor, partner and relationship effects. In this model, the constant parameter represents the group’s mean, the actor effect is the tendency of individuals to act, the partner effect is the tendency to elicit behaviour from the others and the relationship effect is the specific adjustment between individuals in pairs. Actor and partner effects are considered unobservable, thus, inferences are needed (Lashley & Bond, 1997). A two-way ANOVA is used in the SRM for inference purposes, thus, individuals are assumed to be random samples from a specific population in order to obtain statistical significance of individual differences, relationship effects and social reciprocity. The SRM also allows researchers to estimate generalized and dyadic reciprocity by means of correlation coefficient values (Kenny & Nasby, 1980). That is, the adjustment between actor and partner effects and the specific adjustment within dyads between actors and receivers, respectively.
Another quantification of social reciprocity has recently been proposed (Solanas, Salafranca, Riba, Sierra, & Leiva, 2006). This procedure enables researchers to describe social systems at individual, dyadic and group level. It takes into account the absolute differences among agents’ dyadic behaviours in order to compute a measure of social reciprocity. Thus, it is assumed that global phenomena depend on dyadic interactions. The method is based on partitioning a sociomatrix into its symmetrical and skew-symmetrical parts (Constantine & Gower, 1978):
where X is the original sociomatrix in which rows represent actors and columns represent receivers, X’ is the transpose of the original matrix, and S and K are the symmetrical and skew-symmetrical matrices, respectively.
Solanas et al. (2006) propose to quantify whole reciprocity in social systems by means of the symmetry index. The skew-symmetry index is computed as follows:
where X, K and n respectively denote any sociomatrix, its corresponding skew-symmetrical matrix and the number of individuals. Note that the closer is the skew-symmetry value to .5 the lowest is the social reciprocity in groups.
The skew-symmetry statistic provides experimental social psychologists with a descriptive measure that is related to the amount of dyadic reciprocity in the social system. Nevertheless, note that after analyzing the group by means of this statistical index, researchers may be interested in making statistical decisions regarding the null hypothesis of existence of complete reciprocation among individuals. For this reason we develop in this paper an overall statistical technique for testing symmetry in any social system, as it will enable social researchers to take decisions about whether or not the group under analysis presents a statistically significant skew-symmetrical pattern.
The main aim of this paper is to estimate several sampling distributions for the skew-symmetry statistic. The results will allow social researchers to associate statistical significance to the values of the skew-symmetry statistic. Simultaneously, a power analysis was carried out to give social researchers an optimal choice of experimental conditions. All estimates were obtained by means of a Monte Carlo simulation.
Method
In this simulation study, Nijdenotes the number of times that the
behaviour of interest is registered between agents i and j. Xij
represents the number of times the individual i addresses behaviour to j. In the simulation study, we supposed that the probability of the event «i addresses behaviour to j» (pij) is a constant value for every
trial during the observation period. This assumption has been established in previous studies (Adams, 2005; Boyd & Silk, 1983; Tufto, Solberg, & Ringsby, 1998). In addition, we assumed that the outcomes of successive encounters are independent during the period of time (Boyd & Silk, 1983). Therefore, the number of times that i addresses behaviour to j, Xij, is binomially distributed with
parameters Nijand pij. This probabilistic approach has been used to
model social interactions (Tufto et al. 1998). Note that if pij= pjifor
all dyads, all relationships are reciprocal. Then E(Xij)= E(Xji) and the
skew-symmetry statistic computed in samples is expected to be close to 0. Otherwise, the value of the skew-symmetry statistic will be close to .5, as a function of the lack of reciprocity among the dyads. The simulation study focused on social psychology experiments in which the behaviour of interest appears the same number of times for every dyad in the group, i.e. N = Nij = Nji. That
is, experimental social researchers are able to establish the same number of trials for each pair of individuals in the experiment. Given that behaviour is complementary in a dyad, then N= xij+ xji,
and the upper or the lower triangular matrix can be taken into account to carry out the simulation. Each experiment in the simulation can be represented as follows:
We carried out Monte Carlo simulations to estimate empirical Type I and II error rates for Φ statistic in several experimental conditions. In total, we investigated 300 experimental conditions as a result of varying three factors: group size (n), amount of behaviour for each dyad (N) and the probability associated with the event «agent i addresses behaviour to agent j» (pij).
Specifically, twelve values were established for group size (n= 3, 4, 5, 6, 7, 8, 9, 10, 15, 20, 25 and 30), five values for the total amount of behaviour (N= 5, 10, 20, 30 and 60) and five values for reciprocity levels (pij= .5, .6, .7, .8 and .9).
Small groups have often been studied in social research (Iacobucci, Neelamegham, & Hopkins, 1999; Kenny & La Voie, 1984; Kenny et al., 2001). However, it should be noted that group size can have a significant effect on accuracy estimates (Kenny & La Voie, 1984) or statistical tests (Lashley & Bond, 1997). This is the reason why we
0 0 0 0 12 13 1 12 23 2 13 23 3 1 2 3 x x x (N - x x x (N - x (N - x x (N - x (N - x (N - x n n n n n n K K K M M M O M K ) ) ) ) ) ) ⎛ ⎝ ⎜ ⎜ ⎜ ⎜ ⎜⎜ ⎞ ⎠ ⎟ ⎟ ⎟ ⎟ ⎟⎟ Φ =tr K' K
(
)
tr X' X(
)
= kij2 j=1 jπi n ∑ i=1 n ∑ xij2 j=1 jπi n ∑ i=1 n ∑ ,tr X' X(
)
> 0; 0 ≤ Φ ≤.5 X=X+ X' 2 + X− X' 2 = S + Kincluded small and large groups in the simulation study. It is also stated that an important constraint of the study of social interaction is that individuals choose their partners and it means the presence of missing observations or zero frequencies (Warner et al., 1979). The aforementioned design could be useful to avoid this problem. Some examples of this sort of experimental designs can be found in the literature, for instance, the same number of trials for each dyad has been used in: detecting dominance-submission relationships (Higby, Beulig, & Dwyer, 1991; Vervaecke, de Vries, & van Elsacker, 1999); establishing play patterns in children (Iacobucci & Wasserman, 1987); and identifying conversational styles (Warner et al., 1979).
A FORTRAN 90 program was developed to carry out the simulations, using the Salford FTN90 v2.19.1 compiler for
Windows. The NAG Release 3 libraries for Windows was used to
generate matrices under different conditions. The simulation steps were the following: a) n, N and pij were specified; b) a random
number vector was generated and each variable followed a binomial distribution with parameters N and pij; c) the third step
assigned each value of the random number vector to one location in the sociomatrix. The value was assigned to xij if a random
number following a continuous uniform distribution was greater than .5 or xjiif it was less than or equal to .5; d) the steps from b) to c) were iterated 100,000 times; e) the skew-symmetry statistic was calculated for each matrix and its empirical distributions were estimated; f) the steps from a) to e) were repeated for each experimental condition.
Table 1
Mean, standard deviation (SD) and empirical Type I error rates (α= .1, .05, .01, .005 and .001) for statistic Φ under pij= .5 and several n and N values pij= .5 n= 3 n= 4 n= 5 N 5 10 20 30 60 5 10 20 30 60 5 10 20 30 60 Mean .1553450 .0865462 .0461990 .0316882 .0162357 .1608720 .0887433 .0471331 .0319800 .0163326 .1630600 .0897321 .0471146 .0320532 .0163400 SD .0934953 .0592922 .0343694 .0242289 .0128290 .0689833 .0435290 .0249640 .0174442 .0091148 .0543309 .0342902 .0195273 .0135765 .0071160 .1 .3181820 .1573030 .0909091 .0638003 .0332975 .2647060 .1477270 .0811639 .0552834 .0286023 .2283950 .1349480 .0732159 .0502322 .0258686 .05 .3181820 .2021280 .1124260 .0791269 .0415335 .2924530 .1712710 .0936556 .0650970 .0334706 .2469880 .1525420 .0825688 .0569992 .0295450 .01 .4047620 .2574260 .1525420 .1106720 .0592335 .3181820 .2105260 .1202350 .0841248 .0444169 .2977530 .1803280 .1015270 .0706320 .0371242 .005 .4047620 .2788460 .1712710 .1222370 .0667128 .3421050 .2227980 .1304350 .0921318 .0484581 .3131870 .1909390 .1095280 .0759754 .0404094 .001 .4402990 .3181820 .2042440 .1520100 .0819449 .3852460 .2537310 .1549300 .1083220 .0577561 .3279570 .2138360 .1258740 .0883306 .0466102 n= 6 n= 7 n= 8 N 5 10 20 30 60 5 10 20 30 60 5 10 20 30 60 Mean .1641850 .0898988 .0473347 .0320656 .0163754 .1651440 .0902173 .0474233 .0321955 .0163408 .1653970 .0903837 .0474449 .0321817 .0163680 SD .0447496 .0280954 .0159415 .0111095 .0058339 .0380113 .0239561 .0135274 .0094352 .0049314 .0330771 .0208102 .0117396 .0081404 .0042640 .1 .2283950 .1279070 .0689013 .0468794 .0241434 .2117120 .1220740 .0654206 .0448757 .0228518 .2117120 .1172760 .0629183 .0429895 .0220428 .05 .2408910 .1399080 .0763547 .0519663 .0269569 .2302050 .1322310 .0712074 .0491044 .0252205 .2187500 .1260920 .0682196 .0464659 .0239746 .01 .2760620 .1629460 .0903578 .0627603 .0328127 .2563740 .1518580 .0833697 .0574506 .0298737 .2456900 .1432070 .0783410 .0537699 .0278153 .005 .2870720 .1721850 .0963855 .0669063 .0350940 .2647060 .1600000 .0877498 .0608229 .0318615 .2521370 .1494530 .0822681 .0563212 .0292758 .001 .3081180 .1900650 .1087340 .0755957 .0404435 .2886180 .1745280 .0975505 .0674956 .0358619 .2708330 .1626790 .0894309 .0625000 .0327410 n= 9 n= 10 n= 15 N 5 10 20 30 60 5 10 20 30 60 5 10 20 30 60 Mean .1657210 .0904546 .0474988 .0322201 .0163519 .1658740 .0906605 .0475542 .0321988 .0163807 .1662630 .0907314 .0475788 .0322239 .0163953 SD .0290242 .0183461 .0104048 .0071771 .0037571 .0260804 .0164200 .0093073 .0064551 .0033722 .0170736 .0107537 .0060921 .0042444 .0022069 .1 .2021280 .1150440 .0612777 .0416469 .0212959 .1975750 .1120760 .0597576 .0407390 .0208404 .1883120 .1047070 .0555006 .0377566 .0192721 .05 .2132870 .1219510 .0656631 .0448113 .0229486 .2110800 .1190290 .0636704 .0434577 .0222587 .1942910 .1089610 .0579580 .0394389 .0201669 .01 .2346940 .1371050 .0743122 .0510778 .0262960 .2283950 .1319440 .0715907 .0489386 .0251300 .2059890 .1167560 .0625000 .0428635 .0219568 .005 .2449660 .1420400 .0776326 .0534066 .0275527 .2367710 .1366080 .0744550 .0509888 .0262550 .2117120 .1197180 .0643379 .0441414 .0226800 .001 .2549670 .1533400 .0844354 .0584680 .0301724 .2489990 .1464340 .0806946 .0551512 .0286605 .2192150 .1261650 .0681576 .0471869 .0240628 n= 20 n= 25 n= 30 N 5 10 20 30 60 5 10 20 30 60 5 10 20 30 60 Mean .1664760 .0908169 .0475992 .0322687 .0163954 .1665450 .0908848 .0476084 .0322468 .0163883 .1665860 .0908911 .0475974 .0322728 .0163900 SD .0127321 .0080550 .00451784 .0031491 .0016364 .0101625 .0063893 .0036030 .0025032 .0013110 .0084110 .0052993 .0030070 .0020902 .0010810 .1 .1827250 .1012300 .0534549 .0363374 .0185218 .1797900 .0990991 .0522824 .0355076 .0180926 .1775070 .0977350 .0514817 .0349727 .0177902 .05 .1872010 .1042810 .0552434 .0375740 .0191748 .1833620 .1015810 .0536576 .0364713 .0186029 .1804820 .0996771 .0526591 .0357523 .0182064 .01 .1960050 .1099870 .0586137 .0400162 .0204166 .1904150 .1061850 .0563664 .0383245 .0195918 .1863680 .1036840 .0548410 .0372982 .0190232 .005 .2003370 .1123150 .0599179 .0409207 .0208709 .1932010 .1078860 .0573449 .0389817 .0199601 .1887960 .1050860 .0556412 .0379039 .0193058 .001 .2067470 .1169360 .0627929 .0430033 .0218622 .1987180 .1114800 .0593842 .0402389 .0206995 .1931300 .1077290 .0572580 .0391789 .0199392
This intensive computer simulation experiment allowed us to estimate sampling distributions for the skew-symmetry statistic. We established the following statistical significance levels for studying empirical Type I error rates: .1, .05, .01, .005 and .001. Furthermore, we investigated the power of the statistical test under the null hypothesis, which states that dyadic relations are symmetrical among all individuals (pij= .5). The following
expression shows this null hypothesis:
H0: pij= pji; i, j= 1,2,3,…, n; i 0 and i<j
In order to estimate statistical power (1–β), we obtained each Φ value for specific α, n, N and pij= .5. Then, we compared Φ values
with the empirical distributions for the statistic under the other values of pij, keeping the values of α, n and N constant. Statistical
power was computed as the proportion of values as large as or larger than the Φ value under the null hypothesis.
Results
Regarding sampling distributions under the null hypothesis of complete reciprocation, table 1 shows the skew-symmetry
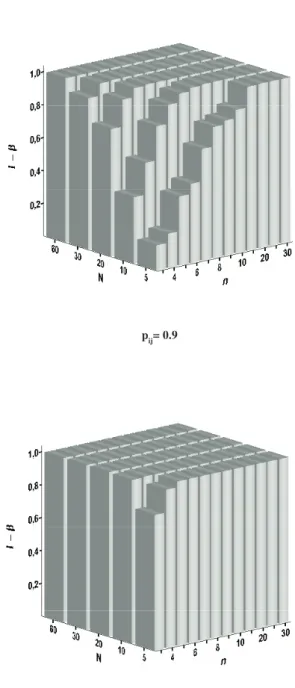
Figure 1. Statistical power (1-β) under α= .05 and several values of n, N and pij
pij= 0.6
pij= 0.8
pij= 0.7
statistic’s average and its standard deviation for all experimental conditions. The mean value of the statistic depends on the number of individuals (n), while its standard deviation decreases with the amount of behaviour per dyad and the group size (N and n). Table 1 also shows the most common statistical significance values for rejecting the null hypothesis. These estimated values (α= .1, .05, .01, .005 and .001) are provided for the sixty experimental conditions that were investigated under the assumption of complete social reciprocity (pij= pji= .5 for all dyads).
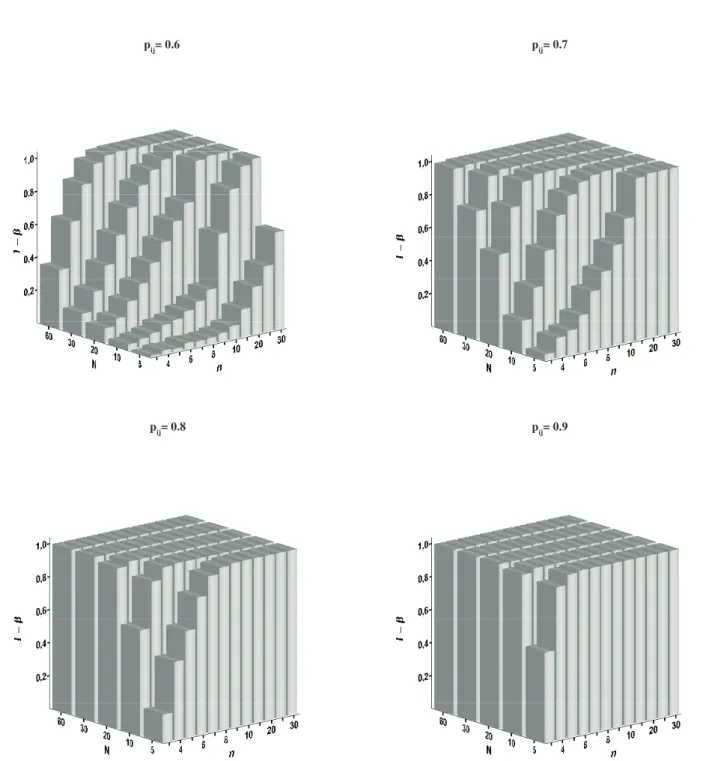
Figures 1 and 2 show the corresponding results of power analyses for different values of n, N and α. In general, the statistical test is
powerful enough, as it shows acceptable empirical Type II error rates. The best results corresponds to α= .05 and α= .01, as both values of α represent the best balance between Type I and II error rates, taking into account the common values of n and N in social research. In fact, the power of the statistical test for the aforementioned values of α is almost equal to .8 for n= 6, N= 10 and pij= .7.
Discussion
An overall index for quantifying the skew-symmetry in social interactions at group level has previously been proposed (Solanas
Figure 2. Statistical power (1-β) under α= .01 and several values of n, N and pij
pij= 0.6
pij= 0.8
pij= 0.7
et al., 2006). This allows social researchers to quantify social reciprocity. However, in social interaction studies it is also required a procedure not only to describe groups as a whole but also to make statistical decisions. We have studied social interactions at group level, data being summed over a period, for instance, as it is common in social psychology experiments in which a group is studied for several experimental sessions.
The skew-symmetry statistical test has some advantages over the other techniques that have been proposed for analysing social systems. Most importantly, it enables social reciprocity to be analysed without any loss of information as occurs when the linear index of hierarchy, which was develop by Rapoport (1949) and Landau (1951), is computed. Moreover, the skew-symmetry statistic can be useful in studies in which researchers are interested in analysing absolute differences in behaviour, instead of calculating any association coefficient as a measure of social reciprocity (Hemelrijk 1990a, b; Warner et al., 1979). The main difference between skew-symmetry index and the measures obtained by the SRM model is that the skew-symmetry index focuses on the differences within dyads (xij- xji for all possible
pairs in the group) in order to obtain a quantification of social reciprocity, and the second one decomposes the total variance in several effects in order to obtain two association coefficients as measures of social reciprocity. Furthermore, the skew-symmetry index allows researchers to describe groups at individual, dyadic and group level. In other words, researchers can know the most reciprocal individual, which dyad is more reciprocal and the overall social reciprocity level.
The results of the simulation study enable researchers to obtain statistical significance for several values of the skew-symmetry statistic, at least for some common conditions in experimental social research. This was achieved by estimating empirical Type I error rates. The statistical power of the statistical test was studied to determine the optimal conditions in which the statistical test should be applied. Our results show that the statistical test is powerful enough for these common conditions in experimental social research. The test is sensitive to moderate discrepancies from overall social reciprocity, as pij= .7 represents a social system
that is relatively close to reciprocation. Furthermore, the test is powerful enough in not extremely large conditions, for instance, when studying groups of six individuals and ten behaviours per dyad, which is feasible in experimental social psychology studies.
We have studied the skew-symmetry statistical test for experimental conditions in which researchers are able to establish the number of encounters per dyad. In fact, the number of encounters per dyad has to be equal for each pair of individuals. This is the main constraint of the present study: its results are applicable to experimental settings or observational studies in which researchers can establish an equal number of encounters per dyad. Therefore, our results are not useful if researchers are not able to establish a constant number of encounters per dyad. However, researchers may be interested in observing a constant number of encounters per dyad and analysing reciprocity in experimental social psychology laboratories. Although the observation period until registering the specified number of encounters per dyad will likely vary among dyads, the skew-symmetry statistical test should be applied if one could assume that pijvalues remain constant during the observation period.
To sum up, our work enables social researchers to make statistical decisions about social reciprocity in experiments regarding aspects like interpersonal perception, group dynamics, interpersonal attraction, and communication since we have estimated the associated statistical significance to skew-symmetry statistic values for some conditions in social research. This allows researchers to test the null hypothesis that assumes complete reciprocity among individuals in a social system. If the null hypothesis is rejected, social researchers will have some evidence indicating that social systems are skew-symmetrical. The present study also enables researchers to make decisions about the optimal experimental conditions, as empirical Type I and II error rates for the statistical test have been estimated. Given that most social research is carried out in natural settings, future research is needed to develop a statistical method for testing social reciprocity in a wider set of conditions. Specifically, the amount of behaviour per dyad should not be restricted to an equal number for each dyad.
Acknowledgements
We thank Carles Riba for his comments on the manuscript. This research was partially supported by the Ministerio de Educación y Ciencia, grant SEJ2005-07310-C02-01/PSIC and by the Departament d’Universitats, Recerca i Societat de la Informació, Generalitat de Catalunya, grants 2005SGR00098 and
2007FIC00747.
References
Adams, E.S. (2005). Bayesian analysis of linear dominance hierarchies. Animal Behaviour, 69, 1191-1201.
Albright, L., Kenny, D.A., & Malloy, T.E. (1988). Consensus in personality judgements at zero acquaintance. Journal of Personality and Social Psychology, 55, 387-395.
Appleby, M.C. (1983). The probability of linearity in hierarchies. Animal Behaviour, 31, 600-608.
Boyd, R., & Silk, J.B. (1983). A method for assigning cardinal dominance ranks. Animal Behaviour, 31, 45-58.
Constantine, A.G., & Gower, J.C. (1978). Graphical representation of asymmetric matrices. Applied Statistics, 27, 297-304.
Cook, W.L. (2005). The SRM approach to family assessment. An intro-duction and case example. European Journal of Psychological Assess-ment, 21, 216-225.
Cook, W.L., & Kenny, D.A. (2004). Application of the social relations model to family assessment. Journal of Family Psychology, 18, 361-371. Dabos, G.E., & Rousseau, D.M. (2004). Mutuality and reciprocity in the psychological contracts of employees and employers. Journal of Ap-plied Psychology, 89, 52-72.
Delsing, M.J.M.H., Oud, J.H.L., De Bruyn, E.E.J., & Van Aken, M.A.G. (2003). Current and recollected perceptions of family relationships: The social relations model approach to members of three generations. Journal of Family Psychology, 17, 445-459.
de Vries, H. (1995). An improved test of linearity in dominance hierar-chies containing unknown or tied relationships. Animal Behaviour, 50, 1375-1389.
de Vries, H. (1998). Finding a dominance order most consistent with a linear hierarchy: A new procedure and review. Animal Behaviour, 55, 827-843.
Friedman, H.S. (1976). Effects of self-esteem and expected duration of interaction on liking for a highly rewarding partner. Journal of Personality and Social Psychology, 33, 686-690.
Hall, W.M., & Cairns, R.B. (1984). Aggressive behavior in children: An outcome of modelling or social reciprocity? Developmental Psycholo-gy, 20, 739-745.
Hemelrijk, C.K. (1990a). A matrix partial correlation test used in investigations of reciprocity and other social interaction patterns at group level. Journal of Theoretical Biology, 143, 405-420.
Hemelrijk, C.K. (1990b). Models of, and tests for, reciprocity, unidirec-tionality and other social interaction patterns at a group level. Animal Behaviour, 39, 1013-1029.
Higby, M., Beulig, A., & Dwyer, J. (1991). Exogenous testosterone and so-cial experience each enhance the development of agressive behavior in Cyprinodon variegatus. Agressive Behavior, 17, 229-239.
Howe, N., & Recchia, H. (2005). Playmates and teachers: Reciprocal and complementary interactions between siblings. Journal of Family Psy-chology, 19, 497-502.
Iacobucci, D., & Wasserman, S. (1987). Dyadic social interactions. Psy-chological Bulletin, 102, 293-306.
Iacobucci, D., Neelamegham, R., & Hopkins, N. (1999). Measurement quality issues in dyadic models of relationships. Social Networks, 21, 211-237.
Kenny, D.A., & De Paulo, B.M. (1993). Do people know how others view them? An empirical and theoretical account. Psychological Bulletin, 114, 145-161.
Kenny, D.A., & Judd, C.M. (1986). Consequences of violating the inde-pendence assumption in analysis of variance. Psychological Bulletin, 99, 422-431.
Kenny, D.A., & La Voie, L.J. (1984). The social relations model. In L. Berkovitz (Ed.): Advances in experimental psychology (vol. 18, pp. 142-182). San Diego, CA: Academic Press.
Kenny, D.A., Mohr, C.D., & Levesque, M.J. (2001). A social relations variance partitioning of dyadic behavior. Psychological Bulletin, 127, 128-141.
Kenny, D.A., & Nasby, W. (1980). Splitting the reciprocity correlation. Journal of Personality and Social Psychology, 38, 249-256.
Landau, H.G. (1951). On dominance relations and the structure of animal societies: I. Effect of inherent characteristics. Bulletin of Mathematical Biophysics, 13, 1-19.
Lashley, R.B., & Bond, C.F. Jr. (1997). Significance testing for round robin data. Psychological Methods, 2, 278-291.
Liang, J., Krause, N.M., & Bennett, J.M. (2001). Social exchange and well-being: Is giving better than receiving? Psychology and Aging, 16, 511-523.
Malloy, T.E., & Albright, L. (1990). Interpersonal perception in a social context. Journal of Personality and Social Psychology, 58, 419-428. Malloy, T.E., & Albright, L. (2001). Multiple and single interaction dyadic
research designs: Conceptual and analytic issues. Basic and Applied Social Psychology, 23, 1-19.
Marcus, D.K. (1998). Studying group dynamics with the Social Relations Model. Group dynamics: Theory, Research and Practice, 2, 230-240. Newcomb, T.M. (1956). The prediction of interpersonal attraction.
Ameri-can Psychologist, 11, 575-586.
Rapoport, A. (1949). Outline of a probabilistic approach to animal sociology: I. Bulletin of Mathematical Biophysics, 11, 183-191. Solanas, A., Salafranca, Ll., Riba, C., Sierra, V., & Leiva, D. (2006).
Quan-tifying social asymmetric structures. Behavior Research Methods, 38, 390-399.
Tufto, J., Solberg, E.J., & Ringsby, T. (1998). Statistical models of transi-tive and intransitransi-tive dominance structures. Animal Behaviour, 55, 1489-1498.
Väänänen, A., Buunk, B.P., Kivimäki, M., Pentti, J., & Vahtera, J. (2005). When it is better to give than to receive: Long-term health effects of perceived reciprocity in support exchange. Journal of Personality and Social Psychology, 89, 176-193.
Vervaecke, H., de Vries, H., & van Elsacker, L. (1999). An experimental evaluation of the consistency of competitive ability and agonistic dominance in different social contexts in captive bonobos. Behaviour, 136, 423-442.
Warner, R.M, Kenny, D.A., & Stoto, M. (1979). A new round-robin analy-sis of variance for social interaction data. Journal of Personality and Social Psychology, 37, 1742-1757.
Wasserman, S., & Faust, K. (1994). Social network analysis: Methods and applications. Cambridge: Cambridge University Press.
Whitley, B.E., Ward, J., & Snyder, H.N. (1984). Peer preferences in a de-segregated school: A round robin analysis. Journal of Personality and Social Psychology, 46, 799-810.
Zelen, S.L. (1954). Acceptance and acceptability: An examination of so-cial reciprocity. Journal of Consulting Psychology, 18, 316.