A NEW EXTENSION OF DYNAMIC SIMPLEX MODEL
FOR THE PUBLIC TRANSPORT CUSTOMER SATISFACTION C. Bernini, A. Lubisco1
1.INTRODUCTION
In the last decades, the aim to reduce car traffic and the need of saving time and money to travel has yielded a rapid growth of urban public transportation. Travel companies and public administrations have shown an increasing interest in understanding what determines individual travel mode choices, which are the in-dividual preferences and expectations about the urban transport and if all these factors change over time. In this context, the Customer Satisfaction analysis as-sumes a fundamental role in defining and programming business strategies, be-cause it allows to analyze customer expectations and overall satisfaction and to evaluate the quality of services supplied by travel companies (Golob, 2003; Thögersen, 2001; Cagnone et al., 2003). The dynamic version of Customer Satis-faction analysis turns out to be particularly useful for monitoring both customer satisfaction over time and customer behaviour reaction to company strategies, and therefore for measuring their effectiveness and efficiency.
In this paper we address the following questions that are becoming increas-ingly important for public transport service managers: does the level of customer satisfaction change over time? If yes, which factors might explain these differ-ences? Does customer expectation about the travel influence the overall satisfac-tion over time? In order to answer to these quessatisfac-tions, we propose an extended dynamic version of LISREL model and we evaluate the performance of this ex-tended model on an empirical data set obtained from a Customer Satisfaction Survey, that was carried out by the Faculty of Statistical Sciences for the TRAM Agency of public transport in Rimini in the period from 2000 to 2004.
Overall satisfaction is an abstract construct that summarizes customer experiences whit respect to consumption or purchase of products or services. In this sense it is not directly measurable and it can be interpreted as a latent variable (Steenkamp and Baumgartner, 2000). To model latent variable, we propose to use the Structural Equation Modelling approach and in particular the LISREL model (Jöreskog, 1970).
1 All the work was discussed and agreed by both authors. Cristina Bernini wrote sections 1, 2, 4, 5 and 7; Alessandro Lubisco wrote sections 3 and 6.
LISREL allows to analyze the relationship between public transport overall satisfac-tion and its determinants because of it explicitly accounts for the measurement error when the latent variable of interest is represented by multiple manifest variables, such as the overall satisfaction of TRAM customers. This approach also allows to determine whether the hypothesized model gives an acceptable representation of the analyzed data. As regards dynamic Customer Satisfaction model, we propose an ex-tended version of the traditional SIMPLEX Model (Jöreskog, 1970, 1979, 2001). The dynamic is introduced in the structural part of the model by supposing an AR(1) process for endogenous latent variables and by assuming that exogenous la-tent variables at time t affect endogenous lala-tent variables at time t.
The dynamic analysis requires the use of panel data but unfortunately surveys repeated over time on the same customers are not usual. More frequently, the data are collected from Independent Repeated Surveys (IRS), in which different samples of customers from the same population are observed in several time oc-casions. The application of the average cohort techniques on IRS data leads to the so called pseudo-panel: the use of variables that do not change over time (for example the year of birth of the customers) let us both to define groups of homogenous individuals and to follow them as a panel (Deaton, 1985; Browing et al., 1985). In this research, 65 cohorts of TRAM customers are considered and analysed with respect to their habits and evaluations towards public transport.
The work is developed in the following steps: firstly the theoretical framework for the analysis of the Customer Satisfaction in public transport is discussed, and the main hypotheses for the model specification are presented. Then data collec-tion and some descriptive statistics are analysed. The average cohort technique and the specification of the dynamic LISREL model are presented in Section 4 and Section 5, respectively. In the last sections, model estimates, some economic results and future research developments are discussed.
2. THE CONCEPTUAL MODEL AND RESEARCH HYPOTHESES
The TRAM, the Public Transport Agency in Rimini (Italy), has been very in-terested in its own customer needs. Through Customer Satisfaction surveys, the Agency aims at evaluating the perceived quality of its public services in the prov-ince of Rimini, the level of customer satisfaction and loyalty and how these fea-tures change over time. The dynamic measure of the quality and the identification of the customer needs and expectations concur to evaluate the effectiveness of the Agency business strategies and to identify the customer requirements, such as modification of existing services or introduction of new services.
The aim is to analyse customer satisfaction over time in order to increase the public transport choice. In this context, the identification of the determinants influ-encing public transport mode choice becomes relevant. To this goal we propose a conceptual model which guides the following research. The model extends and in-tegrates several research streams on public transport field. The first and simplest distinction between types of determinants influencing travel mode choices is be-tween external conditions and individual traveller characteristics. Travel mode depends on
the availability of a public transport alternative for destination and time, on the lo-cations of shops, jobs, and homes and on the transport infrastructure. Environ-ment conditions, such as road construction and weather, have also been shown to influence the choice of travel mode. Among individual characteristics that influence travel mode choices there are age, gender, attitudes, income and habits (Jakobsson
et al. 2002; Fujii et al. 2001; Gärling et al.; 2001). There is empirical evidence that the
travel mode choice depends on individual age and there are also arguments that us-ing public transport tends to become habitual. In particular, travel mode choice is dynamic: determinants are influenced by (past) behaviour. Thus habits are the result of performing the same behaviour frequently and in a stable context; behaviour may also lead to change in attitudes and in perceived control due to experience-based learning, self-inferences and cognitive dissonance.
Psychologists and marketing researchers also distinguish between volitional and
non-volitional determinants of behaviour (Bagozzi and Warshaw 1990; Bagozzi 1994;
Peter et al. 1999). External conditions are considered non-volitional, such as some of the individual characteristics (habits and individual characteristics). Another non-volitional individual characteristic that has been found to influence travel mode choices is the knowledge of public transport services such as routes, time-tables, ticket price, and so on.
The focus in this paper is limited to determinants that have been found to have a fairly direct influence on public transport choice. Consistent with the outlined conceptual framework, the study is based on the assumption that public transport choices are partly volitional (influenced by the traveller satisfaction and expecta-tion) and partly determined by non-volitional individual characteristics (transport services, habits, age, etc.). Therefore travel mode choices are based on some co-determinants: the traveller evaluation (about travel characteristics), personal abili-ties (expectations, habits) and individual characteristics (age).
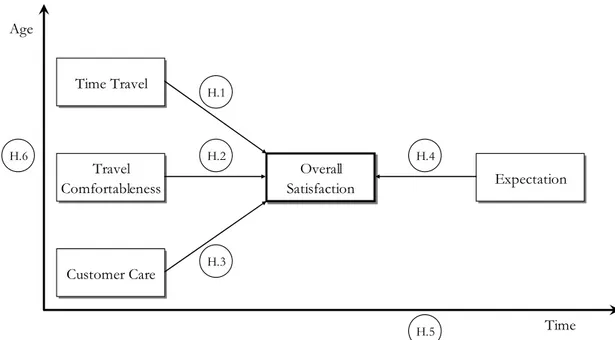
In this framework, our conceptual model considers time travel evaluation, travel comfortableness evaluation, customer care evaluation, overall satisfaction and expectations on public transport services as separate constructs over time and over age (Figure 1). The proposed relationships among these constructs are presented in the following hypotheses:
H.1. the greater the extent of satisfaction with time travel, the higher the level of overall satisfaction
H.2. the greater the extent of satisfaction with comfortableness travel, the higher overall satisfaction
H.3. the greater the extent of satisfaction with customer care, the higher the level of overall satisfaction
H.4. the expectation on public transport services positively affects the overall satisfaction
H.5.1 the overall satisfaction changes over time
H.5.2 the influence of time travel, travel comfortableness, customer care and expectation on the overall satisfaction change over time
H.6. the overall satisfaction changes with respect to age and therefore over life cycle.
Time Travel Travel Comfortableness Customer Care Overall Satisfaction Expectation H.1 H.2 H.3 H.4 H.6 H.5 Age Time
Figure 1 – Public transport conceptual model of Customer Satisfaction.
3. DATA
Since 1996 TRAM has been carrying out a biennial survey to evaluate habits and satisfaction of its customers. Since 2000 the Faculty of Statistical Sciences of the Bologna University has been involving in it, defining the sampling design, the questionnaire and the interview procedures. In the following, we present the main features of the survey.
3.1. The data collection procedure
The population of interest consists of urban transport customers who choose the bus to move in the province of Rimini, for different reason. The sampling de-sign is based on a stratification with respect to several characteristics of transport services (bus-routes, time bands, days) and service typology (urban, suburban).
One thousand questionnaires are administrated to customers, randomly cho-sen, by mean of a “face to face” technique on the bus during the trip. The surveys are conducted in the 2nd week of December.
3.2. The questionnaire
The questionnaire is composed of four main sections: “Evaluations”, “Judg-ments”, “Habits” and “Personal data”.
The “Evaluations” section starts with a questions to pick out the most impor-tant reason of that particular trip. The main part of this section includes 15 items representing various aspects of the service, such as Bus frequency and speed, Travel comfort and safety, Information and Tickets availability, Ticket price,
Ser-vices for disabled people, Care of environment, Driver kindness. For each item, we asked people to give a score, expressed in terms of satisfaction and impor-tance, using a Likert scale from 1 to 10. We also asked an evaluation of global sat-isfaction, always with a 1 to 10 scale.
In the “Judgment” section, all respondents were asked to give an evaluation on the expectation, in order to understand if the service was better, worse or equal to what they expected to have. Furthermore, people answered two questions to pick out the best and the worst aspect of the trip.
“Habits” section has the goal to observe the characteristics of TRAM custom-ers for what concerns how and why they use the urban transport service to move. We asked which is the “usual” way the respondent uses to move, choosing be-tween bus, car, motorcycle or bicycle, how many times per week he “usually” takes the bus, which kind of ticket he owns and where he buys it. In this section, the most important question concerns the principal reason for which they “usu-ally” use the bus. This question helps us to distinguish between what we called “forced” and “unforced” customers.
In the “Personal data” section we collected information on age, gender, na-tionality, residence, educational degree and occupation. We asked also if the re-spondent had a driving licence.
3.3. Data description
Table 1 summarizes the variables used in our analysis, their operationalizations, and their mean values for the samples in 2000, 2002 and 2004 respectively. Ta-ble 1 also shows (in brackets) the standard deviations. The analysis of the Mean Satisfaction Index (MSI), calculated for each year as the average of the Satisfac-tion scores given by the respondents for all the 15 items, shows a progressive in-crease in the quality of the transport service aspects considered over time (Fig-ure 2). In fact, the MSI passes from a scarcely sufficient value of 6.51 in year 2000, to values of 7.52 and 7.88 in 2002 and 2004, respectively. The positive trend is also confirmed by considering each item separately, where is evident that the average of the Satisfaction scores in 2004 are clearly higher than in 2000. Even better is the growth of the Global Satisfaction Index (GSI), calculated for each year as the average of the Global Satisfaction scores on all the respondents. The GSI passes from 5.89 in 2000, a level lower than the sufficiency threshold, to 8.06 and 8.39, respectively in 2002 and 2004.
Satisfaction indices show a positive trend in the global service quality supplied by the agency. Also Importance Indices turn out to change over time: customers have modified not only their level of satisfaction, but also the priorities given to the various aspects of the service, as we can see in the Impact Matrix.
The Impact Matrix is a tool that helps in understanding which items seem to be critical in affecting the overall satisfaction. The Impact Matrix is a scatter plot in which the two dimensions are Importance (axis of abscissas) and Satisfaction (axis of ordinates). The four quadrants of this Cartesian system are named “Suc-cess Area”, “Maintenance Area”, “Indifference Area” and “Improvement Area”.
Each item is placed at the coordinates corresponding to the average of its scores for Importance and Satisfaction. For example, an item placed in the “Success Area” has high average scores both for Importance and Satisfaction, while, if it is positioned in the “Indifference Area”, it has low levels for both the dimensions. The “Improvement Area” is intended as a critical one. The items in this area have high Importance but low Satisfaction, indicating that the actions to improve the quality must be concentrated especially on these aspects of the service.
TABLE 1
Items descriptions, mean values and standard errors (in brackets)
Figure 3 shows the positions of the items in 2002 (in bold) and 2004 (italic), linked by an arrow. It appears that almost all the arrows point towards the right side of the diagram, meaning that in 2004 the level of satisfaction increased for all the items, except for “Travellers Safety”, “Drivers kindness” and “Customer Care”. It appears, also, that the level of importance changed from 2002 to 2004. In fact, some items in 2004 are in a different “Area” with respect to 2002. “Ticket Availability” moved from the “Maintenance Area” to the “Success Area”, while
Item Operationalization 2000 2002 2004
Convenience Bus-Routes and Stops Convenience 6.97 (1.43)
8.27 (1.21)
8.35 (0.76)
Punctuality Bus Punctuality 6.67
(1.24)
6.83 (1.52)
7.69 (0.93)
Frequency Bus Frequency 6.78
(1.30)
7.26 (1.36)
7.61 (1.05)
Speed Transfer Speed 7.18
(1.03)
7.51 (1.20)
8.26 (0.81)
Cleanliness Bus Cleanliness 6.32
(1.29)
8.04 (1.20)
7.96 (0.89) Comfort Travel Comfort: Seats, Crowding,
Air-Conditioning, 6.01 (1.39) 7.95 (1.16) 8.01 (0.87) Safety Travellers Personal and Property Safety 6.96
(1.13)
8.41 (1.14)
8.23 (0.81)
Drivers Drivers Kindness 7.49
(1.07)
8.82 (0.94)
8.33 (1.04) Bus Shelters Bus Shelters: Visibility, Comfort, Informations 4.95
(1.44)
6.42 (1.24)
7.48 (0.86)
Handicap Services for Disabled People 4.51
(1.42)
6.55 (1.65)
6.52 (1.26) Info Information availability: Bus-Routes, Timetable,
Prices 6.86 (1.38) 8.21 (1.22) 8.46 (0.94)
Ticket Price Ticket Price 6.43
(1.51)
6.39 (1.27)
7.44 (1.13) Customer Care Customer Care: Complaints, Suggestions, Requests 6.94
(1.21)
6.18 (1.17)
7.57 (1.13) Tickets Availability Tickets Availability 7.76
(0.97)
8.69 (0.95)
8.85 (0.69) Environment Care of Environment: Ecological Vehicles, Air and
Noise Pollution 5.90 (1.32) 7.31 (1.68) 7.38 (1.10)
Mean Satisfaction Index 6.51
(1.53)
7.52 (1.64)
7.88 (1.11)
Global Satisfaction Index 5.89
(0.81)
8.06 (1.11)
8.39 (0.73)
6,51 7,88 7,52 8,39 8,06 5,89 0,0 1,0 2,0 3,0 4,0 5,0 6,0 7,0 8,0 9,0 2000 2002 2004
Mean Satisfaction Index Global Satisfaction Index
Figure 2 – The Mean Satisfaction Index and the Global Satisfaction Index (2000-2004).
IMPROVEMENT Area SUCCESS Area
MAINTENANCE Area INDIFFERENCE Area Satisfaction Importance 8.4 8.6 8.8 9.0 9.2 9.4 9.6 9.8 5.8 6.3 6.8 7.3 7.8 8.3 8.8 Price Handicap Shelt Cust Punct Freq Env Speed Comf Clean Info Conv TickAv Safety Drivers Price Handicap Shelt Cust Punct Freq Speed Comf Info Safety Drivers Env Clean Conv TickAv Price Handicap Shelt Cust Punct Freq Env Speed Comf Clean Info Conv TickAv Safety Drivers Price Handicap Shelt Cust Punct Freq Speed Comf Info Safety Drivers Env Clean Conv TickAv
Figure 3 – The IMPACT MATRIX in 2002 (bold) and 2004 (italic).
“Bus Cleanliness”, “Bus-routes Convenience” and “Driver Kindness” covered the opposite way. “Ticket Price” becomes a critical aspect positioning itself in the “Improvement Area”: satisfaction for this item increased, but not enough to move it in the “Success Area”. Instead, the importance for the item “Bus Fre-quency” decreased letting it move from the “Improvement Area” to the
“Indif-ference Area”. Also “Travel Comfort” moved away from the “Improvement Area” going in the “Maintenance Area” thanks to the growth of the level of satis-faction for this item together with the reduction of importance. “Travellers Safety” maintained its position in the “Success Area”, as well as “Bus Shelters” and “Customer care” in the “Indifference Area” and “Services for Disabled Peo-ple” together with “Care of Environment” and “Punctuality” in the “Improve-ment Area”.
The Impact Matrix gives some preliminary indications about the changing in customer satisfaction over time. The interest is focused on the following questions: Which are the item dynamics? Which are the aspects of the service that determine the overall satisfaction dynamics? To answer to these questions we specify and estimate a dynamic version of the LISREL model on pseudo-panel data.
4. DOES CUSTOMER SATISFACTION CHANGE OVER AGE?
Empirical evidence suggests that customer satisfaction changes with respect to customer age, and this represents an interesting feature in our analysis. In fact, if this is true, it is possible to use the economic framework of life cycle model and the statistical technique of average cohort to specify and estimate a dynamic model, overcoming the lack of panel data.
The average cohort technique, introduced by Deaton (1985) e Browing et al. (1985), has received a wide consent in theoretical and empirical economic litera-ture. This technique finds its origin in the life cycle model (Modigliani and Brum-berg, 1954) that uses the analysis of individual consumption behaviour to inter-pret aggregate consumption dynamics. The analysis of a single consumer behav-iour over his life concurs to explore relations among preferences, decisions, socio-demographic characteristics and their changes in time.
Macroeconomic data for estimating and verifying microeconomic behavioural models are of common use in literature. Assumption guarantying the correct use of macroeconomic models instead of micromodels are generally based on the
rep-resentative agent hypothesis. This hypothesis becomes unrealistic when used for
phe-nomena, such as consumption or satisfaction, that vary among agents and over time. Data allowing to better analyse individual behaviours or preferences over life are time series of observations on the same individuals, as panel data. Cus-tomer surveys usually offer single cross-section surveys repeated in time. Hence in order to analyse customer satisfaction, it is necessary to assume that changes in time are represented by cross-section variations. This solution introduces restric-tive hypotheses. Another methodologically correct solution exists. If time series of independent cross-section surveys (IRS) are available, it is possible to construct pseudo-panel data useful for estimating cohort behavioural models (Browing et
al., 1985; Deaton, 1985).
With IRS a customer is observed only at one occasion. However, independent customer samples, extracted from equivalent populations that have in common
one or more characteristics invariant in time, are available for successive surveys. Suppose the characteristic is the date of birth. In survey at time t, a subsample of customers of ages a, belonging to cohort c, is observed. In the year t+1, the pro-cedure is repeated and customers of age a+1 are observed; in the year t+2, cus-tomers of age a+2, always belonging to cohort c, are observed and so on for the following surveys. This technique allows to reproduce and observe customer quality evaluation following a cohort through its individuals. If subsamples are sufficiently large, sample means can be considered as representative of cohort in-dividual behaviour. Hence, they can be analysed as if they were a panel. Average cohort technique allows the analysis of the behaviour of individuals having in common the year of birth, with respect to all satisfaction, economic and demo-graphic variables.
This methodology proposed by Deaton uses, as cohort representative values, the mean values of each variable calculated on units belonging to the cohort for every time occasions. Repeating this procedure for all cohorts and linking these data, it is possible to reproduce satisfaction during customer life-cycle, as if we had panel data. Hence, cohort analysis allows to analyse age and cohort effects and to specify models useful for the analysis of individual behaviour over their life.
TRAM surveys are IRS and therefore they can be used to construct pseudo panel data and to estimate dynamic models of satisfaction by cohort average technique. Customers are grouped in 65 cohorts, defined with respect to their year of birth, excluded those born before 1920 and after 1984. Cohort representa-tive values are the mean values of variables calculated on customers belonging to that cohort in each time period. Repeating for all the cohorts and linking them, satisfaction data over customer life-cycle are obtained. The use of a synthetic measure, such as the mean, for ordinal variables is largely discussed in the litera-ture: the most commonly solution consists in treating measures in an ordinal scale as they were on an interval scale. This hypothesis is justified in presence of 10 scores (Zanella, 2001).
Average cohort technique allows to construct age satisfaction profiles, useful for analysing quality evaluation over customer age and time. Satisfaction has an increasing age profile: satisfaction grows slowly in initial phases of life-cycle and peaks its maximum value in correspondence to older age (Figure 4).
The analysis of the global satisfaction and the single item satisfaction shows that quality evaluation change over customer age and therefore the life cycle model and the average cohort technique can usefully used to explore the dynam-ics in the quality evaluation of the public transport by the Extended SIMPLEX model proposed in the next paragraph.
5 6 7 8 9 10 19 84 19 79 19 74 19 69 19 64 19 59 19 54 19 49 19 44 19 39 19 34 19 29 19 24 GSI 2000 5 6 7 8 9 10 19 8 4 19 7 9 19 7 4 19 6 9 19 6 4 19 5 9 19 5 4 19 4 9 19 4 4 19 3 9 19 3 4 19 2 9 19 2 4 GSI 2002 5 6 7 8 9 10 19 8 4 19 7 9 19 7 4 19 6 9 19 6 4 19 5 9 19 5 4 19 4 9 19 4 4 19 3 9 19 3 4 19 2 9 19 2 4 GSI 2004 5 6 7 8 9 10 19 84 19 79 19 74 19 69 19 64 19 59 19 54 19 49 19 44 19 39 19 34 19 29 19 24 MSI 2000 5 6 7 8 9 10 19 84 19 79 19 74 19 69 19 64 19 59 19 54 19 49 19 44 19 39 19 34 19 29 19 24 MSI 2002 5 6 7 8 9 10 19 8 4 19 7 9 19 7 4 19 6 9 19 6 4 19 5 9 19 5 4 19 4 9 19 4 4 19 3 9 19 3 4 19 2 9 19 2 4 MSI 2004
Figure 4 – The profiles of Global Satisfaction Index (GSI) and Mean Satisfaction Index (MSI) over age in 2000, 2002 and 2004.
5. A NEW EXTENDED DYNAMIC VERSION OF LISREL MODEL
In order to evaluate the main factors influencing the TRAM customers overall satisfaction and its dynamic over time, the LISREL approach is used (Jöreskog, 1970). The traditional LISREL model considers random vectors Ƨ' = (Ƨ1,Ƨ2, ..., Ƨm)
and Ʈ' = (Ʈ1,Ʈ2, ..., Ʈn) of endogenous and exogenous latent variables, respectively,
and the following system of linear structural relations
Ƨ = ƃƧ + ƄƮ + Ʀ (1)
where ƃ and Ƅ are coefficient matrices of dimensions (mxm) and (mxn) respec-tively and Ʀ' = (Ʀ1,Ʀ2, ..., Ʀm) is a random vector of residuals. Without loss of
gen-erality it may be assumed that E(Ƨ) = 0, E(Ʈ) = 0, E(Ʀ) =0, Ʀ is uncorrelated with
The vectors Ƨ and Ʈ are not observed while vectors y' = (y1, y2, ..., yp) and x' = (x1, x2, ..., xq) are observed, such that
y = ƌyƧ + ƥ (2)
x = ƌxƮ + Ƥ (3)
where ƥ and Ƥ are vectors of measurement errors in y and x, respectively; both y and x are assumed to be measured as deviations from their means. The matrices
ƌyand ƌxare (pxm) and (qxn) loading matrices of y on Ƨ and of x on Ʈ,
respec-tively. It is convenient to refer to y and x as the observed variables and Ƨ and Ʈ as the latent variables. The error of measurement are assumed to be uncorrelated with the latent variables.
The structural-equation part of the general model, as given in equation (1), speci-fies the casual relationships among the latent variables; this is used to describe and assess the causal effects and to estimate the amount of unexplained variance in the dependent variables. The measurement model part of the general model, as given by equations (2) and (3), specifies how the latent variables are measured in terms of the observed variables; this is used to describe the measurement proper-ties (reliabiliproper-ties and validiproper-ties) of the observed variables.
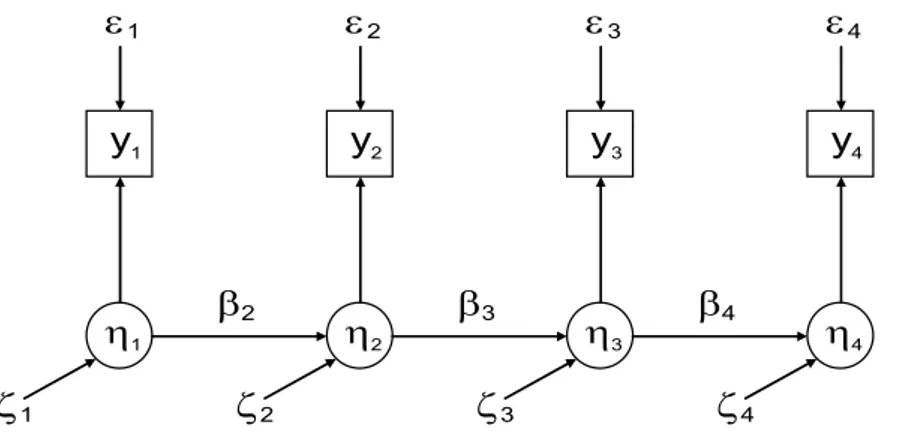
The first extension of the LISREL model to longitudinal studies, where the same or similar quantitative measures have been obtained for several occasion, has been proposed by Jöreskog (1970, 1979 and 2001; et al. 1977; and Sörbom, 1977). The Author considers the case of multiwave one variable and introduces dynamics in LISREL model supposing that the latent variable at time t depends on the same latent variable at time (t-1), and that it is measured by the observed variable y at the same time
Ƨi = ƢiƧi-1 + Ʀi i = 2, ..., t (4)
yi = Ƨi + ƥi i = 1, 2, ..., t (5)
or, in matrix notation, B Ƨt = Ʀt, yt = Ƨt + ƥt, where B is a coefficient matrix of
order t×t and Ƨt, Ʀt, yt and ƥt are vectors of dimension t. The ƥi are assumed to be
uncorrelated among themselves and uncorrelated with Ƨi, Ʀi+1 are uncorrelated
withƧi.
Jöreskog introduced dynamics in the classic LISREL model only by the latent endogenous variables (Figure 5). This model, called SIMPLEX model, is based on the hypothesis that the latent endogenous variable is generated by an AR(1) process. Generalisations of this model including more observed variables, error correlations and common factors are also considered by Jöreskog (1979), who develops a general model for the analysis of longitudinal data.
Let us suppose that several variables are measured at T points in time; let pt
dependent variables be measured at occasion t and let yt' = (y1t, y2t, ..., yptt) be the
vector of this pt variables. It is assumed, at each occasion, that yt has a common
2 1 3 4 2 1 3 4 K K K K ]2 ]3 ]4 E2 E3 E4 H2 H1 H3 H4 ]1 y y y y
Figure 5 – The SIMPLEX model path diagram.
yt = ƌytƧt + ƥt (6)
where ƥt is a vector of unique factors and ƌyt is a pt×mt matrix of factor loadings.
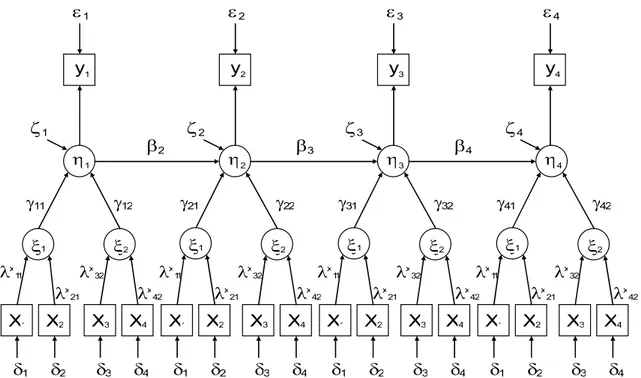
In addition to the dependent variable yt, q independent variables x' = (x1, x2, ..., xq) representing characteristics and conditions existing before the
first occasion are measured and they are supposed to influence the dependent variable yt (Figure 6). It is also assumed that x has a factor structure with
com-mon factors Ʈ' = (Ʈ1, Ʈ2, ..., Ʈn) so that
x = ƌxƮ + Ƥ (7)
where Ƥ is the vector of unique factors and ƌx is a q×n matrix of factor loadings.
The structural equation connecting the Ƨ’s and Ʈ are assumed to be
Ƨ1 = A1Ʈ + Ʀ1 (8)
Ƨt = AtƮ + BtƧt-1 + Ʀt (9)
where At is a regression matrix of order mt×n, Bt is a regression matrix of order
mt×mt-1 and B1 = 0. The vectors Ʀt' = (Ʀ1t, Ʀ2t, ..., Ʀmtt) contain the residuals
as-sumed to be correlated within occasions but uncorrelated between occasions. The SIMPLEX model and its generalisations2 present some drawbacks. It
treats variables at several occasions as distinct variables, therefore the model es-timation in presence of more than two occasions does not allow to estimate the data generating process but only the temporal dependence from one occasion to the other one. In presence of more than two time points, the SIMPLEX model is valid only if time-varying coefficient hypothesis is introduced, or if different data generating processes are supposed to influence the dynamics. Thus, we cannot estimate the underlying stochastic process that generated observations at the dif-ferent times. The problem can be masked by allowing for time-varying AR(1) co-efficients.
y2 y1 K2 K1 ]2 E2 E3 H2 H1 [ [2 [ [2 J12 J22 J11 J21 X1 X2 X3 X4 X1 X2 X3 X4 y3 K3 ]3 H3 [ [2 J32 J31 X1 X2 X3 X4 Ox 42 Ox 32 Ox Ox Ox 42 Ox 32 Ox Ox Ox 42 Ox 32 Ox Ox G1 G2 G3 G4 G1 G2 G3 G4 G1 G2 G3 G4 E4 K4 y4 H4 ]4 [ [2 J42 J41 X1 X2 X3 X4 Ox 42 Ox 32 Ox Ox G1 G2 G3 G4 ]1 1 1 1 1 11 11 11 11 21 21 21 21
Figure 6 – The GENERAL SIMPLEX model path diagram.
We propose an extension of the SIMPLEX model according to which the la-tent exogenous variables affect, in the structural model, as in the classic LISREL specification (Figure 7). y2 y1 K2 K1 ]2 E2 E3 H2 H1 [ [ [ [ J22 J22 J11 J11 X X X X X X X X y3 K3 ]3 H3 [ [ J22 J11 X X X X Ox Ox Ox Ox Ox Ox Ox Ox Ox Ox Ox Ox G11 G12 G13 G14 G21 G22 G23 G24 G31 G32 G33 G34 ]1 11 12 13 14 21 22 23 24 31 32 33 34 11 12 21 22 31 32 132 111 211 232 311 332 142 121 221 242 321 342
In our case, the latent endogenous variables, Ƨ at time t, depend on the latent endogenous variables Ƨ at time t-1 and on the exogenous latent variables Ʈ at the current time t.
Ƨt = ƃtƧt-1 + ƄtƮt + Ʀt (10)
yt = ƌytƧt + ƥt (11)
xt = ƌxtƮt + Ƥt (12)
with Ƨ1 = ǐ1Ʈ1 + Ʀ1 (B1 = 0), being Ƨt, Ʈt vectors of endogenous and exogenous
variables, of dimensions mt and nt, yt and xt vectors of observable variables, of
dimensions pt and qt, Bt a regression matrix of order mt×mt-1, ǐ1 a coefficient
ma-trix of order mt×nt; ƌyt and ƌxt are matrices of factor loadings of dimensions
pt×mt and qt×nt, ƥt and Ƥt the corresponding vectors of unique factors. We assume
that: ƥt are uncorrelated with all Ƨt, Ƥt are uncorrelated among themselves and
be-tween occasions and Ʀt+1 is uncorrelated with Ƨt. In longitudinal studies where the
same variables are used repeatedly, there is the tendency for the corresponding errors to correlate over time because of memory and other retest effects. There is a need to generalise the model to allow for correlation between errors: hence we assume that ƥt are correlated among themselves and between occasions. We also
assume that Ʈtare correlated among themselves and between occasions. This
hy-pothesis is introduced to take into account the possible interrelation of exoge-nous latent variables at the same time and the temporal dependence between oc-casions.
In the following, we verify the proposed EXTENDED SIMPLEX model on the pseudo panel data described in section 4, in the assumption of time-varying AR(1) coefficients even if this is a simplifying hypothesis.
6. ESTIMATE RESULTS AND ECONOMIC INTERPRETATION OF THE DYNAMIC MODEL
In order to find the latent structure underlying the TRAM customer satisfac-tion evaluasatisfac-tion system and to specify the structural equasatisfac-tion model, we con-ducted an exploratory factor analysis on the 2004 data, using Principal Axis Fac-toring and Varimax Rotation. A 3-factor structure, with more than 70% of total variance explained, is the best solution. Accordingly to the items associated to these factors they were named as shown in Table 2. For each of the three sets of items the Cronbach’s Alpha was calculated in order to evaluate how well these items measure the latent constructs they refer to. The results, ranging from 0.782 to 0.891, show that all the three sets of items are adequate.
TABLE 2 Latent factor description Factor 1 Travel Time Factor 2 Travel Comfortableness Factor 3 Customer Relationship
Punctuality Convenience Customer Care
Frequency Cleanliness Drivers
Speed Comfort Environment
Safety Handicap
Bus Shelters Info
Tickets Availability Ticket Price
Cronbach’s Alpha: 0.810 Cronbach’s Alpha: 0.891 Cronbach’s Alpha: 0.782
The confirmatory analysis indicates that the measurement model defined for 2004 has a good fit as indicated by a chi-square of 106.38 with 63 degrees of free-dom (Ʒ2/df=1.69) and Adjusted Goodness of Fit Index of 0.92. The same
meas-urement model applied to data referred to 2000 (Ʒ2/df=1.76, AGFI=0.88) and
2002 (Ʒ2/df=1.74, AGFI=0.89) shows a good fit.
A structural equation model with the aim to verify the hypotheses previously de-fined is specified. Because of the reduced number of available observations whit respect to the high number of parameters to estimate, we specified a parsimonious model in which only the first two factors were included. Dynamics was introduced in the structural model through time (causal) dependence between overall satisfac-tion latent variables. In Figure 8 the model referred to a single year is represented: the two latent exogenous variables, “Travel Time” and “Travel Comfortableness”, measured by the items reported in Table 2, affect the latent endogenous variable “Overall Satisfaction” that is measured by the observed variables “Global Judg-ment” and “Expectations”. The EXTENDED SIMPLEX model introduces the further assumption that the “Overall Satisfaction” at the current time depends on the “Overall Satisfaction” of the previous time, and affects the Overall Satisfaction of the following time, as indicated by the hatched arrows.
Punctuality Frequency Speed Convenience Cleanliness Comfort Safety Bus Shelters Ticket Availability Travel Time Travel Comfortableness Overall Satisfaction (t) Judgment Expectations Overall Satisfaction (t-1)
The specified model is estimated with the Weighted Least Squares (WLS) method and all the parameters have positive sign with high t values (Table 3). The model has a good fit as indicated by Normed Fit Index (NFI)=0.97, Non-Normed Fit Index (NNFI)=0.98, Comparative Fit Index (CFI)=0.98, Incre-mental Fit Index (IFI)=0.98, Relative Fit Index (RFI)=0.97 and AGFI=0.97. The Root Mean square Residual (RMR) of 0.27 and the Root Mean Square Error of Approximation of 0.201 are not really good but this is not surprising whit such a parsimonious model has indicated by the Parsimony Normed Fit Index (PNFI)=0.92 and Parsimony Goodness of Fit Index (PGFI)=0.87 (Browne and Cudeck, 1993).
TABLE 3
Structural model coefficients estimates (t values in brackets)
Ƨ1 Ƨ2 Ƨ3 Travel Time 2000 (Ʈ11) (3.85)0.13 Travel Comfortableness 2000 (Ʈ12) (2.99)0.08 Travel Time 2002 (Ʈ21) (15.89) 0.81 Travel Comfortableness 2002 (Ʈ22) (3.64)0.11 Travel Time 2004 (Ʈ31) (7.52)0.49 Travel Comfortableness 2004 (Ʈ32) (10.23) 0.99 Overall Satisfaction 2000 (Ƨ1) (3.81)0.11 Overall Satisfaction 2002 (Ƨ2) (2.89)0.09
Model estimate showed some interesting results in order to verify our hy-potheses and evaluate customers satisfaction dynamics (Figure 9)3.
The estimates of the model on cohort data give significant results and there-fore support the assumption that public transport evaluations change over cus-tomer age. However, the present version of the EXTENDED SIMPLEX model doesn’t allows to obtain parameter estimate of age effects on overall satisfaction, that can be evaluated introducing additional covariates in the model: this is the object of our future research.
Secondly, “Overall satisfaction” depends, in all the three years, both on “Travel Time” and on “Travel Comfortableness”. Coefficients with positive sign indicate that higher levels in Travel Time Satisfaction and, similarly, in Travel Comfortableness Satisfaction lead to higher level in Overall Satisfaction (see Hy-potheses H.1 and H.2). The HyHy-potheses H.5.2 is also supported by the data: the role of the two factors changes over time. The influence of “Travel Comfortable-ness” increases over time (0.08, 0.11 and 0.99 respectively), while “Travel Time”, starting from 0.13 in 2000 increases in 2002 (0.81), but reduces in 2004 (0.49).
3 In Figure 9, not significant Var(Ƥt) are imposed to be zero. The model estimate evidences an Heywood case on Var(ƥ1,1) and Var(ƥ3,2): they may not be identified and therefore are imposed to be zero (Bartholomew et al., 2002), (gray labels and arrows).
Punctuality Frequency Speed Convenience Cleanliness Comfort Safety Bus Shelters Ticket Availability Travel Time Travel Comfortableness Overall Satisfaction Judgment Expectations 1.00 1.49 1.53 1.26 1.12 1.00 1.20 0.76 1.30 1.00 0.31 0.49 0.00 0.57 0.37 0.64 0.00 0.00 0.00 0.00 0.00 0.00 0.86 Punctuality Frequency Speed Convenience Cleanliness Comfort Safety Bus Shelters Ticket Availability Travel Time Travel Comfortableness Overall Satisfaction Judgment Expectations 1.00 0.97 0.96 0.83 0.92 1.00 0.72 0.62 0.86 1.00 0.57 0.81 0.00 0.00 0.00 0.56 0.00 0.00 0.00 0.40 0.00 0.00 0.67 Punctuality Frequency Speed Convenience Cleanliness Comfort Safety Bus Shelters Ticket Availability Travel Time Travel Comfortableness Overall Satisfaction Judgment Expectations 1.00 0.99 0.98 1.08 1.09 1.00 0.90 1.05 0.38 1.00 3.73 0.00 0.00 0.00 0.00 0.00 0.00 0.00 0.00 0.86 0.81 0.00 0.09 0.11 0.13 0.08 0.11 0.40 0.05 0.08 Year 2004 Year 2002 Year 2000 0.99
Figure 9 – Model estimates.
Therefore the results show that customers conditions on the bus and the easi-ness of the public transport use increases over time: this is a relevant factor
af-fecting the customer satisfaction and its relevance increases over time. In addi-tion, parameters that show how much “Overall Satisfaction” at one time affects the corresponding satisfaction of the following year, are significantly different from zero, confirming the presence of dynamics in the customer satisfaction evaluations (Hypotheses H.5.1).
Expectations are hypothesized to have an impact on satisfaction (Hypotheses H4). Indeed, there is ample evidence to indicate that the role of Expectations in measuring the “Overall Satisfaction” is positive but decreases over time and this is a very interesting finding for a phenomenal point of view. This means that cus-tomers improve public transport service knowledgement by using it; therefore what they get is not so different from what they expect to have. In other words, the use of public transport is largely habitual as the most travel mode choices.
7. CONCLUSIONS AND FUTURE RESEARCHES
This study develops a dynamic customer satisfaction model for the urban transport customers with the aim to investigate if customer satisfaction changes over time and which are the main determinants of the customer satisfaction. The conceptual model used in the analysis relates the customer Overall Satisfaction to customer evaluations about Travel Time and Travel Comfortableness and it high-lights how these relations change over time.
In absence of panel data on customer evaluation of the public transport service we propose to use the average cohort technique to generate pseudo panel data. Because of the quality evaluation changes over customer age, the average cohort technique can be usefully used to explore the dynamics in the quality evaluation of the public transport. Therefore pseudo panel data solves the typical problem of the lack of longitudinal observation on customers and allows dynamic analysis by LISREL Model.
In the paper we also propose a new extended version of the traditional SIM-PLEX model introducing the latent exogenous variable effects in the structural model: in our model latent endogenous variables at time t depend on the latent endogenous variables at the previous time and on the exogenous latent variables at the current time.
Structural model estimate and tests indicate that the customer satisfaction changes over age and over time and that it is influenced by some characteristics of the transport service, such as the time and the comfortableness of the travel. Expectation also affects the overall satisfaction but its influence decreases in time supporting the hypothesis that the public transport mode choice is habitual.
EXTENDED SIMPLEX model on pseudo panel data is an interesting frame-work to analyze customer satisfaction and it provides interesting results. Unfor-tunately it is weak for dynamic analysis because it is derived under the assumption of time varying coefficients. Further researches will be conducted to overcome this hypothesis and to test dynamic model in the Observed Form Solution as proposed by Bollen (1996, 2001) In particular, our future efforts will be
concen-trated in estimating the LISREL model using pseudo panel data in the long for-mat. This solution allows for autoregressive distributed lag structural equation models (ADL) with latent variables, thus overcoming the problem of time varying coefficients.
Dipartimento di Scienze Statistiche CRISTINA BERNINI
Università di Bologna ALESSANDRO LUBISCO
REFERENCES
BAGOZZI R.P., WARSHAW P.R. (1990). Trying to consume. Journal of Consumer Research, vol. 17,
127-140.
BAGOZZI R.P. (1994). Structural Equation Models in Marketing research: basic principles. In
Bagozzi R.P., Principles of marketing Research, Cambridge, Blackwell, 317-385.
BARTHOLOMEW D.J., STEELE F., MOUSTAKI I., GALBRAITH J.I. (2002). The analysis and interpretation of
multivariate data for social scientists. Chapman and Hall, London.
BOLLEN K.A. (1996). An alternative Two Stage Least Squares (2SLS) estimator for latent variables
equations. Psychometrica, vol. 61, n. 1, 109-121.
BOLLEN K.A. (2001). Two Stage Least Squares and latent variables models: simultaneous estimation
and robustness to misspecifactions. In R.Cudeck, S. Du Toit and D. Sorböm (eds) Structural
equations modelling: present and future, a festschrift in honor of Karl Jöreskog. Lin-coln, IL: Scientific Software, 119-138.
M. BROWING, A. DEATON, M. IRISH (1985), A profitable approach to labor supply and commodity
de-mands over the life-cycle. “Econometria”, vol. 53, pp. 503-544.
BROWNE M., W CUDECK R. (1993). In Altenative ways of assigning model fit. In Bollen K. A.
Scott Long J. Testing structural equation models, Sage Publications, Newbury Park, 136-162.
CAGNONE S., LUBISCO A., MIGNANI S. (2003), Modelli a variabili latenti per l’analisi della Custo-
mer Satisfation degli utenti dei servizi di trasporto pubblico, collana Appunti e ricerche n. 2, Alma Mater Studiorum Università di Bologna Polo scientifico didattico di Rimini.
DEATON A. (1985), Panel data from time series of cross-section. “Journal of Econometrics”, vol.
30, pp. 109-126.
FERRER E., MCARDLE J.J. (2003), Alternative Structural Model for multivariate longitudinal data
analy-sis. Structural Equation Modeling, vol. 10, n. 4, 493-524.
FUJII S., GÄRLING T., KITAMURA R. (2001), Changes in divers’ perceptions and use of public transport
during a freeway closure: effects of temporary structural changes on cooperation in a real life social
di-lemma. Environment and behaviour, vol. 33, n. 6, 796-808.
GÄRLING T., BOE O., FUJII S. (2001), Empirical tests of a model of determinants of script based driving
choice. Transportation research F, vol. 4, 89-102.
GOLOB T.F. (2003), Structural equation modelling for travel research. “Transportation research Pat B: Methodological”, vol. 37, pp. 1-25.
JAKOBSSON C., FUJII S., GÄRLING T. (2002), Effects of economic disincentives on private car use,
Trans-portation, vol.29, n.4, pp. 349-370.
JÖRESKOG K.G. (1970), Estimation and testing of simplex models. “British Journal of
Mathemati-cal and StatistiMathemati-cal Psychology”, vol. 23, pp. 121-145.
JÖRESKOG K.G. ROCK D.A. WERTS C.E. and LINN R.L.(1977), A maximum likelihood solution to the
errors in variables and errors in equation models. Journal of Multivariate Behavioral Research,
JÖRESKOG K.G., SÖRBOM D.(1977), Statistical models and methods for analysis of longitudinal data. In
D.J. Aigner and A.S. Goldberger (Eds.): Latent Variables in Socioeconomic Models. Amsterdam: North-Holland Publishing Co.
JÖRESKOG K.G. (1979), Statistical estimation of Structural Model in longitudinal-developmental
investi-gation. In “Longitudinal research in the study of behaviour and development” (Edited
by J. R. Nesselroade), pp. 303-352.
JÖRESKOG K.G. (2001). Analysis of Ordinal Variables: Longitudinal Data. In “Scientific Software
International”.
PETER J.P., OLSON J.C., GRUNERT K.G. (1999), Consumer behaviour and marketing strategies. London,
McGraw Hill.
THÖGERSEN J. (2001), Structural and psychological determinants of the use of public transport. Pre-sented at the TRIP colloquium at Horsholm (14-15 november).
STEENKAMP J.B., BAUMGARTNER H. (2000), On the use of structural equation models for marketing
modeling.International Journal of Research in Marketing, vol. 17, pp. 195-202.
ZANELLA A. (2001),Valutazione e modelli interpretative di Customer satisfaction: ricerca di un quadro
complessivo. In “Processi e Metodi statistici di Valutazione”, Atti del Convegno
Interme-dio SIS, pp. 113-120.
RIASSUNTO
Una nuova versione dinamica del modello Simplex per l’analisi della Customer Satisfaction nei servizi di trasporto pubblico
L’analisi dinamica della Customer Satisfaction risulta particolarmente utile per monito-rare la soddisfazione dei clienti nel tempo e per verificare l’effetto delle strategie aziendali sui comportamenti dei clienti. Tale analisi consente alle aziende di misurare l’efficacia e l’efficienza delle proprie politiche. In particolare, gli obiettivi del lavoro sono di verificare se la soddisfazione cambia nel tempo e se le aspettative dei clienti influenzano la soddisfa-zione globale, e di individuare quali sono i fattori che in misura maggiore hanno determi-nato la dinamica della soddisfazione. A questo scopo, viene proposta una versione origi-nale del modello LISREL in contesto dinamico. La verifica empirica del modello è stata condotta su dati pseudo-panel, costruiti a partire dall’indagine sulla Customer Satisfaction dei servizi pubblici di trasporto dell’Agenzia Tram di Rimini, realizzata dalla Facoltà di Scienze Statistiche negli anni 2000-2004.
SUMMARY
A new extension of dynamic simplex model for the public transport customer satisfaction
The dynamic analysis of Customer Satisfaction is particularly useful for monitoring either customer satisfaction over time or customer behaviour reaction to company strategies, and therefore for measuring their effectiveness and efficiency. In the paper we address the following questions: does the level of customer satisfaction change over time? If yes, which factors might explain these differences? Does customer expectation influence the overall satisfaction over time? In order to answer to these questions, we propose a new extended dynamic version of LISREL model and we evaluate its performance on pseudo-panel data, built on the Customer Satisfaction of Tram Surveys conducted by the Faculty of Statistical Sciences for the Tram Agency of public transport in Rimini in the period 2000 to 2004.