EFFICIENCY INDICATORS VERSUS FRONTIER METHODS:
AN EMPIRICAL INVESTIGATION OF ITALIAN PUBLIC HOSPITALS L. Clementi, A. Maruotti
1. INTRODUZIONE
The aim of this paper is to identify appropriate evaluation methods for com-parison among different kinds of hospitals to address the issue of the inefficiency in health services. The emphasis on methodological issues is in line with the view expressed by Eckermann (1994): “Both hospital productivity and hospital effi-ciency require careful conceptual consideration before assessing how current measures of hospital activity can be used to measure such phenomena. There is a temptation to use any available data (even if not understandable) to assess pro-ductivity as efficiency, without due recognition of the need to determine a sound theoretical basis on which to do so” (p. 168).
This view may give guidelines to service providers to improve technical effi-ciency and for policy makers to determine health care priorities. Depending on the study setting, different measures of health care efficiency can be used.
We focus on examining two main approaches as they apply to health care ser-vices:
– simple ratio analysis;
– stochastic frontier analysis (SFA);
The identification of reliable and scientifically valid efficiency measurement strategies would be a boon to the policy makers and stakeholders interested in efficiency measurement and improvement (Hollingsworth and Street, 2006). The potential uses of such measures are several. Accurate measures can be used to as-sess the degree of efficiency in organizations while identifying its correlates. Inef-ficiency measures could be also incorporated into schemes designed to improve the performance of the health care system.
Efforts to study and reduce hospital inefficiency have been hindered by a lack of commonly accepted measures.
We feel that a shared step by step procedure to determine an adequate ap-proach to measure efficiency and to choose input and output to be implemented, can be pursued.
The plan of the paper is as follows. In Section 2 we briefly discuss the Italian health care system. Section 3 provides an analysis of the analyzed dataset. In Sec-tion 4 we discuss strategies to identify hospital efficiency indicators and provide a proposal about indicators to be used to measure hospital efficiency. Section 5 provides a brief review of the frontier methods for measuring the efficiency re-lated to the potential best-practice and Section 6 discusses the empirical results. Finally, some concluding remarks are provided in Section 7.
2. MONITORING THE ITALIAN HEALTH CARE SYSTEM
As in other western health-care systems, the more relevant problems faced by the Italian health-care system are:
– the growth in spending on health care, subject to the macro-economic budget limits fixed by the Maastricht treaty;
– the unsuitable nature of certain services, which translates into non-rational use of resources and inefficiency;
– the growing percentage of health-care spending met directly by families. The measurement of efficiency is difficult, especially in health care sector. Co-herent management of the system also requires a distinction between purely fi-nancial actions and actions intended to improve the overall efficiency of the sys-tem.
Undifferentiated government policies (for example the ones oriented to fix the maximum number of regional bed places per inhabitant) seem unable to provide incentives towards effective rationalization and may be source of additional risk of inappropriateness and inefficiency. The use of the tariff leverages for financial reasons (compliance with funding ceilings) predominates over their use to regu-late the quality of services provided. By exclusion, one has to admit that the dif-ferences in performance justify a presumption of the existence of widespread in-appropriateness.
Since the '90s policy makers of OECD countries have been focused on in-creasing efficiency of the hospital sector (OECD, 1992 and OECD, 1994) and, in specific contexts, efficiency-based financing systems have been introduced (Har-ris, 1990).
In 1992 Italian legislation transferred significant powers to Regions and intro-duced three basic principles according to which providers of personal health ser-vices should be funded: patients' freedom of choice; parity of treatment of public and private accredited providers; per case (hospital care) and per unit of service (outpatient care) funding system. In 1995 the Government mandated the use of a prospective per-case financing of hospitals and identified efficiency and quality measures for the National Health Service (NHS; see e.g. Bocchino, 2000).
More specifically, the Diagnosis Related Group (DRG) system has been adopted to classify discharges admissions and to identify tariffs for ordinary, day
hospital and day surgery cases. The DRG tariffs are supposed to cover most of hospital costs, including administration and overheads, excluding capital costs.
Further law actions have been undertaken to improve the quality, the effec-tiveness and the efficiency of the NHS. For instance, the main Italian reform in the last decades concerns the subject of devolution. In health context, it causes a separation of financing and use of health resources, on the basis of equity and fairness principle, and a reduction of elasticity of health care demand (Zweifel and Breyer, 1997). On the other hand, it induces free riding connected with positive externalities and may cause inefficiency in the smaller (or poorer) regions due to scale economies (Crivelli, Filippini and Lunati, 2000).
To evaluate the impact of such reforms on the NHS, a huge amount of infor-mation on hospital activities and costs need to be available; it is commonly ac-knowledged that the main problem for the analysis of hospitals performance is represented by the lack of information about activities and costs. Hence effi-ciency measurements may be heterogeneous and comparisons among hospitals are not possible. Researchers have used measures of throughout or intermediate outputs, as the number of cases treated, patient-days served per hospital depart-ment, and outpatient visitors, paying attention on two aspects of hospital activi-ties: case-mix and quality of care (see e.g. Wang, 2001).
3. DATA
When evaluating hospital organizations efficiency, the first priority should be to define a reliable dataset that can be used to compare hospitals costs and activi-ties. Here we use the cost data deduced from the so-called Ministerial CE, that is the standardized economic accounts using the classification required by central government level.
Data from the Agenzia Nazionale per i Servizi Sanitari Regionali (ASSR) on ac-tivity and cost indexes for years 2001, 2002 and 2003 have also been utilized. Analyzed data refer to 102 public hospitals for years 2001 and 2002, and 97 for 2003. However, in some cases the data were incomplete or not comparable, and therefore only 96 organizations have been included in the database. In other words, our dataset can be viewed as a longitudinal study, a collection of observa-tions in the same cross-section of hospitals, which are recorded repeatedly over time. Some of the benefits and limitations of using longitudinal data are given in Baltagi (2001). Obvious benefits include a usually larger dataset with more vari-ability and less collinearity among variables that is typical of cross-sectional or time series data.
The database includes hospitals from 16 Regions, with a total of 82.603 bed places in 2003, with a decrease of 5,77% with respect to in 2002. The number of hospitalizations reduced as well as 4.131.334 in 2001 to 4.106.735 in 2002 and 4.030.307 in 2003, while the number of bed-nights fell from 25.042.297 to 23.226.747, with a reduction of 7,25%.Overall, the organizations employ 212.167 personnel in 2003, 37.516 doctors and 88.189 nurses. Their total cost in 2003
amounted to 14.270 billion euros, equivalent to 186.465 euros per bed and 3.741 euros per hospitalization. Indicators on activity (bed-fill ratio, mean weight of the DRG, attraction index etc.), as well as on cost (per day stay in hospital, per hospi-talization and mean cost per unit of personnel) and on the efficiency of the pro-duction factors (e.g. discharges per doctor, nurses per bed place) were calculated for each hospital organization. Focusing on cost indicators, we find that between 2002 and 2003 the mean cost per day of stay rose by 4,5% whereas the cost per unit of personnel remained almost the same (+ 0,04%).
Obviously, the indicators are affected by the different complexities treated and are not yet suitable for comparisons between organizations (for a detailed over-view of indicators and adopted methodology see ASSR, 2003; 2004; 2006).
Summary statistics of the variables used in the following are displayed in Table 1, along with variables definition.
TABLE 1
Descriptive statistics for Italian hospitals over the period 2001-2003
Variable Description Mean (standard deviation)
Dependent variable
EXP Log total expenditure 18.65
(0.62)
Output variables
DIS25 Log number of cases treated with a
com-plexity grater than 2.5 Drg point (0.88) 12.01
DISDH Log number of cases treated in Day
Hos-pital regime (0.71) 9.21
LENGTH Log bed-nights 12.24
(0.67)
Input price variable
MWAGE Log average medical salary 18.16
(0.73)
Dummy variables
EMR 1 if emergency room 0.85
(0.35)
MONO 1 if single speciality hospital 0.15
(0.36)
Few comments can be drawn from the available data. The decrease in the av-erage length of stay and in the incidence of the unsuitable discharges shows a slow, but persistent, increase in efficiency according to the goal defined by the fi-nancial bill, which incentives the reduction of resources waste and the contempo-raneous readjustment of the offer of health care services.
It is well-known that health care demand may depend on demographic and epidemiologic characteristics of the population living in different areas. For in-stance, in some Regions, as Friuli Venezia Giulia, Piemonte and Toscana, the hospitalization rate is lower than the national average due to the "filter" that gen-eral practitioners produce between patients and hospitals: only the most severe cases are subject to hospitalization.
The analyzed dataset shows a large number of hospital outputs, that give an overview of the activities and the costs sustained by hospitals. Anyway, compara-bility is not always guaranteed. In fact, it may be impossible to compare costs
sus-tained by a single-speciality hospital with one that treats different diseases. Costs for equipments, due to the continuous improvements of technology, have a higher burden for those hospitals that treat more complex cases (e.g oncologic hospitals); therefore, higher costs do not always imply inefficiency. In other words, comparing hospitals with different case-mix may lead to biased conclu-sions.
4. HOSPITAL OUTPUTS AND EFFICIENCY INDICATORS
4.1 Strategies for identifying hospital efficiency indicators
As can be derived from the previous discussion, it is crucial to build a per-formance indicator which selects the best practices (in term of both economic and clinical perspectives) and takes into account both costs and activities. Re-cently, a wide class of indices has been introduced to compare hospital perform-ances (see among others Nazimi, 2002; Powell et al., 2002; Smits et al., 2003).
In the efficiency framework, we have to take into account the special nature of the hospital when considered as a productive unit. Its output is not clearly de-fined and measurable, six basic ways to define hospital output can be derived from literature (Berki, 1972):
• patient days or number of discharges; • hospital services;
• episodes of illness; • health status levels; • intermediate inputs;
• composite indexes of one or more of the previous measures.
These approaches are not universally accepted and, hence, it is necessary to clarify the definition of hospital outputs.
Several methodological proposals have been made to consider the case-mix such as the number of outpatient visits and in-patient admissions (Wouters, 1993), number of in-patient days per hospital department and emergency room visiting (Cowing and Holtmann, 1983), and the method of payment (Conrad and Strauss,1983). On the other side, there are no well-defined methodologies to measure the quality of care (some examples are given by Ellis, 1992).
We focus on the case-mix issue since we would make hospital activities com-parable to identify an empirical procedure which takes into account the produc-tivity and the structure of costs of hospitals. The starting point for the definition of an homogeneous output is given by Lave and Lave (1970) and Thompson et al. (1975) who suggest three different approaches to measure the case-mix:
– define groups of patients with respect to the amount and type of expended resources;
– aggregate patients by clinical services and define case- mix in terms of the proportion of patients in these groups;
– classify patients according to various ICD groups and define case-mix by the percentage of patients within these diagnostic groups.
Recently, a set of explicit criteria to be used for the definition of an indicator set has been proposed to evaluate health (Kramers, 2003). The European Union specifies a list of “European Community Health Indicators” that have to:
– be comprehensive and coherent, i.e. cover all domains of the public health field;
– take into account of the earlier work, especially that by WHO-Europe, OECD and Eurostat;
– be flexible.
4.1 A proposal: the cost per DRG point, with application
Simple ratios have the main advantage of simplicity: “While a very simple and clearly defined objective may not capture all the dimension of interest, it has the countervailing advantage of making it relatively easy to monitor success in those dimension that it does capture” (Sugden and Williams, 1978).
Inefficiency can be measure through a set of indexes such as the average length of stay (in-patient and acute care or by diagnostic categories), discharges rates (by diagnostic categories), in-patients beds, etc. In its report on hospitals activities, the Italian Ministry of Health suggests either the length of stay or the comparative performance index (ICP) to evaluate the operative efficiency of hospitals, through the average length of stay standardized with respect to the case-mix.
The choice of a suitable indicator is strictly related to the study goal. If we aim at comparing the burden due to the activity of an hospital, we may classify the hospitalizations accounting for the case-mix, by the DRG system.
If we apply to the hospital means of discharges the weights associated to each DRG (determined by the Ministry of Health), a homogeneous measure may be defined, as follows:
i ik k
k
y
=
∑
d w
(1)Here yi is the sum of all the discharges (dik), from the i-th hospital and the k-th DRG, weighted with the corresponding DRG points (wk). However, the evalua-tion of an efficiency measure of an hospital needs to take into account not only the hospital activities, in this case the weighted sum of all the discharges by the hospital, but also the economic resources needed to provide this level of health care.
Here, we are not only interested in comparing hospital activities, but also on measuring their impact on costs. Linkage between activity and costs has recently increased in importance, because policy makers aim at reducing waste of (eco-nomic and human) resources. Even if the NHS still keeps its principles of univer-sality and solidarity, it has gradually gained the characteristic of a firm that pro-duces health care services as output, under a given budget.
For applications requiring summary measures of managerial performance, it is important to check for between-hospital variation in factors that go beyond managerial control (such as the case-mix). Simple cost/output ratios are limited since they can not control for exogenous hospital characteristics or features of environment production.
A natural way to deal with heterogeneity of hospital activities and costs is based on the cost per DRG point (CPDP):
i i ik k k c CPDP d w =
∑
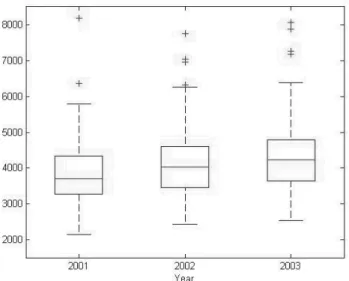
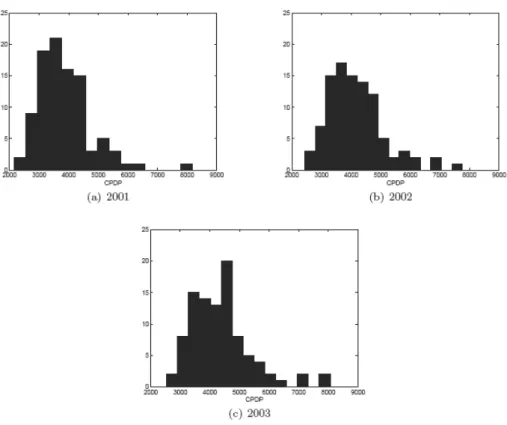
(2)where ci is the sum of the costs sustained by the i-th hospital. Some descriptive statistics for the CPDP are presented in Figure 1, while distributions for each year are displayed in Figure 2.
Figure 1 – CPDP summary statistics.
Costs are obtained by considering daily tariffs for in-patient rehabilitative care estimated on the basis of discharges. No adequate data were available to calculate costs of DH for each DRG. Tariffs for DH were calculated as 120% of average cost per day of medical and surgical DRGs.
The maximum observed value of CPDP is three times the minimum. Such dif-ferent performances imply the presence of some problems related to the unreli-ability of hospital balances, to the unsuitunreli-ability of the DRG financing system to represent case-mix complexity and to a general lack of efficiency. As pointed out above, a performance comparative index should take into account not only hospi-tals activities, but also its connection with required economic resources. For this
Figure 2 – CPDP distributions.
purpose, the CPDP index became popular in the last several years (see e.g. Bar-retta et al., 2005); the economic perspective has assumed an important role in NHS efficiency analysis and, hence, new statistical indexes are needed to evaluate
hospital efficiency not only under the clinical profile. The introduction of the DRG financing system has changed the viewpoints of the health care system in Italy; the impact of the DRG system should push the hospital production system toward efficiency, since increasing production leads to a lower CPDP, which is often used as proxy of efficiency.
In details, the CPDP for the 96 examined hospital organizations averaged 3.858,82 euros (with maximum of 8.181,60 euros and minimum of 2.452,06 eu-ros) in 2001, 4.157,78 euros (with maximum of 7.755,10 euros and minimum of 2.434,79 euros) in 2002 and 4.366,38 euros (with maximum of 8.062,19 euros and minimum of 2.541,26 euros) in 2003.
It should be noticed immediately that, contrary to expectations, the (compara-ble) cost per case treated varies greatly. The highest figure was 380% of the low-est in 2001, 319% in 2002 and 317% in 2003.
This worrying inequality in performance between different hospital organiza-tions does not provide an explanation by itself. The causes might be the unreli-ability of the accounting statements, the failure of the system of DRG based payment system to represent the complexity, or some operational inefficiency.
For our purposes, however, it is of interest to examine the questions of techni-cal and organizational efficiency to assess their absolute levels as well as relation-ships with organizational and management services characteristics.
5. FRONTIER ANALYSIS OF HOSPITAL EFFICIENCY
Simple ratios are quite useful for setting reimbursement rates but problems arise when we want to investigate about the gap between observed and potential performance, or about how hospital decision-makers might go about bridging this gap. In contrast, frontier methods deliver benchmarks based on best-practice and efficiency scores that reflect deviations between observed and potential per-formance.
Initially, hospital inefficiency has been estimated by ratio analysis, ordinary least squares (OLS), or corrected ordinary least squares (COLS) regression (Richmond, 1974). No allowance is made for exogenous shocks, errors in meas-urement, or noise. The entire residual is assumed to be as inefficiency. To over-come the drawbacks associated with these methods, frontier techniques have been developed. Frontier methods attempt to determine “best practice” relation-ships. They measure inefficiency in terms of distance between actual performance and best practice frontier.
Several methods have been used to estimate the efficiency of a productive unit (for a brief review see e.g. Rosko and Mutter 2008).
These approaches use different techniques to envelop the observed data and therefore make different assumptions upon random noise and for flexibility in the structure of the production technology.
Following an econometric approach, we specify a cost function and claim that the deviation from this technology (as measured by the error term) is composed by two parts, one representing randomness (or statistical noise) and the other in-efficiency. The usual assumption for the two-component error structure is that the inefficiencies follow an asymmetric half-normal or exponential distribution while the random errors are normally distributed.
The random error term is generally thought to encompass all events outside the control of the organization, including both uncontrollable factors directly concerned with the actual production function (such as differences in operating environments) and econometric errors (such as misspecification of the produc-tion funcproduc-tion and measurement error). This approach has led to the development of a stochastic frontier approach (SFA), which takes such external factors into account when estimating the efficiency of real-world organizations (Meeusen and van der Broeck, 1977).
SFA allows for the separation of noise and inefficiency by decomposing the er-ror term into two parts; the cost function can be written as:
( )
i i i i
where Yi is the (logarithm of the) cost of production for the i-th hospital; xi is a
kx1 vector of (transformations of the) input prices and output of the i-th hospi-tal; β is a vector of unknown parameters; Vi consists of random variables which
are assumed to be iid N(0,σ2v) and independent of the Ui which are non-negative
random variables which are assumed to account for the cost inefficiency in the production and which are often assumed to be iid N(0,σ2u). An advantage of SFA is its focus on cost-inefficiency rather than just technical inefficiency.
Finally, every study has to deal with errors caused by traditional sampling varia-tion. However, SFA will classify this as noise (or the classical regression random error term), whereas other methods (e.g. Data Envelopment Analysis, DEA) will attribute this variation to inefficiency. Furthermore, outlier observations tend to confound other methods more than SFA (Jacobs et al., 2006).
An increasing number of empirical studies have examined the determinants of the efficiency of health care institutions (see e.g. Rosko and Proenca, 2005; Bates et al., 2006; Rosko and Mutter, 2008).
Often frontier-based efficiency scores are grouped, and simple analytic tech-niques are used to compare the efficiency distribution. However, one of the most used tools in the efficiency literature generally is the use of a two-step procedure to derive efficiency scores. The basic idea is to treat the efficiency scores as the dependent variable in an auxiliary regression model. This approach likely provides valuable insights into the causes of efficiency differentials. Same variables may be included both in the frontier model and in efficiency model, contributing to ex-plain cost frontier and factors affecting inefficiency (see for example Tveteras and Battese, 2006).
However, Battese and Coelli (1995) argue that the two-stage estimation proce-dure is unlikely to provide estimates that are as efficient as those that could be obtained using a single-stage estimation procedure. Furthermore, Wang and Schmidt (2002) found that the two-stage approach leads to biased estimates in an SFA study of technical efficiency; hence we will use one single step estimators in our empirical analysis.
The estimation of hospital inefficiency requires assumptions about the struc-ture of costs. We follow literastruc-ture on hospital application of SFA and focus on costs by choosing a cost function here as hospital output and input price are ex-pected to be exogenous, and input quantities endogenous. Outputs of hospitals are exogenous if the demands of the population served by a hospital, determines the level of output. Input prices are exogenous under national wage bargaining or competitive factor market assumptions, which is a reasonable assumption in most markets for hospital factors of production. Aggregated cost data rather than input quantities are also easier to obtain. The use of total cost as the dependent variable in a cost function requires only a single equation to be estimated, compared to the use of outputs as dependent variables. The cost function approach has been widely used to model the technology of firms operating in regulated environ-ments.
Hospital application of SFA have used a variety of functional forms, including Cobb-Douglas and translog, which we will consider in the empirical application.
There are a number of possible measures of hospital output in the literature and units commonly adopted are the number of case treated and bed-days. Given the inherent limitations of measuring and controlling for hospital output in the cost function, especially those related to quality, some of what is observed as cost inef-ficiency may still be unmeasured output differences across hospitals.
Data available on the types of staff employed are divided by considering medi-cal staff and other (e.g. Administrative) staff. The salary for each staff category is set under competitive factor market assumption. The average salary for each category is not expected to vary with changes in the number and skill-mix of em-ployees, hence it is assumed to be exogenous.
Since data on capital-related measures such as the rental price of land are not available, capital input price has been omitted from the analysis. In fact variation in the cost of capital is not likely to explain much of the variation in recurrent ex-penditure between hospitals.
Further, we introduce dummy variables to capture variation in costs across dif-ferent group of hospitals and regional indicator variables to identify influence of Regional Government policies.
6. RESULTS
We compare results by varying models and techniques in terms of type of cost function and two different parameterizations of the inefficiency term.
We have analyzed the two functional forms (translog and Cobb-Douglas) that have been used the most frequently in hospital cost efficiency studies, where the disturbance term is assumed to have two components: one component is as-sumed to have a strictly non-negative distribution, and the other component is assumed to have a symmetric distribution. Two different parameterizations of the inefficiency term: a time-invariant model and the Battese-Coelli (1992) parame-terization of time-effects. In the time-invariant model, the inefficiency term as-sumed to have a truncated-normal distribution. In the Battese-Coelli (1992) parameterization of time effects, the inefficiency term is modeled as a truncated-normal random variable multiplied by a specific function of time. In both models, the idiosyncratic error term is assumed to have a normal distribution. The only panel-specific effect is the random inefficiency term.
In Table 2, we summarize results based on translog and Cobb-Douglas func-tions and on time invariant and time-varying decay models.
The term γ=σu/(σv+σu) indicates the relative weight in the one-sided error term, when compared to the error term. Since the asymmetric component domi-nates the symmetric component, it appears that the one-sided error is significant (i.e. γ is close to 1). Variation in the frontier across hospitals appears attributed more to the one-sided error u; in fact “a value for γ of zero indicates that the de-viations from the frontier are due entirely to noise, while a value of one would indicate that all deviations are due to inefficiency” (Coelli et al., 1998). Strictly speaking, efficiency measurement against SFA minimum cost frontier yields a ra-
TABLE 2 Summary of Results
Model 1 Model 2 Model 3 Model 4
Cost function Translog Translog Cobb-Douglas Cobb-Douglas
Parameterization of the
inefficiency term Time invariant Time variant decay Time invariant Time variant decay
Log likelihood 320.58 331.61 282.66 288.82 AIC -571.15 -591.21 -515.32 -525.64 BIC -453.68 -470.38 -431.40 -438.37 Mean inefficiency 6.15% 19.52% 7.63% 10.41% Standard deviations of mean inefficiency 0.07 0.08 0.09 0.11 Minimum 0.6% 1.8% 0.7% 0.6% Maximum 29.92% 44.64% 71.61% 86.07% Pearson correlation with
referenced model 0.82 NA 0.66 0.70
γ 0.96 0.84 0.98 0.99
η -0.13 -0.11
tio of actual to potential production cost. The resulting efficiency scores take a value grater than or equal to unity, with higher scores indicating lower levels of efficiency in order to admit a consistent interpretation of SFA efficiency scores.
On the basis of model selection criteria, such as the Akaike information crite-rion (AIC) as well as the Bayesian information critecrite-rion (BIC), our preferred SFA model is the translog cost function associated with the time-varying decay model.
As Table 2 illustrates, varying assumption about the cost function may have an impact on estimated relative efficiency, while the time invariant and time decay models have a little impact on on estimated relative efficiency, once the cost functional form is specified. The mean efficiency score varies somewhat under different model specifications, ranging from 6.15% to 19.52%.; hence, even if correlation is strong, choice of model can have a substantial impact on the esti-mate of individual hospital inefficiency. The range of maximum values in Table 2 illustrates this quite clearly. Further, η indicates the temporal dynamic and it as-sumes a negative value indicating that inefficiency increases along time.
The Pearson correlation among the 3 variations from the preferred model ranges from 0.65 to 0.82; however if the correlation is measured with respect to the CPDP index, the correlation declines dramatically (see Table 3).
TABLE 3 Pearson correlations
Model 1 Model 2 Model 3 Model 4 CPDP
Model 1 1.00 0.82 0.77 0.76 0.20
Model 2 1.00 0.66 0.70 0.45
Model 3 1.00 0.98 0.14
Model 4 1.00 0.19
CPDP 1.00
Results in Table 4 allow us to make inroads in identifying the source of meas-ured inefficiency; the interpretation of the parameters outlined in Table 4 is fairly straightforward. The number of cases treated with a complexity grater than 2.5
TABLE 4
Estiamtes for our preferred (Model 2) cost frontier model (standard errors are displayed in parenthesis)
Variable Coefficient Variable Coefficient
COSTANT 2.14 (0.98) LENGTH*MWAGE -0.31 (0.14) DIS25 1.30 (0.87) CALABRIA -0.13 (0.09) DISDH 0.93 (0.73) CAMPANIA -0.20 (0.07) LENGTH 1.03 (1.35) EMILIA ROMAGNA (0.07) -0.14 MWAGE -3.31
(1.80) FRIULI VENEZIA GIULIA (0.07) -0.18
EMR 0.05 (0.03) LAZIO -0.17 (0.07) MONO 0.06 (0.03) LIGURIA -0.31 (0.07) DIS252 0.09 (0.03) LOMBARDIA -0.25 (0.06) DISDH2 0.03 (0.02) MARCHE -0.07 (-0.07) LENGTH2 0.30 (0.11) PIEMONTE -0.09 (0.07) MWAGE2 0.28 (0.08) PUGLIA -0.26 (0.08) DIS25*DISDH 0.09 (0.03) SARDEGNA -0.13 (0.09) DIS25*LENGHT -0.13 (0.09) SICILIA -0.18 (0.06) DIS25*MWAGE -0.17 (0.09) TOSCANA -0.07 (0.08) DISH*LENGTH -0.05 (0.08) UMBRIA -0.21 (0.08) DISDH*MWAGE -0.10 (0.08) VENETO -0.20 (0.08)
DRG point has a statistically significant impact (when we consider DIS252) on the estimation of the cost frontier, along with the characteristic of being a single-speciality hospital (MONO). These results remark the importance of considering case-mix when comparing efficiency in the health sector.
Moreover, the Regional dummies are calculated with respect to Basilicata (dropped due to multicollinearity) and show different propensities towards effi-ciency due to different health policies adopted at the Regional level.
7. CONCLUDING REMARKS
Unfortunately, the degree of correspondence between SFA-based and simple ratio measures does not suggest that they are interchangeable. Calls for parallel application of competing methods are already being heeded, with the result that various studies have confirmed that the precision of competing approaches is context specific (see Mortimer, 2002 for a review).
Each of the analyzed competing measures have a comparative advantage in a particular policy or management application. The policy value of competing
measures should be based on a more principled approach to consider differences in both the precision and content of all available options.
However, since hospital services operating within a NHS are generally given high social value, an efficiency analysis should consider the impact on the measurement of hospital performance of both demand variables and policymaker objectives to be pursued. Since there is no all-purpose method for considering the influence of demand and for translating policy-maker objectives into restric-tions on the model, these could be fruitful areas of development for future re-search.
We believe that evidence and strategies exist to guide researchers in making as-sumptions to estimate hospital inefficiency using SFA; findings from SFA are ro-bust to strategies that we would characterize as suboptimal (e.g., excluding quality variables because of data constraints). As a result, we feel that SFA holds great promise for use in better understanding the extent of inefficiency in the health care system and for designing policies to reduce inefficiency. SFA can be used to identify the correlates of inefficiency, and the inefficiency estimates generated by SFA hold promise for use in schemes that reward efficient providers.
Though doubts remain as to whether the accounting data are fully comparable, some indications arise regarding the inadequacy of the present DRG tariff system. The fact that DRG financing system cannot be directly extended to single-speciality structures whose average costs are higher is confirmed. Organizations with a single specialty are penalized (though in many Regions they receive addi-tional financing), whereas those with significant proportions of highly complex hospitalizations could in some way be favored.
Furthermore, the size of observed differences (a difference of about three times between the most costly and the least costly organization, growing in time) makes it impossible to believe they depend only on accounting factors or tariff distortions. This focuses attention on the technical efficiency of the hospital sys-tem.
The DRGs have definitely served as an incentive to greater productivity, though rates should be defined by the individual type of structure, taking into ac-count the additional factors, such as the clinical complexity. Thus, a divide can be observed between policies of rationalization based on indexes of supply (number of beds) and those based on indexes of efficiency: this divide is apparent in the results of our analysis, and is indirectly confirmed by the fact that, though the number of beds has decreased, hospital costs remain high.
The study has shown how the national and regional planning efforts of recent years, all geared towards reducing the cost of hospital care by reducing the num-ber of beds, have run into a practical limit to their achievement, namely the inca-pacity of the hospital system to reduce its spending or, more to the point, in-crease its efficiency. Reduced spending can result in improved efficiency only when a thorough adjustment is made within the entire production and manage-ment structure. The reductions in supply, fully expected and planned, are not matched by effective economic rationalization, pointing to the wisdom of revising the current systems of financing and control over public health care services.
These discrepancies in performance cannot be attributed solely to the inaccu-racy of the financial statements or to the unreliability of the DRG payment sys-tem, but must also lead to consideration of the possibility of a widespread opera-tional inefficiency.
Dipartimento di Scienze Economiche LORENZO CLEMENTI
Università di Roma – La Sapienza ECARES – Université Libre de Bruxelles
Dipartimento di Istituzioni Pubbliche, Economia e Società ANTONELLO MARUOTTI
Università di Roma Tre
REFERENCES
ASSR (2003), Confronto tra le aziende ospedaliere 2001, Monitor, 6: 49-61. http://www.
assr.it/monitor/monitor\_2003/Monitor2003.htm
ASSR (2004), Confronto tra le aziende ospedaliere 2002, Monitor, 11: 41-59. http://www.
assr.it/monitor/monitor\_2004/monitor\_2004.htm
ASSR (2006), Ricoveri, personale e spesa nelle aziende ospedaliere 2003, Monitor, 16: 45-63.
http://www.assr.it/monitor/monitor\_2006/monitor2006.htm
B.H. BALTAGI (2001), Econometric of Panel Data, Wiley.
A. BARRETTA, E. BOCCI, A. COZZOLINO (2005), Sull'efficacia delle strategie tese a ridurre la
vari-abilità degli indicatori di efficienza impiegati nei progetti di benchmarking: un'analisi statistica. Tendenze nuove, 6: 539-550.
G.E. BATTESE, T.J COELLI (1992), Frontier production functions, technical efficiency and
panel data: with application to Paddy Farmers in India, Journal of Productivity Analysis, 3: 153-169.
G.E. BATTESE, T.J COELLI (1995), A model for technical inefficiency effects in a stochastic
frontier production function for panel data, Empirical Economics, 20: 325-332.
S. BERKI (1972), Hosptial Economics. Lexington Books, Mass.
U. BOCCHINO (2000). Manuale di controllo di gestione. Il Sole 24 Ore S.p.a., Milano.
T.J. COELLI, D.S.P. RAO, G.E. BATTESE (1998), An introduction to efficiency and productivity analysis.
Kluwer Academic.
R.F. CONRAD, R.P. STRAUSS (1983), A multiple-output and a multiple-input model of the
hos-pital industry in North Carolina, Applied Economics, 15: 341-352.
T.G. COWING, A.G. HOLTMANN (1983), Multiproduct short-run hospital cost function:
Em-pirical evidence and policy implication from cross section data, Southern Economic
Jour-nal, 49: 637-653.
L. CRIVELLI, M. FILIPPINI, D. LUNATI (2000), Dimensione Ottima degli Ospedali in uno Stato Federale,
Economics Faculty, Lugano.
S. ECKERMANN (1994), Hospital productivity: a contradiction in terms?, In Harris, A. (ed.),
Economics of Health 1994: Proceedings of the Sixteenth Australian Conference of Health Econo-mists, Australian Studies in Health Service Administration series n.78. School of Health
Administration, University of New South West, pp. 167-181.
R. ELLIS (1992), Hospital costs function estimation when firms may not try to minimize
total costs, Manuscript. Boston University.
J.E. HARRIS (1990), The boren amendament: Medicaid reimbursement to hospital and nursing facilities,
B. HOLLINGSWORT, A. STREET (2006), The market for efficiency analysis of health care
or-ganizations, Health Economics, 15: 1055-1059.
R. JACOBS, P. SMITH, A. STREET (2006), Measuring efficiency in health care: analytical techniques and
health policy, Cambridge University Press.
P.G.N. KRAMERS (2003), The ECHI project: health indicators for the European Community,
European Journal of Public Health, 13: 101-106.
J.R. LAVE, L.B. LAVE (1970). Hospital cost function, America Review, 4: 165-180.
W. MEEUSEN, J. VAN DEN BROECK (1977), Efficiency estimation froma cobb-douglas
produc-tion funcproduc-tions with composed error, Internaproduc-tional Economic Review, 18: 435-444.
D. MORTIMER (2002), Competing methods for efficiency meaasurement: a systematic review of direct
DEA vs SFA/DEA comparison, Centre for Health Program Evaluation. Working Paper.
Monash Univerisity.
S. NAZIMI (2002). Do Competition and Managed Care Improve Quality? Health Economics,
11: 571-584.
OECD (1992), The Reform of Health Care: A Comparative Analysis of Seven OECD Countries.
Paris.
OECD (1994) The Reform of Health Care: A Comparative Analysis of Seventeen OECD Countries.
Paris, 1994.
A.E. POWELL, H.T.O DAVIES, R.G. THOMSON (2002). Using Routine Comparative Data to Assess
the Quality of Health Care: Understanding and Avoiding Common Pitfalls, Qual Saf
Health Care, 12: 122-128.
J. RICHMOND (1974), Estimating the Efficiency of Production, International Economic Review,
15: 515-521.
M. ROSKO, J. PROENCA (2005), Impact of network and system use on hospital X-efficiency,
Health Care Management Review, 30: 69-79.
M. ROSKO, R.L. MUTTER (2008), Stochastic frontier analysis of hospital inefficiency, Medical
Care Research and Review, 65: 131-166.
J.M.A. SMITS, J. DE MEESTER, M. DENG ET AL. (2003), Moratality Rates after Heart
Transplanta-tion: How to Compare Center-specific Outcome Data. Transplantation, 75: 90-96.
R. SUDGEN, A. WILLIAMS (1978), The principles of practical cost-benefit analysis, Oxford University
Press.
J.D. THOMPSON, F.B. FETTER, C.D. MROSS (1975), Casemix and resource use, Inquiry, XII
De-cember, 300-312.
R. TVETERAS, G.E. BATTESE (2006), Agglomeration externalities, productivity and technical
inefficiency, Journal of Regional Science, 46: 605-625.
H. WANG, P. SCHMIDT (2002), One-step and two-steps estimation of the effects of
exogene-ous variables on technical efficiency levels, Journal of Productivity Analysis, 18: 129-144.
J. WANG (2001), Estimation of Hospital Cost Functions and Efficiency Measurement: an
Overview, China Center for Economic Reserch, Working Papers Series, No. E2001004.
A. WOUTERS (1993), The cost and efficiency of public and private health care facilities in
Ogun State, Nigeria, Health Economics, 2: 31-42.
SUMMARY
Efficiency indicators versus forntier methods: an empirical investigation of italian public hospitals
Efficiency has a key-role in the measurement of the impact of the National Health Service (NHS) reforms. We investigate the issue of inefficiency in health sector and pro-vide empirical epro-vidence derived from Italian public hospitals. Despite the importance of efficiency measurement in health care services, only recently advanced econometric methods have been applied to hospital data. We provide a synoptic survey of few empiri-cal analyses of efficiency measurement in health care services. An estimate of the cost ef-ficiency level in Italian public hospitals during 2001-2003 is obtained through a sample. We propose an efficiency indicator and provide cost frontiers for such hospitals, using stochastic frontier analysis (SFA) for longitudinal data.