Department of Computer Science
Ph.D. Thesis
Dynamic Detection and Tracking of Composite
Events in Wireless Sensor Networks
Claudio Francesco Vairo
Supervisors:
Stefano Chessa and Giuseppe Amato
1 Introduction 1
1.1 Static Event Detection . . . 2
1.2 Mobile Event Detection and Tracking . . . 4
1.3 Outline of the Thesis . . . 4
2 Related Work 7 2.1 Monitoring of Static Events with WSN . . . 7
2.1.1 Directed Diffusion . . . 8
2.1.2 Cougar . . . 13
2.1.3 TinyDB . . . 14
2.2 Detection and Tracking of Mobile Events with WSN . . . 19
2.2.1 Distributed Cooperation for Event Detection . . . 23
2.2.2 Composite Event Detection . . . 24
2.2.3 ZebraNet . . . 26
3 Monitoring Static Events with MaD-WiSe 29 3.1 Design Goals and Assumptions . . . 30
3.2 Query Language . . . 31
3.2.1 MW-SQL Syntax . . . 33
3.3 Query Processing Model . . . 34
3.3.1 Streams . . . 34
3.3.2 Operators of the query algebra . . . 36
3.4 Architecture . . . 40
3.4.1 Client-Side . . . 40
3.4.2 Network-Side . . . 42
3.4.3 Energy Efficiency in MaD-WiSe . . . 44
3.5 Execution of a query: a walk-through example . . . 46
3.6 Query optimization and results . . . 48
4 Detection and Tracking of Mobile Events 57 4.1 Modeling Events as Query-able Data . . . 57
4.2 Declarative Language for Event Detection, Tracking, and Querying . 59 4.2.1 Event statement . . . 59
4.2.2 Detection Statement . . . 61
4.2.3 Tracking Statement . . . 63
4.2.4 Query Statement . . . 64
4.3 In-network Event Query Processing . . . 65
4.3.1 Detection Task . . . 65
4.3.2 Tracking Task . . . 66
4.3.3 Query Execution . . . 69
4.4 Finite State Machine . . . 70
4.4.1 Detection State Refinement . . . 72
4.4.2 Tracking State Refinement . . . 73
4.5 Evaluation of EQL . . . 73
4.5.1 Cost Model . . . 74
4.5.2 Network, Event and Simulation Model . . . 74
4.5.3 Cost of Event Query Language . . . 75
4.5.4 Cost of CQA . . . 79
4.5.5 Results . . . 81
5 Conclusions 97
2.1 A simplified schematic for directed diffusion. . . 9
2.2 Cougar Query Plan at a source sensor. . . 12
2.3 Cougar Query Plan at the leader. . . 13
2.4 A query and results propagating through the network.§ . . . 15
2.5 A semantic routing tree in use for a query. Gray arrows indicate flow of the query down the tree; gray nodes must produce or forward results in the query. . . 19
2.6 Network architecture in Composite Event Detection. . . 25
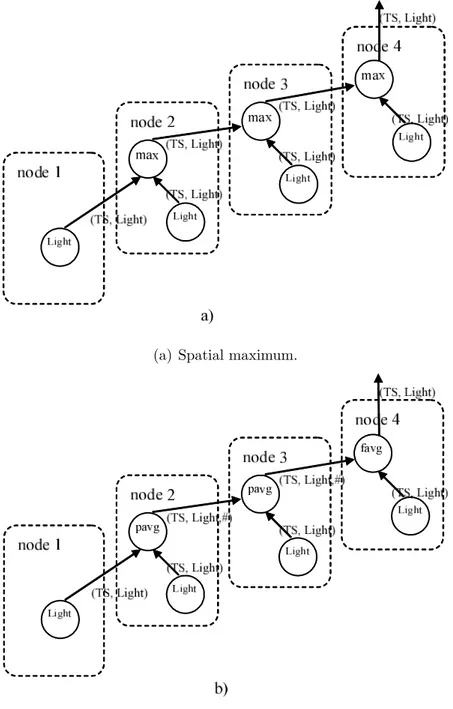
3.1 Example of query execution plans for the spatial maximum (a) and for the spatial average (b). Spatial average uses two different operators: pavg (partial average) and favg (final average) . . . 38
3.2 Using the join operator, both sensor streams T and L should be pe-riodic. Using the sync-join, the L sensor stream can be on-demand, i.e. it is activated only when needed . . . 39
3.3 The architecture of MaD-WiSe. . . 41
3.4 Energy efficiency mechanism. . . 45
3.5 Performance of the MaD-WiSe energy efficiency mechanism. . . 46
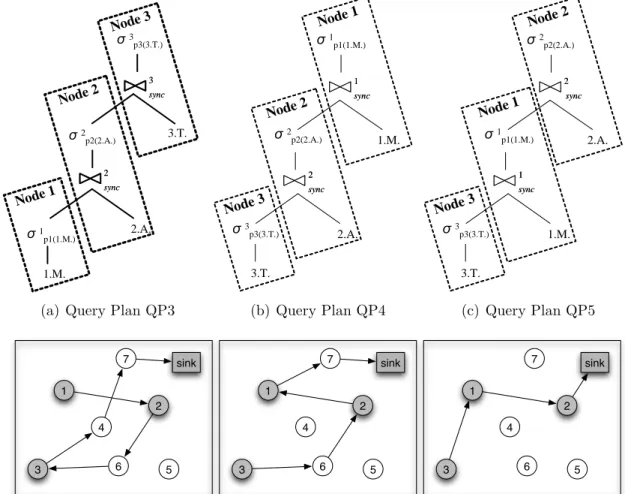
3.6 Three possible execution plans for the same query. . . 51
3.7 Three possible execution plans for the same query using joins. . . 52
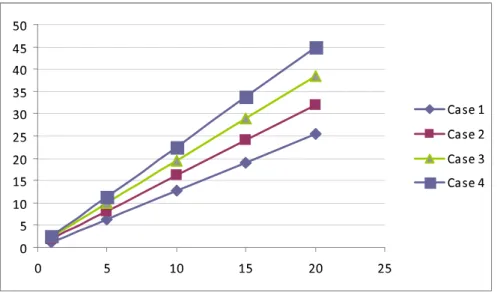
3.8 Cost of the query plan QP5 as the distance in hop between the sensors increases. . . 56
4.1 Detection Region - In the figure the external rectangle represents the Detection Region where the event is monitored, the dotted cir-cle represents the minimum expected size of the event (the Smallest Event Size that in this case is 1 hop) related to the sensor repre-sented with the big black spot, and the cloud represents the actual area covered by the event when it occurs (the Event Area). . . 60
4.2 Tracking phase - The figure shows the data collection tree built inside the Event Area. The tree is rooted in the leader sensor, rep-resented as the rounded circle. The figure also shows the updating operation: the active boundary sensors (the empty squares) alert the passive boundary sensors (the triangles). As a consequence, the pas-sive boundary sensors are added to the data collection tree. The alert operation is represented by the dotted arrows. . . 69 4.3 Automaton - Abstract representation of the Finite State
Automa-ton for EQL processing. The detection and tracking states are com-plex super-states that are composed of several internal states. . . 70 4.4 Detection State Refinement - The Figure reports the
refine-ment to the detection super-state of the FSA reported in Figure 4.3. The dotted lines represent the input/output transitions to/from the detection super-state. . . 71 4.5 Tracking State Refinement- The dotted lines represent the
in-put/output transitions to/from the tracking super-state. The dotted outgoing line related to the “sending data to sink” state is . . . 72 4.6 Network - Each sensor has a transmission range rx. The small
square represents the Detection Region. The circle represents the Event Area, and it moves according to the rectilinear motion vector V .The sink is assumed to be in the center of the network. . . 75 4.7 First Alert- The solid circle is the Event Area with radius R. The
dotted circles represent the transmission of the alert messages and the triangles are the alerted sensors. . . 77 4.8 Alert- The added sensors send the alert message. . . 78 4.9 Tree Updating- The solid circle represents the Event Area at time
t+∆t, while the dotted circle represents the Event Area at time t. The newly involved sensors in the lune are added to the data collection tree (the dotted arrows). . . 79 4.10 Power consumption with increasing values of event speed and different
values of expiration time. . . 81 4.11 Power consumption with increasing values of event speed and different
values of network density. . . 82 4.12 Power consumption with increasing value of event speed and different
size of Event Area. . . 83 4.13 Simulation with increasing values of sampling rate of the sensors and
different values of event speed. . . 84 4.14 Power consumption with increasing size of the Event Area and
differ-ent values of expiration time. . . 85 4.15 Power consumption with increasing size of the Event Area and
differ-ent values of network density. . . 86 4.16 Maximum energy consumption of the sensors with increasing values
4.17 Maximum energy consumption of the sensors with increasing values of sampling rate of the sensors. . . 88 4.18 Maximum energy consumption of the sensors with increasing size of
Event Area. . . 89 4.19 Percentage of successful tracking with increasing size of the Event Area. 90 4.20 Percentage of successful tracking with increasing values of network
density. . . 91 4.21 Percentage of successful tracking with increasing values of expiration
time. . . 92 4.22 Percentage of successful tracking with increasing values of event speed
and different values of expiration time. . . 93 4.23 Power consumption with increasing value of the expiration time. . . . 94 4.24 Percentage of successful tracking with increasing values of the event
speed and different values of sampling rate of the sensors (a) and with increasing size of Event Area and different values of network density (b). . . 95
2.1 An example of description of an animal tracking task. . . 10
2.2 An example of data generated by an animal tracking task. . . 10
2.3 An example of an initial interest of an animal tracking task. . . 10
2.4 A data message containing an event description in response to an animal tracking task. . . 12
2.5 An example of TinyDB query. . . 16
2.6 An example of event-based query in TinyDB. . . 16
3.1 An example of a query executing a timestamp Join in MW-SQL. This is different from standard SQL, where the FROM clause indicates a cartesian product, since here the FROM clause indicates a timestamp join among sources by default. . . 39
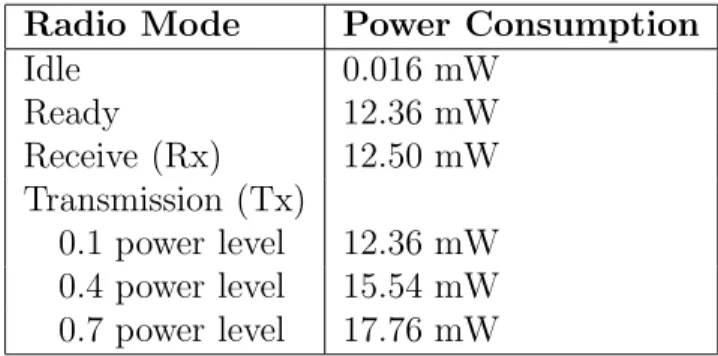
3.2 Power Consumption of the radio of an IRIS mote. . . 42
3.3 Query used for the query execution and optimization example. The query performs a timestamp join between Magnetism, Acceleration, and Temperature readings from nodes 1, 2, and 3, respectively, every three seconds. If predicates p1, p2, and p3 are satisfied, results are sent to the sink . . . 48
3.4 Costs of the three executions plans in Figure 3.6. . . 51
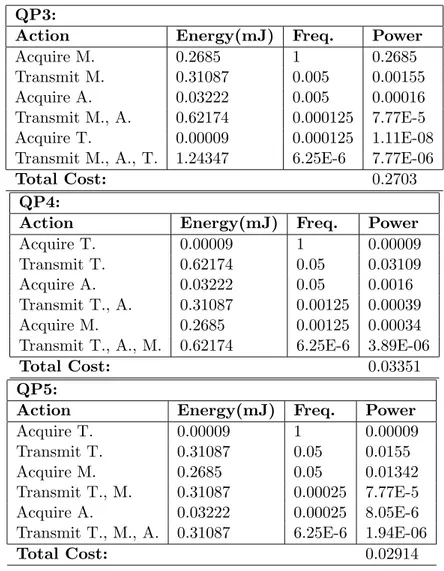
3.5 Cost of the query plans QP3, QP4, and QP5. . . 53
3.6 Costs of QP3, QP4, and QP5 obtained from the experiments. . . 54
4.1 Example of an explosion event description. tA, tN and tP are given threshold values for, respectively, accelerometer, noise and pressure measurements. . . 58
4.2 The query requests the position and the event speed GasCloud. . . . 58
4.3 The Event Statement . . . 61
4.4 The Explosion definition. . . 61
4.5 The GasCloud definition. . . 61
4.6 The Detection Statement. . . 62
4.7 The detection definition for the Explosion event. . . 62
4.8 The detection definition for the GasCloud event that depends on the Explosion event. . . 63
4.10 The Tracking Statement for the GasCloud . . . 64
4.11 The Query Statement . . . 64
4.12 The Query statement for the Gas Cloud example. . . 64
4.13 Glossary of the definitions related to the events. . . 69
4.14 Energy required for a sample from various transducers of MTS310CA boards. . . 74
4.15 Energy required for sending and receiving a message of 50 bytes on the IRIS mote. . . 74
4.16 Fixed parameters used for the analysis. . . 76
4.17 Variable parameters used for the analysis. In each scenario we study the behavior when changing one of these parameters and keeping the others fixed. . . 76
Introduction
Wireless Sensor Networks (WSN) [16] are a recent technology suitable for contin-uous and unattended monitoring of a large variety of environments. They play an important role in many application fields, including environmental monitoring, dis-aster area monitoring, structure and people health monitoring, ambient assistant living, home applications, surveillance and security.
Ambient Assisted Living (AAL) [33] is an example of a recent application field for WSN. AAL aims at improving the quality of life of elderly people, by increasing their autonomy, assisting them in their daily activities, and by enabling them to feel included, secure, protected and supported. In AAL applications, WSN are used to monitor the status of the people and environmental parameters of their homes, offices etc. WSN suit very well these applications since they require limited maintenance and they can be adapted and hidden very well in the environment due to their small size.
Another important application of WSN is in the recovery from environmental disasters [58]. In this scenario, WSN can be used to monitor areas that are not accessible by humans and can provide real-time support to emergency management teams operating in the field. In these applications, WSN are appreciated due to their ease of deployment and to the self-organization capability of the sensors.
WSN can also be effectively used in Structure Health Monitoring (SHM) [24]. This application serves as a precaution measure, and it can have great social and economical impact. The goals of SHM systems include detecting, localizing, esti-mating the extent of the damage and predicting the residual life of the structure. The advantages of using WSN in SHM applications are their low deployment and maintenance cost, their large physical coverage and their high spacial resolution.
A WSN is composed by a (possibly) large number of sensors, that can be easily deployed in the environment (sensing field), and that self-organize to form a (multi-hop) wireless network. The sensors can be programmed to sample parameters of the surrounding environment, to process sampled data, and to forward this infor-mation to a special sensor (called sink ) that provides connectivity with external networks. In typical applications, sensors are tiny microsystems that comprise a
low-performance processor, a limited amount of RAM (few KBs), a set of transduc-ers, and a low-power radio transceiver (in most cases, the radio is compliant with the IEEE 802.15.4 standard [1]). In most cases the sensors are battery powered, although in some cases they make use of energy harvesting techniques to gather energy from the environment [55, 48, 52, 31]. As a consequence, sensors have se-vere computational and storage constraints, and energy efficiency is critical in most applications. Furthermore, if they are powered by batteries, their lifetime is limited. Programming WSN to execute specific application dependent tasks is still a rel-evant issue. In fact, programming sensors requires non trivial skills of embedded systems programming, massively distributed algorithms, and wireless communica-tions. To address this issue, recent proposals [69, 40, 38] suggest the use of database paradigms and declarative languages (generally SQL-like) to specify WSN tasks. In a traditional database system, queries are used to search for data contained in per-sistent storage repositories. In a WSN, the database consists of the environmental data that can be measured/acquired by the transducers available on the sensors. Queries instruct the sensors on the management, filtering, and processing of the data acquired from the environment. Environmental data are thus acquired by the transducers of the sensors whenever needed, in accordance with the query that the network is processing.
However, the classical approaches to database management systems cannot be applied as such to WSN, where state-of-the-art processing units are characterized by very restrictive resource constraints. Hence most of the aspects related to database systems have to be reinterpreted according to this purpose, and this gave rise in the recent years to a rich research area.
This thesis fits this research trend and provides two main contributions:
• describes the static event detection problem in WSN and presents a solution, the MaD-WiSe system, that efficiently addresses this problem by means of a distributed query processor executed on the sensors of the network. The results of this work are published in [12], [13].
• extends the query processing approach to the mobility context. To this pur-pose this thesis defines the concept of composite mobile event in a WSN, describes the problem of detecting and tracking such events, and presents an approach, based on a high-level query language, to describe event tracking tasks. Tracking tasks expressed by means of queries can be executed in an automatic and dynamic manner, inside the WSN. The results of this work are published in [62], [11].
1.1
Static Event Detection
Event detection is one of the application fields where WSN are commonly used. In this case the WSN is typically configured in order to continuously collect
environ-mental data, that are sent to the sink where they are analyzed to detect the event. Since the amount of collected data can be considerably large, sending all the data to the sink may result in very inefficient and expensive tasks, especially in terms of energy consumption. This cost can be reduced by executing part of the data anal-ysis and filtering directly on the sensors, thus reducing the communication costs. However, this approach requires programming more complex tasks on the sensors, involving data acquisition, analysis, communication, storage, etc., and this also in-creases the possibility of introducing programming errors. For this reason, recent proposals introduce abstraction mechanisms for the sensors’ hardware, in order to facilitate the programming of distributed applications over the WSN. In particu-lar, in the last few years, several approaches [28, 69, 40, 38] suggest the use of the database paradigm in WSN, and provide high-level SQL-like languages to specify monitoring tasks. With these solutions, the user can thus focus on his needs (what he wants from the WSN), rather than concerning on how the monitoring task should be implemented. In this thesis we introduce the MaD-WiSe system, our solution to address the problems of efficiently managing data and detecting static events in WSN.
MaD-WiSe is a system for data management in WSN that can efficiently detect static events. It exploits a query language based on SQL, with constructs specialized for WSN, to define the monitoring task. A query defined with this query language expresses the sensing activity to be performed, its timings, and the sensors and transducers involved in it. In support to the query language, MaD-WiSe defines data streams and a query algebra to model the query plan for each sensor. Streams are used to implement both data acquisition and data transfer among sensors, and the query algebra introduces operators that represent aggregation and/or filtering operations on data streams. A query is thus translated into a distributed query plan consisting of operators of the query algebra connected by streams. In order to reduce the energy consumption of the query, MaD-WiSe exploits query optimiza-tion strategies and energy efficiency techniques based on the synchronizaoptimiza-tion of the sensors to reduce their periods of activity.
The contributions of this thesis to MaD-WiSe are:
• evaluation of the performance of the system and experimentation of new au-tomatic optimization techniques;
• definition of strategies for the energy efficiency, based on a cross-layer method that extract from the query information about the sampling rate and use this information to synchronize the network and MAC level activities of the sensors; • a revised query processing model and a redesigned architecture, based on the
previous contributions.
MaD-WiSe is implemented in Java and TinyOS [4] for the Crossbow Mica platform [5], and it is presented in Chapter 3.
1.2
Mobile Event Detection and Tracking
Query languages defined to monitor static events in WSN assume that the monitored events do not move, and that they maintain their physical properties (shape, size, etc...) for the whole duration of the query execution (for example, monitoring the temperature in a room, or the health conditions of a building). However there are events that move, or change their size or shape (for example a fire in the wood, or a person moving in the environment). These systems are no longer efficient in tracking this kind of events, since the query needs to be updated to be able to adapt to the changing event. In addition, in traditional query language approaches, the query addresses only specific sources, such as individual transducers on the sensors. On the other hand, the user may be interested in high-level information about the tracked event. For example the user may be interested in the speed and direction of a moving event, rather than on data read from transducers.
In this thesis, we aim at achieving the following goals:
• provide a higher-level of abstraction as compared to the current approaches, for the detection and tracking of events in WSN;
• express queries directly on events, rather than on specific sensors or transduc-ers in the WSN;
• provide a mechanism for an efficient detection and automatic and dynamic tracking of mobile events in WSN.
In the second part of this thesis (Section 4) we enhance the MaD-WiSe approach and we propose a new mechanism to efficiently detect and track mobile events in WSN. To this purpose, we model the concept of composite event in a WSN and we define a new query language, called Event Query language (EQL), for the detection and tracking of mobile events in WSN. Unlike other approaches, with EQL the user can specify a tracking task that, once injected in the network, instructs the sensors on how to cooperatively and autonomously detect and track an event, and on how to dynamically and autonomously migrate the needed query processing tasks in the network as the event moves. We also propose a query processing mechanism for the efficient execution of EQL queries directly in the sensors. We show through simulation that the proposed approach has a lower overhead, and that it scales better with the mobility of the tracked events, as compared to a centralized query approach where the sensors acquire the data and send them to a base station that performs the detection and pilots the tracking of the event.
1.3
Outline of the Thesis
The rest of the thesis is organized as follows. Section 2 presents the state of the art on data management in WSN related to the detection of static events and to
the tracking of moving events. Section 3 is focused on the problem of detecting static events and it describes the MaD-WiSe system, presenting an evaluation of the optimization strategies in MaD-WiSe. Section 4 focuses on the detection and tracking of moving events and it presents the EQL language and the query processing mechanism for the efficient execution of EQL queries. It also includes an evaluation of the proposed system and the comparison with a centralized query approach. Finally, Section 5 draws the conclusions.
Related Work
2.1
Monitoring of Static Events with WSN
Directed Diffusion [28] was the first attempt to define a data management paradigm in WSN. In Directed Diffusion the user queries the network by injecting interests, associated with a sampling rate, that are broadcasted to all sensors in the network. Data detected by the sensors that match a requested interest are propagated to the sink through the network.
Paradigms integrating database management systems and WSN are the natural evolution of Directed Diffusion. These paradigms use query languages (such as SQL, for instance) to program the sensing task and translate the queries into query plans executable by the sensors. Among the various proposals pursuing this approach, pioneers and (to some extent) state of the art are considered Cougar [69], and TinyDB [40]. The differences between these approaches are in the expressiveness of the query language and on different assumptions on the network architecture.
Cougar [69] is a sensor database that integrates stored data (e.g. characteristics of sensors and their position) and sensor data. Sensor data are physical environment measurements acquired by the sensors, that are sent to the sink as consequence of a query request. In TinyDB [40] all nodes execute locally the same query and the results of the query are merged while they flow from the sensors to the sink. TinyDB can process aggregate queries on data produced by several sensors (spatial aggregation). In [25] TinyDB is extended to support the localization of the sensors, thus enabling the execution of spatial queries, besides the standard ones.
DsWare [72] is another database-like abstraction that is tailored to sensor net-works based on event detection. It provides more flexibility by supporting group-based decision, reliable data-centric storage, and implementing a mix of approaches to improve real-time execution performance, reliability of aggregated results and reduce network communication (overhead). DsWare provides applications with ser-vices supported by its architecture modules such as data storage, data caching, group management, event detection, data subscription, and scheduling. Like Cougar [69],
DsWare uses SQL-like language for the registration and cancellation of events. In [38] a PCM-based (probabilistic compensation model) data transmission scheme is proposed to compensate the possible loss of data in executing aggregate queries. An efficient path selection algorithm is also presented, in which children select the most effective parents to send messages, in order to reduce the communication traffic cost while maintaining variance low.
liveSensor [43, 45] is a system that exploits the approach of XML enrichment in order to provide the user with the required semantics to express powerful queries. liveSensor uses XML metadata to describe the data stream, and it provides the user with a high level query interface to deal with XML queries. These queries are transformed from XML to lower level primitives that execute on raw sensor streams. In [75] the authors model the WSN as a distributed database that can be queried to access data generated by the sensor nodes. They develop an algorithm for communication-efficient implementation of joining multiple data streams. In par-ticular, their algorithm is based on the Perpendicular Approach (PA), which is communication-efficient and load-balanced, and has nearly optimal communication cost for binary joins in grid networks under the assumption of uniform generation of tuples across the network. PA works by using appropriately defined horizontal and vertical paths for tuple storage and join-computation, respectively. The approach is able to efficiently incorporate joins with spatial constraints, and can be generalized to sensor networks without location information.
In [17] the authors propose a framework to create and integrate light databases within sensors to manage and process data. The databases are designed by means of simple entity-relationship models from which the code needed to manage the database is automatically generated. This code is composed of data structures and the algorithms in charge of managing them. This architecture helps developers to avoid data redundancy, thus enabling a better management of the sensor’s memory, and it contributes to save time in application development.
In the next sub-sections we describe in detail those works that are more inti-mately related to this thesis.
2.1.1
Directed Diffusion
Directed Diffusion [28] proposes a data-centric dissemination paradigm for WSN. Data generated by sensors are named by attribute-value pairs. A sensing task is disseminated throughout the sensor network as an interest for named data. This dissemination sets up gradients within the network designed to “draw” events (i.e., data matching the interest). Events start flowing towards the originators of interests along multiple paths. The sensor network reinforces one, or a small number of these paths. Figure 2.1 illustrates these elements. A detection task that uses the directed diffusion paradigm can be implemented as follows: the user’s query is transformed into an interest that is injected in a given region of the network. When a sensor in that region receives the interest, it starts acquiring the information needed to detect
(a) Interest propagation.
(b) Initial gradients set up.
(c) Data delivery along reinforced path.
Figure 2.1: A simplified schematic for directed diffusion.
the event defined in the query. When the sensors detect the requested event, they return the collected information about the event along the reverse path of interest propagation. Intermediate sensors might aggregate the data by combining reports from several sensors.
Naming
In directed diffusion, task descriptions are named by a list of attribute-value pairs that describe a task. For example, a task for animal tracking might be described as in Table 2.1.
type = four-legged animal // detect animal location
interval = 20 ms // send back events every 20 ms duration = 10 seconds // .. for the next 10 seconds rect = [-100, 100, 200, 400] // from sensors within rectangle
Table 2.1: An example of description of an animal tracking task.
reason, such a task description is called an interest. The data sent in response to interests are also named using a similar naming scheme. For example, a sensor that detects an animal might generate the data shown in Table 2.2:
type = four-legged animal // type of animal seen instance = elephant // instance of this type location = [125, 220] // node location
intensity =0.6 // signal amplitude measure confidence =0.85 // confidence in the match timestamp = 01:20:40 // event generation time Table 2.2: An example of data generated by an animal tracking task.
Interests and Gradients
An interest is usually injected into the network at the sink node. Then it is diffused through out the sensor network in the following way. For each active task, the sink periodically broadcasts an interest message to its neighbors. The initial interest contains the specified rect and duration attributes, but contains a much larger intervalattribute (for example, 1 event per second). Intuitively, this initial interest may be thought of as exploratory; it tries to determine if indeed there are any sensor nodes that detect the specified event. The desired data rate is achieved by reinforcement. Then, the initial interest may take a form as shown in Table 2.3:
type = four-legged animal interval = 1s
rect = [-100, 200, 200, 400] timestamp = 01:20:40
expiresAt = 01:30:40
Table 2.3: An example of an initial interest of an animal tracking task. The sink periodically refreshes the interest by resending the same interest with a monotonically increasing timestamp attribute. This is necessary because interests are not reliably transmitted through-out the network.
Every node maintains an interest cache. Each item in the cache corresponds to a distinct interest. Two interests are distinct if their type attribute differs, their
interval attribute differs, or their rect attributes are disjoint. An entry in the interest cache has several fields. A timestamp field indicates the timestamp of the last received matching interest. The interest entry also contains several gradient fields, up to one per neighbor. Each gradient contains a data rate field requested by the specified neighbor, derived from the interval attribute of the interest. It also contains a duration field, derived from the timestamp and expiresAt attributes of the interest, indicating the approximate lifetime of the interest. When a node receives an interest, it checks if the interest exists in the cache. If no matching entry exists, the node creates an interest entry. The parameters of the interest entry are instantiated from the received interest. This entry has a single gradient towards the neighbor from which the interest was received, with the specified event data rate. In the example above, a neighbor of the sink sets up an interest entry with a gradient of 1 event per second towards the sink. If there exists an interest entry, but no gradient for the sender of the interest, the node adds a gradient with the specified value. It also updates the entry’s timestamp and duration fields appropriately. Finally, if there exists both an entry and a gradient, the node simply updates the timestamp and duration fields. When a gradient expires, it is removed from its interest entry. After receiving an interest, a node may decide to send again the interest to some subset of its neighbors. To its neighbors, this interest appears to originate from the sending node, although it might have come from a distant sink. In this manner, interests diffuse throughout the network. Not all received interests are sent more than once. A node may suppress a received interest if it recently re-sent a matching interest.
Data Propagation
A sensor that detects a target searches its interest cache for a matching interest entry. In this case, a matching entry is one whose rect encompasses the sensor location, and the type of the entry matches the detected target type. When it finds one, it computes the highest requested event rate among all its outgoing gradients. The node activates its transducers and generates event samples at this highest data rate. In the example, this data rate is initially 1 event per second. Then, every second, the source sends a data message to each neighbor for whom it has a gradient, containing an event description, as shown in Table 2.4:
A node that receives a data message from its neighbors attempts to find a matching interest entry in its cache. If no match exists, the data message is dropped. If a match exists, the node checks the data cache associated with the matching interest entry. This cache keeps track of recently seen data items to prevent loops. If a received data message has a matching data cache entry, the data message is dropped. Otherwise, the received message is added to the data cache and the data message is re-sent to the node’s neighbors.
type = four-legged animal // type of animal seen instance = elephant // instance of this type location = [125, 220] // node location
intensity =0.6 // signal amplitude measure confidence =0.85 // confidence in the match timestamp = 01:20:40 // event generation time
Table 2.4: A data message containing an event description in response to an animal tracking task. In-network aggregation Network interface Sensor scan Partially aggregated data from other sensors
Data from the local sensor Towards the leader
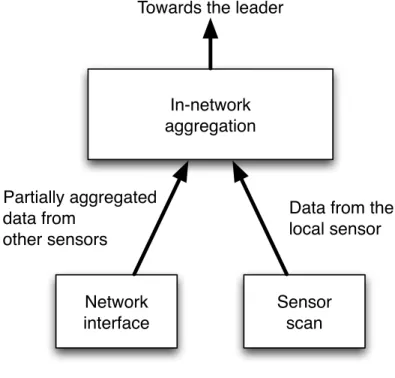
Figure 2.2: Cougar Query Plan at a source sensor.
Reinforcement
After the sink starts receiving the low data rate events, it reinforces its neighbors in order to “draw down” higher quality (higher data rate) events. To reinforce a neighbor, the sink resends the original interest message but with a smaller interval, for example 10ms. When a neighboring node receives this interest, it notices that it already has a gradient towards this neighbor, and that the sender’s interest specifies a higher data rate. If this new data rate is also higher than that of any existing gradient, the node also reinforces its neighbors. Through this sequence of local interactions, a path is established from source to sink for the transmission of high data rate events.
Select AVG > threshold Aggregate Operator (AVG) Network Interface Towards the gateway
Average value
Partially aggregated results
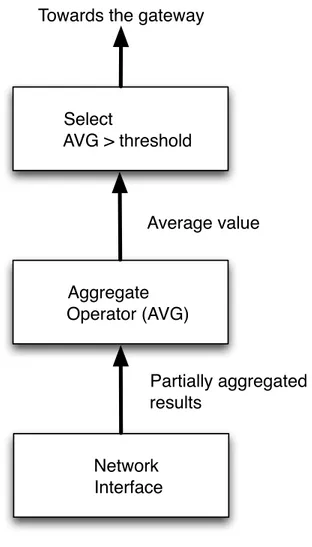
Figure 2.3: Cougar Query Plan at the leader.
2.1.2
Cougar
Cougar [69] is one of the first works integrating the database approach to WSN. To enable declarative querying of sensor networks, Cougar proposes a query layer consisting of a query proxy running on every sensor node. The Cougar architecture on the sensors is composed of three layers: the network layer, the query proxy layer and the application layer. The query proxy provides higher-level services through queries that can be injected into the network from a specified gateway node. In order to reduce the energy consumption, one of the main roles of the query proxy is to perform in-network processing.
A query optimizer is located on the gateway node to generate distributed query processing plans after receiving queries from the outside. The query plan is created according to catalog information and the query specification. Such a query plan specifies both the data flow (between sensors) and an exact computation plan (at
each sensor). The plan is then disseminated to all relevant sensor nodes. Control structures are created to synchronize sensor behavior, and the query is started. At run-time, data records flow back to the gateway node as in-network computation happens on-the-fly.
In order to illustrate the individual components of the architecture in more detail, consider the following example: a long-running query Q monitoring the average temperature of an office every t seconds. The query Q has to notify the user (i.e., Q generates an output record) if the average temperature in the office is greater than t. As a first step in evaluating the query, the query optimizer generates a query plan QP that specifies how to determine the leader of this query, a designated node where the computation of the average temperature will take place. The leader could be a fixed sensor with more remaining power and energy, or a randomly selected node by some distributed leader election algorithm. Two computation plans are then produced, one for the leader node, and a second plan for the remaining nodes in the query region.
Figure 2.2 shows the query plan for a non-leader node that participates in the query. Non-leader nodes have a scan operator to sample transducers readings peri-odically and to send them to the leader node. In addition, their plan contains an aggregation operator to aggregate data from other sensors. Figure 2.3 shows the query plan for the leader node, which contains an AVG operator to compute the average value over all sensor readings received in the last round of the query, and a SELECT operator that checks if the result is above the threshold.
At query start time, the generated query plans are disseminated to the query proxies of all relevant sensor nodes. The query proxies registers the query, create a local operator tree, active relevant transducers, and return records according to the specification of the query plan. The leader generates a record only if the average temperature is above the user-defined threshold.
2.1.3
TinyDB
TinyDB [40] is a distributed acquisitional query processor for data collection in sen-sor networks. By focusing on the locations and costs of acquiring data, TinyDB al-lows to reduce power consumption compared to traditional passive systems. TinyDB operates at all levels of query processing: in query optimization, in query dissemina-tion, and in query execution. It also inherits a lot of features and optimizations of a traditional query processor (e.g., the ability to select, join, project, and aggregate data). Figure 2.4 illustrates the basic architecture of TinyDB: user submits a query at the sink, where the query is parsed, optimized, and disseminated in the WSN. In turn, the sensors process the query and send the results back to the sink, through the routing tree that was formed during the query dissemination.
SELECT nodeid, light FROM SENSORS PC Mote 1 Result 28 2 55 3 48 Query FIELDS nodeid light OPS NULL 3 48 2 55 Result Result
Figure 2.4: A query and results propagating through the network.§ Data Model
In TinyDB, sensor tuples belong to a table sensors which, logically, has one row per node per instant of time, with one column per attribute (e.g., light, temperature, etc.) that the device can produce. Records in this table are put (i.e., acquired) only as needed to satisfy the query, and are usually stored only for a short period of time or delivered directly to a terminal outside the network. Sensors can insert NULLs for attributes corresponding to missing transducers. Physically, the sensors table is partitioned across all of the devices in the network, with each device producing and storing its own readings. Thus, to compare readings from different sensors, those readings must be collected at some common node, for example, the sink.
Basic Language Features
Queries in TinyDB consist of a SELECT-FROM-WHERE-GROUPBY clause supporting selection, join, projection, and aggregation, just as in SQL, with the same semantic. Tuples are produced at well-defined sample intervals that are a parameter of the query. The period of time between two consecutive sample periods is called epoch. An example of TinyDB query is shown in Table 2.5:
SELECT nodeid, light, temp FROM sensors
SAMPLE PERIOD 1s FOR 10s
Table 2.5: An example of TinyDB query.
A sensor executing the query in the table returns (i.e. it put the data information in the virtual table sensors) its own identifier, light, and temperature readings once per second for 10 s. The output consists of a stream of tuples, clustered into 1-s time intervals. Each tuple includes a time stamp corresponding to the time it was produced. When a query is issued in TinyDB, it is assigned an id that is returned to the issuer and it is used to identify data related to a particular query.
TinyDB also includes support for grouped aggregation queries: as data from an aggregation query flows up the tree, it is aggregated in-network according to the aggregation function and value-based partitioning specified in the query. However it cannot execute queries that relate and compare in-network data acquired by different sensors (for instance, to check if the temperature in room 1 is greater than that in room 2).
Event-Based Queries
TinyDB supports events as a mechanism for initiating data collection. Events in TinyDB are generated explicitly, either by another query or by a lower-level part of the operating system (in which case the code that generates the event must have been compiled into the sensor node).
ON EVENT bird-detect(loc):
SELECT AVG(light), AVG(temp), event.loc FROM sensors AS s
WHERE dist(s.loc, event.loc) < 10m SAMPLE PERIOD 2s
FOR 30s
Table 2.6: An example of event-based query in TinyDB.
For example, the query in Table 2.6 reports the average light and temperature level at sensors near a bird nest where a bird has just been detected. Every time a bird-detect event occurs, the query is issued from the detecting node and the average light and temperature are collected from nearby nodes once every 2 s for 30 s. In this case, it is assumed that bird-detection is done via some low-level operating system facility, such as a switch that is triggered when a bird enters its nest.
Metadata Management
Before queries are disseminated, the sink performs a simple query optimization phase to choose the ordering of sampling, selections, and joins that minimizes the power consumption. Each node in TinyDB maintains a catalog of metadata that describes its local attributes, events, and user-defined functions. This metadata is periodically copied to the sink to be used by the optimizer. Event metadata consists of a name, a signature, and a frequency estimate that is used in query optimization. User-defined predicates also have a name and a signature, along with a selectivity estimate which is provided by the user himself. Metadata associated with node attributes are: how much energy and time are required to sample this attribute, if this attribute is constant or variable, what range this attribute can take on, how fast this attribute can change. The catalog also includes names of aggregates and pointers to their code. Each aggregate consists of a triplet of functions, that initialize, merge, and update the final value of partial aggregate records as they flow through the system. TinyDB also stores metadata information about the costs of processing and delivering data. Power-Based Query Optimization
Sampling is a more expensive operation, in terms of energy consumption, than executing an operator. However, if a predicate is required to be evaluated over an attribute of a sensor node, the corresponding transducer must be activated to execute the sampling. On the other hand, if a predicate discards a tuple of the sensors table, then subsequent predicates do not need to examine the tuple, so the cost of sampling any attributes referenced in the subsequent predicates can be avoided. Thus, ordering carefully the expensive operators, can save energy. In order to efficiently order the predicates, TinyDB considers two problems: (a) an attribute may be referenced in multiple predicates, and (b) expensive predicates are only on a single table, sensors. The first point introduces some subtlety, as it is not clear which predicate should be “charged” with the cost of the sample.
To model this issue, TinyDB handles the sampling of a sensor as a particular operator, τ , that is scheduled along with the predicates, p. TinyDB deals the prob-lem of determining the minimum-cost order of predicates and sampling operations, under the constraint that τi must precede pj if pj references the attribute sampled
by τi. The proposed solution is as follows: (a) data are acquired only when any
predicate over that data must be evaluated, unless it was already sampled in or-der to evaluate a previous predicate; (b) if a query requires two or more sampling operations, they are performed in ascending order of sampling energy.
Dissemination and Routing
After the query has been optimized, it is disseminated into the network; dissemi-nation begins with a broadcast of the query from the sink. As a node receives the query, it decides whether the query applies locally and/or whether it needs to be
broadcast to its children in the routing tree. We say a query q applies to a node n if there is a nonzero probability that n will produce results for q. If a query does not apply at a particular node, and the node does not have any children for which the query applies, then the entire subtree rooted at that node can be excluded from the query, saving the costs of disseminating, executing, and forwarding results for that query. In order to address the problem of determining when a node or its children need not participate in a particular query, TinyDB uses a data structure called a semantic routing tree (SRT), that maintains information about child attribute val-ues. With SRT a node can determine whether none of its children currently satisfy the value of some selection predicate, for example, because they have constant (and known) attribute values outside the predicate’s range.
Conceptually, an SRT is an index that can be used to locate nodes that have data relevant to the query. When a query q with a predicate over a constant attribute A arrives at a node n, n checks if any of the values related to A and produced by its children overlap the query range of A in q. In this case, it prepares to receive results and forwards the query. Otherwise, the query is not forwarded. Moreover, if the query also applies locally, n begins executing the query itself. If the query does not apply at n or at any of its children, it is simply ignored. Building an SRT is a two-phase process: first the SRT build request is flooded through out the whole network. This request specifies the name of the attribute A over which the tree should be built. When a node n receives the request, if it has no children, then it chooses a node p from available parents to be its parent, and reports the value of A to p in a parent selection message. If n has children, it forwards the request to them and waits for their replies. When it has heard from all of its children, it chooses a parent and sends a selection message indicating the range of values of A which it and its descendants cover. Because children can fail, nodes also have a timeout which is the maximum time they will wait to hear from a child; after this period is elapsed, the child is removed from the child list. Figure 2.5 shows an SRT over the X coordinate of each node on a Cartesian grid. The query arrives at the root and it is forwarded down the tree. Only the gray nodes are required to participate in the query (node 3 must forward results for node 4, despite the fact that its own location precludes it from participation).
Processing Queries
Once queries have been disseminated and optimized, the query processor executes them. Time is divided in epochs. Nodes sleep for most of an epoch to minimize power consumption. Once a node is awake, it begins sampling and filtering results according to the plan provided by the optimizer. Filters are applied and results are routed to join and aggregation operators further up the query plan. Results are put into a radio queue for delivery to the node’s parent. This queue contains both tuples from the local node, as well as tuples that are being forwarded on behalf of other nodes in the network. The queue can fill depending on the number of queries
0 X 1 2 3 4 5 6 7 8 9 10 11 0 Y 1 2 3 4 5 6 7 8 9 10 11 12
4
2
5
Location: (1,7) SRT(x)3
QUERY SELECT light WHERE x > 3 AND x < 7 Location: (8,7) SRT(x) 4: [5,5] 5: [10,10] Location: (4,12) SRT(x) 1: [1,1] 3: [5,10] Location: (10,3) SRT(x) Location: (5,3) SRT(x)1
Figure 2.5: A semantic routing tree in use for a query. Gray arrows indicate flow of the query down the tree; gray nodes must produce or forward results in the query. running, the cardinality of joins, and the number of groups and aggregates. In this case, the system must decide if it should discard the overflow tuple, discard some other tuple already in the queue, or combine two tuples via some aggregation policy.
2.2
Detection and Tracking of Mobile Events with
WSN
Kumar et al. [50] propose a framework for distributed event detection where groups of nodes cooperate to detect a composite event. The framework consists of two protocols that build a tree to detect an event by using a communication model similar to the Publish-Subscribe paradigm, where the communication is done in an asynchronous manner. An application subscribes to an event by specifying the area where the event is expected to occur. Then the protocol builds an event-based data collection tree. For composite events, a counter is maintained for each atomic event part of the composite event. Counters keep track of the number of sensors which can sense atomic events. Sensors are added to the tree until counters exceed some
predefined thresholds.
In [64] the Timely Energy-efficient k-Watching Event Detection problem (TEK-WED) is examined. The authors move the computation needed to detect an event inside the network, which now takes place at a gateway node. This node is respon-sible for reaching a conclusion and notifying the users when an event happens. The gateway node is properly selected, and every sensor in the network has a chance to serve as a gateway node in order to balance the energy consumptions. The sensors are grouped in detection sets and only one detection set is active at any time, thus saving energy. The gateway node disseminates the threshold to be checked to detect the event to the sensors, and they notify the gateway when the current sensed values are over the threshold. The gateway then computes the information coming from the sensors and determines whether the event occurred.
In [35] the authors propose a cluster based, energy-aware event-detection scheme where events are reliably relayed to a sink in the form of aggregated data packets. The clustering scheme proposed provides fast and accurate event detection and reliability control capabilities to the areas of the network where an event is occurring. In particular, the sink assigns a dynamically adaptable reliability factor to clusters, according to their size and event proximity such that the clusters closer to the event send packets to the sink more frequently. In order to reduce the energy consumption, the proposed scheme includes an energy-level based CH selection that ensures that higher energy nodes remain as cluster heads for a longer time. In addition, it also provides a mechanism for the CH to control the transmission rate of the sensors according to the assigned cluster reliability.
In [73] the authors investigate the detection performance of randomly deployed WSN. They address the problem of detecting mobile targets that have continuous movement. They distinguish two kind of targets. In the first type, called rational targets, the knowledge of existing sensors is assumed. In the second type of targets this assumption does not hold, and it is assumed that the targets neither know anything about the sensors, nor do they plan their path for specific purposes, while their traces are assumed to be straight lines. They propose a mechanism to find critical positions to deploy additional sensors, so that the freedom of mobile targets can be limited, and the probability of detection on mobile targets is increased.
In [68] the Scheduling for Composite Event Detection (SCED) problem is ad-dressed. They propose a sensor scheduling mechanism that ensures both coverage and connectivity requirements, and maximizes the network lifetime. They assume that sensors are densely deployed, and that they are equipped with multiple sensing components for watching a composite event. The proposed method is to put some redundant sensors to sleep. They consider the network lifetime organized in rounds, where each round has two phases: initialization phase and data collection phase. The initialization phase chooses a set of active sensors as sensing nodes in order to achieve both coverage and connectivity requirements. Sensors which are not chosen to be active in this round go to sleep to save energy. In the data collection phase, active sensors perform sensing and data relaying.
In [74] the authors investigate the problem of how to design a detection scheme to minimize the energy consumption of WSN while providing the required detection accuracy. They propose an adaptive scheme that leverages the discrepancy among individual sensor’s detection accuracy, which is obtained from a collaborated training process, to allow each sensor to operate at its most energy efficient level while guaranteeing the overall detection accuracy.
Recently, the fuzzy logic paradigm has been applied in the event detection in WSN. FED [41] is a fuzzy event detection model that benefits from fuzzy variables to measure the intensity as well as the occurrence of detected events. FED uses fuzzy rules to define composite events to enhance handling uncertainty. FED also provides a node level knowledge abstraction, which offers flexibility in applying heterogeneous sensors. The model is also applicable to a clustered network for distributed event detection.
In [32] the authors focus on improving the definition of the event to be detected in order to increase the detection accuracy. In particular they believe that using precise values to specify event thresholds cannot adequately handle the often imprecise sensor readings. They use fuzzy values instead of crisp ones to define the event to detect, thus improving the accuracy of event detection.
One of the first works on tracking moving objects with WSN is ZebraNet [30]. In this work the sensors operate as a peer-to-peer network to compute local information about the moving objects to be tracked. This information is then stored inside the network. The base station periodically traverses the network and gathers the acquired data from the sensors when it is close to them.
In [67] a distributed and scalable prediction-based algorithm that accurately tracks mobile targets using WSN is proposed. The algorithm uses a cluster based architecture for scalability and robustness. Given a target to track, the proposed algorithm provides a distributed mechanism for locally determining the optimal set of sensors suitable for the task. Only the selected sensors are activated, thus minimizing the energy spent. Additionally, the protocol uses a predictive mechanism to alert the cluster heads about the approaching targets. Based on this prediction, the cluster heads activate the most appropriate sensors for the task immediately before the arrival of the target.
A prediction-based approach is also used in [21], where the cluster organization of the network is exploited to track multiple moving objects.
EnviroTrack [6] is an embedded tracking application for WSN. It adopts a data centric programming paradigm called attributed-based naming through “context la-bels”, where the routing and addressing are based on the content of the requested data rather than the identity of the target sensor node. The attribute-based nam-ing is applied by associatnam-ing user-defined entities (context label) to real physical targets. With this network abstraction layer the programmer declares the environ-mental characteristics which define the context label of the object to be tracked. Based on this, all sensors that sense the same declared characteristics (object) are aggregated to track that physical target. With network management mechanisms
such as lightweight group management and group leader election, it supports the dynamic behavior of the tracked targets such as mobility.
In [36] the authors address the problem of tracking moving objects in a WSN by considering the physical network topology to build a logical tracking tree for the collection of tracking data. The tree is optimized in order to minimize the tree updating and query execution costs.
RARE [47] proposes two algorithms for performing an efficient target tracking based on a static cluster organization of the WSN. The first algorithm reduces the number of sensors participating in tracking by excluding the sensors too far from the target object. The second one reduces redundant information by identifying overlapping sensors.
In [8] the data acquired by the sensors are analyzed, in a centralized manner, outside the network, in order to detect phenomena to track and from which data is acquired. A phenomenon is detected when different sensors report similar readings over a period of time. Once the phenomenon has been detected, the information about the spatial properties of the phenomenon are used to optimize subsequent user queries.
DELTA [66] is a fully distributed event localization and object tracking frame-work for WSN. DELTA adopts a distributed algorithm for detecting an event and for dynamically building groups around the object to be tracked. For each group, a leader is responsible for group maintenance, gathering and processing of tracking data. In [65] the DELTA framework is extended with mechanisms for the localization and classification of events.
CODA [20] is an algorithm for the detection and the tracking of continuous phenomena (fires, gas clouds, etc...) based on a hybrid static/dynamic clustering technique. A static backbone comprising a designated number of static clusters is constructed during the initial network deployment stage. Upon detecting a contin-uous phenomenon, the cluster heads of the backbone pilot the creation of dynamic clusters by using the information acquired by the sensors at the boundaries of the phenomenon, thus reducing the amount of communications between the sensors. The dynamic clusters are used to track the phenomena and to acquire data from them.
In [59] the main effort is in reducing the number of environmental readings and, as a consequence, the amount of data delivered outside the network. They take infrequent snapshots of the area and they adopt a low-quality target tracking algo-rithm to maintain object identities. The target tracking algoalgo-rithm they adopt is a leader-based algorithm, in which the node that is considered to have the best reading for the moving object, is elected as leader. The leadership is passed from a sensor to another (a neighbor of the previous leader) by exploiting probabilistic estimation of the direction of the moving object. Periodically (exactly when the snapshot period elapses), the leader collects and aggregates the readings of its neighbors to achieve a high-quality belief on the target moving object, and it sends this information to the base station.
In [18] the authors present a novel framework for time-critical event generation in WSN environments that includes tools to model intruder detection events, as well as fire and gas propagation scenarios. The different models developed are integrated into an application optimized for ns-2 compatibility. They also provide a front-end to simplify the interactions with the user and to allow visualizing the different events generated. In [37] they use the framework developed in [18] to performed a comprehensive analysis of the performance of IEEE 802.15.4 based WSNs at supporting time-critical applications. In particular, they measure the accuracy and the delay introduced by gas and fire monitoring processes.
In [53] the authors propose a prediction based tracking technique using sequential patterns (PTSPs) designed to achieve significant reductions in the energy dissipated by WSN while maintaining acceptable missing rate levels.
All the works presented above either address only the detection of events or on the tracking of objects in WSN, or they are focused on a specific application scenario. On the other hand, we propose a comprehensive system that enables to both detect a user-defined composite event and to automatically track it and collect interesting data from the event without any further intervention from the user.
In the next sub-sections we describe in more detail the works that are more related to this thesis about detection and tracking of mobile events.
2.2.1
Distributed Cooperation for Event Detection
Kumar et al. in [50] propose a framework that exploits the collaboration among sensors for distributed event detection in WSN. It consists of two protocols (simple event detection protocol and composite event detection protocol) that build a tree to detect an event. Each protocol is composed of two phases, namely initialization phase and collection phase. Different components are present on different nodes depending on the functionality of each node. The communication model that is used in the framework is similar to the Publish/ Subscribe paradigm [60]. It is scalable and it offers the advantage to entirely decouple the publishers from the subscribers so the communication is done in an asynchronous manner.
In the initialization phase, the application submits events of interest to the sensor network. Here the application acts as a subscriber for the event of interest. The events of interest can be a simple event or a combination of simple events. Based on these events, an event based tree (EBT) is built according to the Publish/Subscribe communication paradigm. Nodes which can generate data related to any simple event join the tree. Generation of data depends on the sensing capabilities of the nodes, thus, an EBT is constructed as required by the application. This tree can be shared by different applications if a simple event is present in more than one events of interest supplied by them. The collection phase is responsible of gathering results after an event has occurred. The aggregation happens at each node depending on the event and the corresponding generated data.
value2, ..., An > valuen, where A1, A2, ..., Anare low level sensing attributes like
tem-perature, pressure, etc. Subscription messages with the above mentioned predicates are generated by the middleware, that also plays the role of event disseminator in the WSN. After receiving a subscription message, each node checks whether it has the capability to sense the attributes specified in the message. If so, it produces an entry of the application identifier (application id ) along with the parent id, that is the node from which it has received the message. The application id is maintained to distinguish between different subscriptions. A node receiving a subscription from a user node will act as the sink for that subscription, and the related tree is built with the sink as root.
The application submits the event to be reported in the form of a simple event. It also specifies the location regions where the event has to be detected, the number of hops, and the tolerable delay between events. The number of hops determines the number of groups to be formed in the desired region. This parameter is entirely dependent on the application. For example, in a target tracking application sen-sors will form several groups in the region of interest to increase the probability of detection.
In this work, the sensors are assumed to be aware of their position. Thus each node can check whether it is present in the desired region and, hence, decide whether to participate in the event detection task. The system keeps track of how many nodes are required to infer that an event i has happened, and it also keeps track of how many nodes are currently detecting that particular event. If the number of nodes which are already detecting some event exceeds the minimum number of nodes requested to detect that event, the other nodes can skip detecting this particular event, hence saving energy, or they may contribute to detect other events. In this way nodes collaborate among themselves and contribute for event detection.
2.2.2
Composite Event Detection
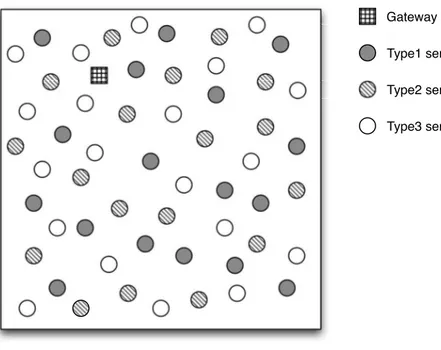
Vu et al. [64] propose a scheme for detection of composite events in WSN. They move the computation needed to determine the occurrence of the event, inside the network, in one or more gateway nodes. The network is composed of different types of sensors. For example, in Figure 2.6, type1, type2, and type3 sensors are used for temperature, smoke density, and light monitoring, respectively. An event E is defined as following:
E = F (P1(x), ..., Pn(x)) (2.1)
where P1(x) through Pn(x) are predicates, and F is a function of Boolean algebra
operators such as ’∧’, ’∨’, or ’¬’. For example, an event fire can be defined as F ire = P1(x) ∧ P2(x) ∧ P3(x), where P1(x) denotes the predicate temperature >
Gateway sensor Type1 sensor Type2 sensor Type3 sensor
Figure 2.6: Network architecture in Composite Event Detection. 300◦C, P
2(x) denotes the predicate smoke > 100mg/L, and P3(x) denotes the
predicate light > 500cd.
In event alarming applications the connectivity is extremely important since an event needs to be alerted on time. However, energy conservation is always a primary objective for WSNs. To meet these requirements, the proposed scheme divides the sensors into non-disjoint subsets (detection sets), and each subset can conduct the event alarming process with a user defined fault-tolerance level. Instead of requiring all the sensors to be active all the time, only one subset is responsible for the event alarming task at any time. In this way, energy can be conserved and the network lifetime can be extended. Each detection set is provided with a BFS tree built at the set definition moment; such tree is used to route the messages to the gateway node. During the active time of a detection set, the sensors in this set route their messages to the gateway node based on the topology and routing information provided by the sink.
The detection set construction algorithm first selects a gateway node (where the gateway can simply be any node with enough residual energy). Then, it constructs a set of connected BFS-like trees rooted at the gateways, and the nodes in each of these trees form a detection set. Several parameters are considered by a sensor in order to be added to a tree: its residual energy, the energy needed to transmit a message to its parent node, and the number of transducers that belong to the predicates of the event to detect. Once the detection sets are built, the sensors start monitoring the events to be detected.
gate-way and non-gategate-way nodes by the sink at the initial phase, or pre-installed in each sensor. Only the gateway nodes have the information about an event E. All the other nodes only know the threshold values of its monitored properties. During the network operation time, when a sensor detects that the current sensed value is over the threshold of its monitored property, it sends one bit ’1’, instead of the sensed value, to the gateway node in its detection set. If a gateway node receives a ’1’, it checks if the propositional function which defines the event E derives a T RUE value. If so, it immediately notifies the sink. By sending only one bit of notifica-tion, instead of sending raw data each time, the amount of data transmitted in the network is significantly reduced.
2.2.3
ZebraNet
ZebraNet [30] is a WSN system for wildlife tracking. In this case, the sensors are tracking collars carried by animals across a large area. The collars are equipped with GPS, and they operate as a peer-to-peer network to deliver logged data back to the user. The scenario in which operates ZebraNet is the following:
1. sensors store their readings (GPS position included) for 3 minutes every hour. Differently from traditional WSN applications, they do not send the acquired data to the user immediately;
2. the WSN runs for 1 year without the human intervention; 3. the sensing-field is very large (over 40,000 square Km);
4. the sink is not fixed; it periodically traverses the network to gather the stored data;
5. latency is not critical, but a high success rate (close to 100%) for the data collection phase is required;
The collars are equipped with two radios: a data radio with a range of only 100 meters but a very low power consumption, and a slow but higher-power data radio for longer-range (8km) transmissions. The short-range radio is power-efficient for peer transmissions, while the longer-range radio is necessary for communicating to the sink to deliver the data. However, even with the long-range radio, the area where the sensors operate is too large for direct communications with the sink. Sensors forward data coming from other sensors in multi-hop paths. In ZebraNet the sensors are extremely mobile, therefore no fixed network topology can be built to collect data. Also the sink is mobile, depending on the route taken by researchers in their vehicles. Furthermore, it is active only for a limited period of time, when researchers are driving around gathering data. During the period when the sink is inactive, the network has no known destination where data can be sent.
A simple approach to send data to the sink is to flood data to all neighbors whenever they are discovered. If the sensors move extensively and meet a fair number of other sensors, data will eventually reach the sink. In this way, the percentage of the delivered data is high. By using multi-hop paths, the sink does not need to interact directly with all the sensors in the system. While flooding can potentially return the highest success rate in a peer-to-peer network, the large amount of data flooded through the network can lead, in some situations, to exorbitant demands for network bandwidth, storage capacity, and energy.
ZebraNet also considers a history-based protocol that smartly selects sensors that will be visited by the sink to collect data, based on prior communication patterns. A good target sensor is one that can relay the data to the sink. This protocol encodes the likelihood of a sensor being within the sink’s range by assigning each sensor a hierarchy level, based on its past success at transferring data to the sink. The higher the level, the higher the probability that this sensor is within sink range. The idea behind this approach is that sensors that were previously within range of the sink will still be close by, so they will be able to relay the data back to the sink either directly (if they are still within range), or indirectly through a reduced set of intermediate sensors. Each sensor remembers its own current hierarchy level. Each time a sensor scans for neighbors, it requests the hierarchy level of all of its neighbors. It then sends the data it has collected to the neighbor with the highest hierarchy level, with ties randomly broken. When a sensor comes within range of the sink, its hierarchy level is increased. Conversely, when a sensor is outside the range of the sink for a long time, its hierarchy level becomes lower at a rate of one level per every D scans, where D is a configuration parameter. At the beginning, all sensors start with a hierarchy level equal to zero. The success of the history-based unicast routing protocol depends on the degree of mobility of both sink and sensors. If the network changes very dynamically, a sensor that was previously near the base station may no longer be the best communication target. Then, the history-based protocol may result in a low success rate.
Monitoring Static Events with
MaD-WiSe
The detection of static events is one of the most common tasks in WSN. This task is often achieved by instructing the sensors to continuously collect environmental data and to send them to the sink for analysis. To implement this task efficiently, the most common approach [69, 40, 13, 7] is to instruct the sensors to perform a preliminary filter and preprocessing of the data, in order to reduce the communication costs. As observed in many of the works presented in Chapter 2, the tasks of data sensing, filtering and preprocessing can be easily expressed by means of SQL-like queries. In this chapter we present MaD-WiSe, a system for data management in WSN that exploits a query language based on SQL to define a monitoring task. MaD-WiSe defines a stream based model and a query algebra to represent the query plan for each sensor, and it uses a query optimization strategy to reduce the energy consumption of the query. More specifically:
• MaD-WiSe defines a query language with constructs specialized for WSN. The query language manipulates data sources consisting of specific transducers located on individual sensors. The queries thus express the sensors and trans-ducers involved in the sensing activity and the timings of such activity. Queries can relate and compare data acquired by multiple (remote) sensors, and they can also aggregate data in the spatial and temporal dimension. Queries are fully executed in the sensors of the WSN. Section 3.2 discusses these aspects. • To support the query language MaD-WiSe defines a stream model for WSN. Streams are used to represent both data acquisition and data transfer among sensors, and the model defines different energy costs depending on the stream nature. The stream model is presented in Section 3.3.1.
• MaD-WiSe defines a query algebra that introduces operators that represent aggregation and/or filtering operations on data streams. A query is thus trans-lated into a distributed query plan consisting of operators of the query algebra