International Journal of Engineering Business Management
Special Issue on Innovations in Fashion Industry
The Logistic Maturity Model:
Application to a Fashion Company
Regular Paper
Claudia Battista
1,*and Massimiliano M. Schiraldi
21 Operations Management Team s.r.l, c/o Department of Enterprise Engineering, Roma, Italy 2 University of Rome “Tor Vergata” - Department of Enterprise Engineering, Roma, Italy * Corresponding author E-mail: [email protected]
Received 1 June 2013; Accepted 15 July 2013 DOI: 10.5772/56838
© 2013 Battista and Schiraldi et al.; licensee InTech. This is an open access article distributed under the terms of the Creative Commons Attribution License (http://creativecommons.org/licenses/by/3.0), which permits unrestricted use,
distribution, and reproduction in any medium, provided the original work is properly cited.
Abstract This paper describes the structure of the logistic maturity model (LMM) in detail and shows the possible improvements that can be achieved by using this model in terms of the identification of the most appropriate actions to be taken in order to increase the performance of the logistics processes in industrial companies. The paper also gives an example of the LMM’s application to a famous Italian female fashion firm, which decided to use the model as a guideline for the optimization of its supply chain. Relying on a 5-level maturity staircase, specific achievement indicators as well as key performance indicators and best practices are defined and related to each logistics area/process/sub-process, allowing any user to easily and rapidly understand the more critical logistical issues in terms of process immaturity.
Keywords Logistic Maturity Model, Logistics Best Practices, Business Improvement, Fashion Supply Chain
1. Introduction
There are several examples that show how researchers and industrial managers have focused on the measurement-improvement dualism in aiming to
improve business process performances. In the last ten years, some of these efforts passed through the development of maturity models (i.e., frameworks conceived to evaluate the maturity of an organization through the definition of a set of structured levels that describe how well behaviour, practices and processes can reliably and sustainably produce required outcomes). The idea of a maturity model derives, originally, from software engineering: in 1993, the Software Engineering Institute (SEI) of Carnegie Mellon University, Pittsburgh (USA), planned the first capability maturity model (CMM), developing a standard process in order to assess the level of quality of information technology organizations through the analysis of the performance levels of the software development process [1]. The application of such a methodology of analysis and the optimization of the processes has seen exponential growth all over the world in recent years, with extremely positive results. Because of these results, many authors have focused their own attention on the development of new models of maturity, concentrating on specific sectors: from information technology [2] [3] [4] [5] [6] [7] [8] [9], to project management [10] [11] [12], to health management [13] [14], to knowledge management [15]
[16] [17] [18] [19] [20], and to supply chain management [21] [22] [23] [24] [25] [26] [27] [28] [29] [30].
In 2012, Battista et al. presented the idea behind the development of a logistic maturity model (LMM) [31]. The authors have sought to overcome some important limitations that prevented the widespread affirmation of maturity models as a tool of analysis and optimization of logistic business processes, namely:
A lack of a framework able to incorporate an identification methodology of the qualitative and quantitative relationships among the business performance indicators (KPIs), strategic objectives and improvement actions to be undertaken in the specific area of logistic processes [32];
Difficulties in using the existing frameworks in industrial processes, because of the low flexibility of the modelling architecture of logistics processes [30]; Difficulties for practitioners in understanding the
criteria behind process modelling and the assessment of a maturity level [33];
A lack of a holistic framework able to incorporate a global vision of the logistics processes [34].
Subsequently, the LMM has been further developed and validated on a famous Italian female fashion firm, which decided to use the LMM as a guideline for the management and optimization of its logistics supply chain. This paper describes the LMM structure in detail and shows the possible improvements that can be achieved by using this model in terms of the identification of the most appropriate actions to be taken for increasing the performance of logistics processes, as well as the effectiveness of this approach in understanding the more critical process areas in terms of immaturity.
2. The Logistic Maturity Model Structure
The LMM is a specific maturity model in that it focuses on the specific dominion of logistics, namely processes that are useful to plan, manage and check the flow of raw materials, finished goods and their information flows from the place of origin to that of consumption. Unlike general maturity models, it does not include those processes that typically encompass different business functions, such as those of human resources management, project management, knowledge management, etc. At the same time, production, finance, marketing, sales and customer care processes are beyond its scope.
The LMM is based on four pillars:
1. A Modelling Framework – conceived of as a logistics process reference model, to identify the main logistics process areas, assigning to each one a specific multilevel structure of processes and sub-processes; 2. A Maturity Framework – useful to evaluate the
maturity score of each logistics
area/process/sub-process, through comparison with sets of expected achievements;
3. A Performance Framework – useful to support the quantitative analysis of the performances of each logistics area/process/sub-process, through the choice of the most appropriate set of indicators among several defined;
4. An Improvement System – useful to trace the link between maturity scores, performance indicators and possible best practices for each area/process/sub-process, in order to support process optimization initiatives and, thus, business improvement.
2.1 Modelling Framework
In the LMM, four logistics areas (LAs) are identified, recalling four out of the five “Level 1 management processes” described in the SCOR ® Reference Model [35]: LA1 (plan), LA2 (source), LA3 (store), LA4 (distribute). The reverse logistics processes are not included in this first version of the LMM. Similar to SCOR, in these areas several processes/sub-processes are identified, such as:
Demand planning (PD); Suppliers management (GF);
Procurement orders management (GO); Procurement planning (PA);
Procurement batch setting (LA); Procurement batch timing (TA); Inventory management (IM); Inventory control (IC); Warehousing (WH); Material handling (MH);
Shipment batch setting and timing (TLS); Shipment planning (PS);
Transport management (GT).
Maturity scores are calculated for each logistics area/process/sub-process and specific indicators, and specific best practices are defined for each of these units, as reported in the following sections.
2.2 Maturity Framework
Similar to the cited CMM, the LMM also uses a 5-Level maturity staircase. From the lower to the higher maturity level, there is:
Level 1: a business need is acknowledged but the related process is not managed;
Level 2: the process is managed but it is neither formalized nor standardized;
Level 3: the process is formalized and standardized, but it is neither controlled nor monitored;
Level 4: the process is controlled and monitored but it is not optimized;
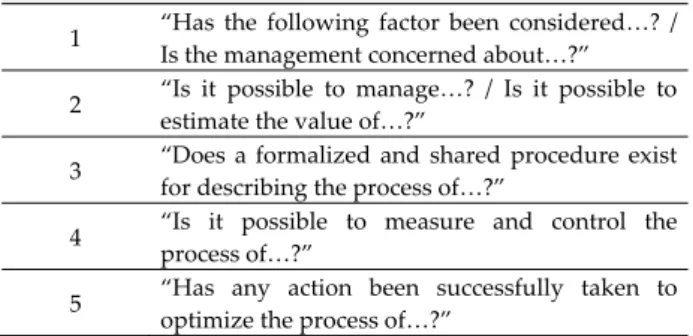
Each maturity level is related to a set of achievements (AC). In order to measure a company’s maturity (i.e., to find its maturity profile), the percentage of accomplished achievements (i.e., the maturity score) of each logistics area/process/sub-process at each maturity level is calculated. Clearly, the achievement type is different in each maturity level: for example, a Level 1 maturity indicates that the company’s concern regarding a certain need should push the management to design a procedure to manage a related process. Thus, when assessing the accomplishment of Level 1 achievements, the related enquiries such as “Has the following factor been considered…?/Is the management concerned about…?” will be made. Similarly, and for instance, when assessing the accomplishment of Level 3 achievements that refer to the formalization and standardization of the processes, enquiries such as “Does a formalized and shared procedure exist for describing the process of…?” are made. Examples of such enquiries are shown in Table 1 for each maturity level:
Mat. level Example of achievement formulation
1 “Has the following factor been considered…? / Is the management concerned about…?” 2 “Is it possible to manage…? / Is it possible to estimate the value of…?” 3 “Does a formalized and shared procedure exist for describing the process of…?” 4 “Is it possible to measure and control the
process of…?”
5 “Has any action been successfully taken to optimize the process of…?”
Table 1. Achievement types for each maturity level
Every AC is characterized by different indicators, which are used to monitor the process performance after reaching the goal and are described in the paragraph dedicated to the performance framework.
2.3 Performance Framework
The indicator type is different in each maturity level. Since the processes have not yet been managed, no indicators are defined at Level 1. Then, with regard to the next maturity levels:
At Level 2, Performance Indicators (IPs) are defined: these indicators aim mainly at measuring the company’s ability to retrieve data and information on its processes;
At Level 3 and Level 4, Achievement Indicators (AIs) are defined: these indicators aim mainly at measuring the percentage of the processes that are formalized or controlled, along with the process monitoring effectiveness;
At Level 5, Key Performance Indicators (KPIs) are defined. These are basically cost indicators or else aim at measuring some critical or strategic aspects of
logistics processes (e.g., service levels, inventory levels, etc.).
This complex set of indicators helps the company transform strategic indications into operative action plans, because it becomes easier to identify which indicators are linked with each maturity level in each logistics area/process/sub-process, and thus to choose the most appropriate one on which to focus. As is later shown in the paragraph dedicated to the improvement system, the indicators – as well as the maturity levels and the logistics areas/processes/sub-processes – are also linked to a set of best practices, which gives the company’s management some suggestions on how to increase the indicators.
However, since these indicators are quite complex, among the KPIs several relationships are present. In addition, it is clear that improving of a process to obtain a result on a chosen KPI may easily influence other indicators that can be mathematically linked or simply correlated. These connections create a form of KPI network that should be taken into consideration when choosing the indicator on which to focus. In the LMM, three levels of connection are defined among the KPIs:
Very strong direct/inverse bond – two indicators, e.g., KPIn
and KPIm, are precisely related through a mathematical
formula, such as KPIn = f(KPIm). Thus, an
increase/decrease of KPIm directly influences KPIn. For
example, the working capital (KPI 2) also depends, among other factors, upon the stockholding cost (KPI 51); Strong direct/inverse bond – two indicators are
secondarily connected through a mathematical formula. This means that if KPIn = f(x) and KPIm = g(y),
then a variable Ω such that Ω ∈ f(x) and Ω ∈ g(y) exists. The variation of Ω influences both KPIn and
KPIm. For example, the warehouse space utilization (KPI
23) and the stockholding cost (KPI 51) both increase when the inventory level (Ω) increases;
Weak direct/inverse bond – the two indicators are independent, e.g., KPIn = f(x) and KPIm = g(y), but a
modification in KPIn may influence KPIm under
specific conditions: for example, the percentage of
expediting orders (KPI15) and the percentage of suppliers on-time deliveries (KPI5) are clearly strongly correlated
despite there not being any precise mathematical relationship between them.
This network can be seen as a weighted graph: each KPI represents a node and the connections represent the edges. The edges can be weighted according to the three levels described, taking into account the relationship type (direct/indirect) with the other nodes. For each node, it is therefore possible to calculate its degree, which describes whether the KPI is more or less positively connected with the other KPIs. Thus, by reading the values in the KPI network, the management can choose to focus on those
indicators with a higher degree (i.e., where an improvement would return a positive effect on most of the other indicators, thereby deeply influencing the maturity of the whole logistics system).
2.4 Improvement System
Once the logistics processes have been mapped onto the LMM modelling framework, once the maturity score has been calculated for each area/process/sub-process, and the most strategic KPIs have been identified, the company can start defining the improvement roadmap.
At first, through a double top-down (from the KPI down to the unaccomplished achievements) and bottom-up (from those achievements that can be more easily reached up to the KPI on which it is possible to act), and also exploiting the KPI network, a company can identify what to focus upon. The complex structure of relationships among the many elements in the LMM includes, for maturity Level 5, a set of best practices (BPs). Each BP is linked both to the various areas/processes/sub-processes and to the PI/AI/KPI set. Thus, the company’s management can easily identify those BPs that can more effectively help to increase the value of the chosen KPI in the selected process; or, conversely, given a BP it is simple to identify whether it would produce the desired effect on the indicator network.
The following example clearly shows the differences among PI/AI/KPI and BP, along with the structure of the LMM: Logistic Area A2 (warehousing) includes process P2.3 (storage). On top of the basic Level 1 achievements (e.g., is the management concerned about how to appropriately
manage storage locations?), the P2.3 Maturity Grid includes
eight achievements at Level 2, for example AC2.6: Is there
a capability for managing storage locations in the warehouse?;
this specific achievement is linked to one or more specific PIs, among which, e.g., PI6: percentage of items whose
location is defined, and to one or more Level 2 BPs, among
which, e.g., WH_BP6: assign a storage slot to each item. On the following Level 3, the P2.3 Maturity Grid includes four achievements, e.g., AC3.2 Does a formalized and shared
procedure which describes the process of managing storage locations exist?; this specific achievement is linked to one
or more specific achievement indicators (AIs), among which, e.g., AI1: percentage of items to which a formalized
and shared procedure to choose and identify the storage location is applied and to one or more Level 3 BPs, among which,
e.g., WH_BP12: define a procedure to assign a storage location
to each new item. Then, P2.3 Maturity Grid includes four
achievements at Level 4, e.g., AC4.3: Is it possible to control
and retrieve the location of an item inside the warehouse? This
specific achievement is linked to one or more specific AIs, among which, e.g., AI11: time to retrieve the exact location of
an item inside the warehouse, and to one or more Level 4
BPs, among which, e.g., WH_BP17: use a warehouse
management system to manage the assignment of storage locations to items. Lastly, P2.3 at Level 5 includes four
more achievements, e.g., AC5.1: Has any action been
successfully taken to reduce the storage space inside the warehouse? This specific achievement is linked to one or
more specific KPIs, among which, e.g., KPI23 warehouse
space utilization, and to one or more Level 5 BPs, among
which, e.g., WH_BP21, which describes how to reduce the storage space by using an effective fixed-slot location policy [36,37,38,39].
To summarize, the LMM introduces a total of 250 Achievements in four logistics areas, forty-six PIs, twenty-seven AIs, fifty-three KPIs and 250 BPs. This complex structure allows a company to easily:
Evaluate its overall maturity profile and its maturity score on a specific process/sub-process: by verifying which achievement has or has not yet been accomplished, a company can quantitatively measure its proficiency in managing each logistics process and identify its weaknesses or possible improvements; Define the most appropriate QIs that can lead to an
improvement roadmap; on top of this, by drilling down to the AI and PI and finding the associated BP, the management can identify where to primarily act and which quick-wins can help increase the value of strategic KPIs;
Evaluate the opportunity for adopting specific practices: the effectiveness of a pre-chosen improvement approach, possibly suggested by an external consultant, can be evaluated before its implementation by checking whether it will influence the KPIs of interest, and also by analysing the collateral effect it may have on other indicators in other logistics areas.
3. LMM application to a fashion company
In this section, the application of the LMM to a fashion company is presented. The fashion industry is progressively drawing the attention of researchers, due to its increasing importance in the worldwide economy and the peculiarities of its operations practices. For example, recent studies have focused on fashion firms analysing brand value [40], organizational innovation [41,42,43], production efficiency increase [44,45], improvements in logistics processes [46,47], and forecasting techniques [48,49].
As to the LMM’s application, for practical reasons, only a small part of the tables and figures which result from the LMM’s application is shown. The LMM consists of hundreds of indexes and references, and the tables and figures presented in this section are shown with the aim of providing an example of its structure and showing its effectiveness for an industrial application.
fictitious due to confidentiality reasons), a €60+ million turnover medium-large-sized Italian fashion company. BLS operates in the women’s textiles, apparel and clothing sectors, and distributes its products in 200+ shops all over Italy as well as some shops abroad. Six months before the beginning of the season (two seasons are identified: autumn/ winter and spring/ summer), the BLS style department prepares the new collection, choosing which items are included for each subcategory of products. In each collection, approximately 2,500 items are assigned to seventy subcategories which, in turn, are aggregated into nine categories. Forecasts are based on historical sales data: at first, aggregated forecasts are calculated at the category and subcategory levels and, subsequently, supply quantities are defined for each item. Purchasing operations occur every six months. BLS’s suppliers are mainly located in Eastern countries (China, India and Turkey); thus, long lead times are necessary. Distribution is operated from a single distribution centre. Material handling and shipments are outsourced. Shops are managed with consignment stock and a look-back replenishment logic, but replenishment quantities and assortment may change during each single period according to the gap present in the shop’s turnover’s target.
Recently, BLS experienced a net growth both in terms of turnover and in terms of geographical expansion; the number of shops has almost doubled over the last five years and as such material flows have increased. This has caused difficulties in logistics management, which reflected on some shelf-out-of-stock phenomena in the shops. As a consequence, BLS started an assessment project aiming at measuring the maturity level of its logistics processes and, thus, identifying the best opportunities for improvement.
Specifically, the LMM’s application was organized in three steps:
1. Maturity assessment; 2. Weak point identification;
3. Improvement of the roadmap definition.
3.1 Maturity Assessment
At first, business processes needed to be classified and mapped onto the LMM’s logistics areas, in order to identify the key roles to involve in the assessment. For this purpose, a preliminary brainstorming was performed with the BLS management, aiming at:
a. Identifying those outsourced processes from the maturity assessment scope;
b. Identifying those (partially) outsourced processes [50] within the assessment scope, where the involvement of the logistics provider was required;
c. Identifying the people to interview (in order to analyse the specific achievement enquiries, their
knowledge of the company’s processes, on top of some basic competencies in logistics).
The LMM assessment project was presented to the company’s management and personnel during a 2-hour kick-off meeting. Afterwards, 10 people were involved in the interviews; in some cases, two people were interviewed at the same time. Each interview lasted approximately 1 hour and, on average, included 60 questions. The entire project lasted less than two weeks. For instance, Table 2 shows the enquiries for the assessment of the sub-process 2.1.3 “Procurement batch timing”. The questions are divided into each of the five maturity levels and organized in a Maturity Grid.
Sub-process P1.3.2 - Procurement batch timing Mat.
Level Sub-process
Achievem.Achievement description
1 P1.3.2 AC1.1 Is the management concerned about the possible need for the proper planning of supply orders?
2
P1.3.2 AC2.1
Is it possible to estimate the value (at least a provisional value) of the order delivery time for each supplier?
P1.3.2 AC2.2
Is it possible to estimate the value (at least a provisional value) of the on-time delivery percentage (or service level) for each supplier?
P1.3.2 AC2.3
Is it possible to estimate the value (at least a provisional value) of the transportation costs for each order/supplier?
P1.3.2 AC2.4
Is it possible to plan a schedule (at least a provisional value) of the expected deliveries of each order in each node of the logistics network?
P1.3.2 AC2.5
Is it possible to estimate the value (at least a provisional value) of the stockholding costs for each stored item?
P1.3.2 AC2.6
Is it possible to estimate the value (at least a provisional value) of the average inventory level for each stored item?
3
P1.3.2 AC3.1
Does a formalized and shared procedure that describes the process of evaluating the order delivery time for each supplier exist? P1.3.2
AC3.2
Does a formalized and shared procedure which describes the process of evaluating the on-time delivery percentage (or service level) for each supplier exist?
P1.3.2 AC3.3
Does a formalized and shared procedure which describes the process of evaluating the transportation costs for each order/supplier exist?
P1.3.2 AC3.4
Does a formalized and shared procedure which describes the process of generating a schedule for deliveries in each node of the logistics network exist?
P1.3.2 AC3.5
Does a formalized and shared procedure which describes the process of evaluating the stockholding costs for each stored item
Sub-process P1.3.2 - Procurement batch timing Mat.
Level Sub-process
Achievem. Achievement description exist?
P1.3.2 AC3.6
Does a formalized and shared procedure which describes the process of evaluating the average inventory level for each stored item exist?
4
P1.3.2 AC4.1
Is it possible to measure and control, in a constant and appropriate way, the delivery time of each order (e.g., tracking the order)?
P1.3.2 AC4.2
Is it possible to measure and control, in a constant and appropriate way, the timeliness of all the suppliers’ deliveries? P1.3.2
AC4.3
Is it possible to measure and control, in a constant and appropriate way, the transportation costs for each order/supplier?
P1.3.2 AC4.4
Is it possible to measure and control, in a constant and appropriate way, the stockholding costs for each item stored (this implies the possibility of measuring and controlling the inventory levels)?
5
P1.3.2 AC5.1
Has any action been taken to successfully increase the precision in evaluating the delivery times of the orders and the timeliness of each supplier, or to increase the precision of the tracking/tracing process for the deliveries?
P1.3.2 AC5.2
Has any action been taken to successfully increase the precision and/or the detail level of the deliveries’ schedule in each node of the logistics network, or to optimize the schedule generation process? P1.3.2
AC5.3
Has any action been taken to successfully reduce the transportation costs?
P1.3.2 AC5.4
Has any action been taken to successfully reduce the stockholding costs or the inventory levels, or to communicate with the most critical suppliers, in order to achieve an optimization of the order timings?
Table 2. Example of a maturity grid for sub-process P1.2.3
It is important to note that, when applying the LMM to different companies, operating in different business sectors, some logistics areas/processes/sub-processes may be absent. Consequently, some achievements may refer to missing procedures or non-existent processes. In those cases, these achievements should not be considered and their enquiries addressed as “N.A.” (i.e., not applicable) since the maturity score is calculated on the percentage of achievements successfully reached, those with N.A. should be excluded from the calculation.
3.2 Weak point identification
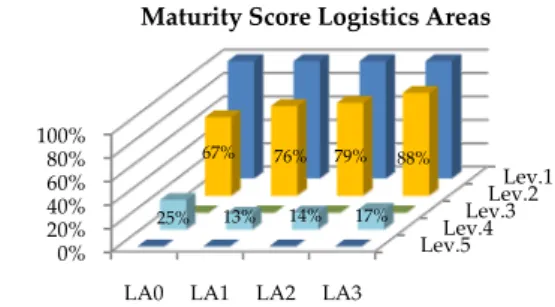
The assessment returned the BLS maturity profile (i.e., the maturity score of the various logistics areas/processes/sub-processes of the company) was presented at different aggregation levels. For instance, the maturity profile considering the whole BLS logistic system is shown in Figure 1. It is possible to see that 100% of Level 1 achievements, 78% of Level 2 achievements and 15% of Level 4 achievements were reached. It is important to point out that the maturity profile should not be intended as a compliance/conformance audit: in such reviews, it is typically not possible to reach a high performance level while some requirements at lower levels are missing. On the contrary, the maturity profile is useful in leading the company towards those improvement initiatives that the management is really concerned about: while one company may worry mostly about standardization and formalization issues – possibly due to the need to comply with regulatory issues – another company may disregard Level 3 achievements and concentrate on those business optimization issues addressed by Level 5 achievements. Clearly, it would be desirable to reach high maturity scores in all the levels.
Figure 1. Maturity score of the BLS logistics system
In order to investigate which logistics areas/processes/ sub-processes are dragging the maturity profile down, it is necessary to increase the level of detail: Figure 2 shows the detail of the maturity score reached in each logistics area.
Figure 2. Detail of the maturity score for each logistics area
0% 20% 40% 60% 80% 100%
Lev.1 Lev.2 Lev.3 Lev.4 Lev.5
100% 78% 0% 15% 0% Maturity Level
BLS Logistics System Maturity Profile
Lev.5Lev.4 Lev.3Lev.2 Lev.1 0% 20% 40% 60% 80% 100%
LA0 LA1 LA2 LA3
25% 13% 14% 17% 67% 76% 79% 88%
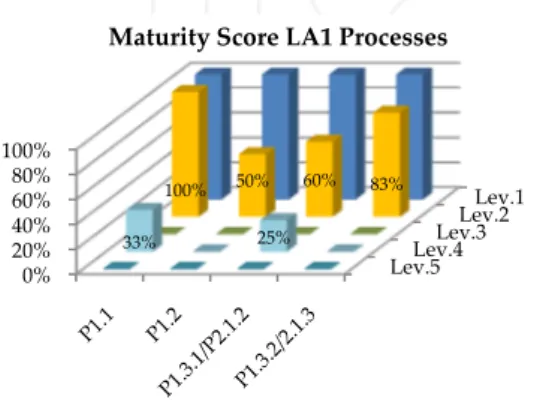
By analysing the graphs, it is clear that the four logistic areas in the BLS exhibited a roughly equivalent maturity profile. No achievement was reached in Level 3, which means that the BLS completely lacked a business process management approach, and that a formalization of procedures, activities, roles and responsibilities was absent. LA0 (planning) recorded the lowest maturity score in Level 2 (the BLS management also confirmed that the forecasting process was known to represent a major criticality and should, therefore, be improved). It is possible to further drill down in the analysis and investigate the maturity score in each area and in each process inside each area (Figure 3 shows an example for the processes/sub-processes in LA1).
Figure 3. Maturity score of the processes/sub-processes in LA1
In the logistics area LA1 (sourcing), the P1.2 process (procurement orders management) reached the lowest maturity score, while P1.1. (suppliers management) reached every Level 2 achievement and some process control/monitoring practices seemed to be implemented at Level 4. With these results, it was easy for BLS to understand which areas/processes/sub-processes needed to be improved first, and this helped to define the evolution strategies in the short- and medium-terms. Furthermore, by analysing the BLS maturity profile, it is possible to conclude that:
Business needs were acknowledged in each logistics area (100% in Level 1);
The greatest part of the logistics processes were managed (78% in Level 1), but none were formalized or standardized (0% in Level 3); this also means that, despite day-by-day activities having been regularly carried out, neither the responsibilities nor process boundaries and interfaces were clearly defined; Some performance indicators were implemented and
some processes were controlled (different percentages of Level 4 achievements were reached in some processes); thus, it was possible to monitor the efficiency of some activities and procedures.
Going deeper into the analysis of the single achievements, it is possible to find that – with reference to the logistics
processes – the BLS failed to grant the customer with a constant level of quality; it reacted slowly to market needs or changes; hardly succeeded in managing and optimizing its performance processes; barely managed to implement the best practices and, as a consequence, could not replicate its successful initiatives. The company’s management confirmed these results, and felt the urgent need to go through an improvement roadmap.
3.3 Improvement roadmap definition
By analysing the LMM outcomes, the BLS top management could define two priority strategies (A, B) for the short- and medium-terms respectively. For the short-term:
A. Planning and procurement processes should be managed, formalized and standardized;
In the medium-term:
B. The forecasting process should be controlled and optimized.
A “business improvement team” (BI-Team), which started tracing these strategic indications in the LMM, was formed in BLS. As a result, the A and B strategies were straightforwardly translated into:
A. The P0.1 (demand planning), P1.2 (procurement orders
management) and P1.3 (procurement planning)
maturity scores were to increase to reach 100% of the Level 3 achievements;
B. The P0.1 (demand planning) forecasting sub-processes’ maturity score was to increase in Level 4 and Level 5.
Drilling down the maturity grids, it was easy to identify which achievements were missing in each of the aforementioned processes at each desired maturity level. As each achievement was linked to AIs, PIs, KPIs and BPs, the strategic indications could be translated into some appropriate actions that could guide improvement initiatives. Here, the example of the drill-down process which led from the two priority strategies mentioned (A and B) to an operative plan is shown.
A. In order to increase P0.1, P1.2 and P1.3’s maturity scores to complete Level 3:
P0.1: five out of eleven achievements in the BLS related to the first three maturity levels were reached. The BI-Team decided to pursue five out of the six missing achievements (P0.1/AC2.5, P0.1/AC2.6, P0.1/AC3.1, P0.1/AC3.2, P0.1/AC3.3). These five achievements are related to three PIs at Level 2 (PI18, PI24, PI40) and four AIs at Level 3 (AI1, AI2, AI3, AI26);
P1.2: Three out of eight achievements in BLS related to the first three maturity levels had been reached. The BI-Team decided to pursue three out of the five missing achievements (P1.2/AC2.2, P1.2/AC3.1, P1.2/AC3.3). These three achievements are related to one PI at Level 2 (PI4) and 3 AIs at Level 3 (AI2, AI3, AI3, AI19); Lev.5Lev.4 Lev.3Lev.2 Lev.1 0% 20% 40% 60% 80% 100% 33% 25% 100% 50% 60% 83%
P1.3: Four out of eleven achievements in BLS related to the first three maturity levels in sub-process 1.3.1 and six out of thirteen achievements related to the first three maturity levels in sub-process 1.3.2 had been reached. The BI-Team decided to pursue four out of the seven missing achievements in sub-process 1.3.1 (P1.3.1/AC2.3, P1.3.1/AC3.3, P1.3.1/AC3.4, P1.3.1/AC3.5) and four out of the seven missing achievements in sub-process 1.3.2 (P1.3.2/AC2.5, P1.3.2/AC3.4, P1.3.2/AC3.5, P1.3.2/AC3.6). These achievements are related to one PI at Level 2 (PI22) and three AIs at Level 3 (AI1, AI2, AI3, AI19);
The BI-Team decided to focus primarily on indicators AI2 (percentage of process in which a responsible person is
clearly identified) and AI3 (percentage of personnel who share the process procedure and can easily access the related documentation). This is because these indicators were
shared by all of the aforementioned processes. It is clear that these types of AIs are related to maturity Level 3, mainly referring to process formalization. Thus, the BLS started a business process modelling project, aiming to map all of its processes with BPMN2.0 notation [51], and to include the adoption of RACI matrices [52] to define responsibilities.
B. In order to increase the P0.1 maturity score in Level 4 and Level 5: one out of eight achievements in the BLS related to maturity Level 4 and Level 5 in P0.1 had been reached. The BI-Team decided to pursue two out of the seven missing achievements, namely those related to the forecasting sub-process (P0.1/AC5.1 and P0.1/AC5.2). Since maturity Level 5 is included in the analysis, these achievements are therefore related to
key performance indicators and, specifically, these two are
related to eight KPIs. The BI-Team decided to focus primarily on one of these, namely KPI36 (mean
percentage error in forecasting volume of sales). This KPI is,
in turn, linked to BP PD_BP17, which explains how to develop an optimized forecasting method on the basis of the variability and the entity of sales. Thus, the BLS started a project aiming to refine their sale forecasting procedure [48] which, in turn, included a series of improvements in data gathering and processing methods, for which a software vendor was involved. Despite the improvement initiatives not yet having been completed, it was already possible to calculate the new maturity profile. This is because the maturity profile is not intended to measure the efficiency or the effectiveness of the improvement projects, but rather the ability to manage processes, to formally define them, to manage result metrics, and to devise optimization initiatives. Figure 4 and Figure 5 show the improvements, in terms of the maturity profile of LA0 and LA1, respectively, originating from the implementation of the initiatives mentioned. In LA0, where forecasting sub-processes were refined in order to reach P0.1/AC5.1 and P0.1/AC5.2, the
maturity score in Level 5 increased from 0% to 50%. Meanwhile, the maturity score in Level 3 increased both in LA0 and LA1: at the same time, with the aim of reaching AI1, the BI-Team managed to accomplish other achievements in Level 2 and Level 3. As a result, the maturity score increased to 100% and 90% in Level 2 and to 75% and 50% in Level 3, in LA0 and LA1 respectively. Clearly, and as a consequence, other minor improvements also arose in the maturity scores of other areas.
Figure 4. Maturity score LA0, AS-IS vs. TO-BE comparison
Figure 5. Maturity score LA1, AS-IS vs. TO-BE comparison
In order to present only one concise synthetic indicator of the maturity score of the BLS to its top management, it was decided to calculate the overall percentage of accomplished achievements, regardless of their level. Figure 6 shows this synthetic indicator, highlighting the overall maturity score increase due to the improvement initiatives mentioned.
Figure 6. Overall maturity score; evidence of the improvement
0% 20% 40% 60% 80% 100%
Lev.1 Lev.2 Lev.3 Lev.4 Lev.5 67% 25% 100% 100% 75% 25% 50% Maturity Level
Maturity Score LA 0 AS-IS vs TO-BE AS IS TO BE 0% 20% 40% 60% 80% 100%
Lev.1 Lev.2 Lev.3 Lev.4 Lev.5 76% 13% 100% 90% 50% 13% Maturity Level
Maturity Score LA 1 AS-IS vsTO-BE
AS IS TO BE
0% 20% 40% 60% 80% 100%
30% 21,4%
Maturity Score BLS Logistics System Overall Maturity Score (AS-IS) Improvement
The entire personnel of the BLS, from the top management to the most operative resources, shared the LMM results and acknowledged the AS-IS maturity profile. The BLS management valued the application of the LMM as a useful tool that could easily help the company define a focused improvement roadmap and could support the progress of the business, starting from the most critical weak points.
4. Conclusions
This article shows the structure of the Logistic Maturity Model (LMM) along with an example of its implementation in a fashion firm. Four logistics areas are considered in the LMM: planning, procurement, storage and distribution; five maturity levels are defined. On top of a reference model of logistics processes, a maturity measurement system, a performance measurement system and a continuous improvement framework, a complex structure of 250 Achievements, 46 Performance Indicators, 27 Achievement Indicators, 53 Key Performance Indicators and 25 Best Practices allow a company to:
Evaluate its maturity level in each logistics area/process/sub-process;
Identify the most appropriate actions to increase specific performance indicators;
Evaluate the opportunity to implement specific improvement actions;
Understand the relationships between different indicators in different logistics processes, providing the management with a network of KPIs and best practices that allow a bird’s-eye view of the performance of the logistics system as a whole. The paper reports the outcome of the adoption of the LMM in a €60+ million turnover, medium-large-sized Italian fashion company, operating in the women’s textiles apparel and clothing sectors. The company distributes approximately 2,500 products in consignment stock in more than 200 shops all over Italy, and some shops abroad, managing a supply chain that starts in China, Turkey and India.
Through the application of the LMM, the company’s management was able to measure the maturity profile in less than two weeks, identify the weak points in the logistics processes and define a precise improvement roadmap. The LMM helped to transform the top management’s strategic indications in operative actions, showing which best practices should be adopted to effectively increase the KPIs on which to focus. Two specific projects were launched and again, before their conclusion, it was possible to calculate the to-be maturity profile, which represents the starting point for new improvement initiatives. In this way, the LMM proved to
represent a useful tool to support constant improvements in the logistics department and, therefore, proved to be able to fill the gap which had emerged up until now in the literature about the several maturity models developed in the supply chain management context. At the same time, some useful indications on how to improve and update the LMM came from this application. Specifically, the extension of the modelling framework, including the reverse logistic, is considered to be a priority to be addressed in the immediate future. On top of this, the development of a benchmark system for logistics processes performances, which could provide some useful reference values for companies in different sectors, represents an interesting research opportunity. Finally, other research speculations might focus on potential applications of the LMM KPI network. Such extensions will allow companies to be supported in a more precise evaluation of their competitive position and to quickly and effectively find the optimal tuning for their logistics strategy.
5. References
[1] Turner R, Jain A. (2002) Agile meets CMMT: Culture clash or common cause? In Proceedings of the Second XP Universe and First Agile Universe Conference on Extreme Programming and Agile Methods pp. 153-165.
[2] Gibson CK, Nolan RL. (1974) Managing the four stages of EDP growth. Harvard Business Review. 52(1): 76-88.
[3] Crosby PB (1979) Quality is Free: the Art of Making Quality Certain New York: McGraw-Hill.
[4] Radice R, Harding J, Munnis P, Phillips R. (1985) A programming process study. IBM Systems Journal 24: 79-90.
[5] Software Engineering Institute (1995) The Capability Maturity Model: Guidelines for Improving the Software Process Pittsburgh: Addison-Wesley. [6] CMMI Product Development Team. (2000) CMMI for
Systems Engineering/ Software Engineering/ Integrated Product and Process Development, Version 1.02, Staged Representation. Technical report CMU/SEI-2000-TR-030. Pittsburgh: Carnegie Mellon University.
[7] CMMI Product Team (2007) CMMI for Acquisition, Version 1.2 Pittsburgh: Addison-Wesley.
[8] CMMI Product Team (2010) CMMI for Services, version 1.3 Pittsburgh: Addison-Wesley.
[9] CMMI Product Team (2002) The People Capability Maturity Model: guidelines for improving the workforce Pittsburgh: Addison Wesley.
[10] PMI (2003) Organizational Project Management Maturity Model (OPM3) knowledge foundation Milano: Project Management Institute.
[11] Kerzner H (2009) Project Management: A systems approach to planning, scheduling and controlling. X ed. Hoboken, New Jersey: John Wiley & Sons. [12] Bourne L, Tuffley A. (2007) Comparing Maturity
Models: CMMI®. OPM3® and P3M3®. In PMOZ Conference, 28-31 August 2007; Queensland, Australia
[13] Van de Wetering R, Batenburg R. (2009) A PACS maturity model: a systematic meta-analytic review on maturation and evolvability of PACS in the hospital enterprise. International Journal of Medical Informatics. 78(2): 127-140.
[14] Staggers N, Rodney M, Alafaireet P, Backman C, Bochinski J, Schumacer B, et al. (2011) Promoting Usability in Health Organizations: initial steps and progress toward a healthcare usability maturity model. HIMSS Usability Task Force, Healthcare Information and Management Systems Society. [15] Klimko G. (2001) Knowledge Management and
Maturity Models: Building common understanding. In Proceeding of the 2nd European Conference on Knowledge Management, Bled (Slovenia) pp. 269-278.
[16] Grimaldi M, Canzano D. An integrated framework to implement a knowledge management programme: The role of technological tools and techniques. International Journal of Intelligent Enterprise. 1(3-4): 233-247.
[17] Greco M, Grimaldi M, Hanandi M. How to select knowledge management systems: A framework to support managers. International Journal of Engineering Business Management 5 (10): 1-11. [18] Cricelli L, Grimaldi M. (2010) Knowledge-based
Inter-Organizational Collaboration. Journal of Knowledge Management. 14(3): 348-358.
[19] Ehms K, Langen M. (2002) Holistic development of KM with KMMM. Knowledge Management & Business Transformation, Siemens AG / Corporate Technology.
[20] Kochikar T. (2000) The Knowledge Management Maturity Model - A staged framework for leveraging knowledge. In The KM World 2000 Conference; Santa Clara (CA), September 2000 pp. 1-26.
[21] Johnson WC, McCormack KP (2003) Supply Chain Networks and Business Process Orientation: Advanced Strategies and Best Practices New York: CRC Press.
[22] McCormack K, Lockamy III A. (2004) The Development of a Supply Chain Management Process Maturity Model Using the Concepts of Business Process Orientation. Supply Chain Management: an International Journal. 9(4): 272-278. [23] Srai J, Gregory M. (2005) Supply Chain Capability
Assessment of Global operations using Maturity Models. In Proceedings of EurOMA; Budapest pp. 19-22.
[24] Hunsche C. (2006) Introducing the Design Chain. BP Trends, September 2006. : 1-7.
[25] Netland T, Alfnes E, Fauske H. (2007) How mature is your supply chain? A supply chain maturity assessment test. In Proceedings of the 14th EurOMA Conference; Ankara pp. 17-20.
[26] Bolstorff P, Rosenbaum G (2007) Supply Chain Excellence New York: Amacom.
[27] Kauremaa J, Suzuki S. (2007) Evaluating SCM Practices with the SCM Scorecard: Evidence from an International Study. In POMS 18th Annual Conference; Dallas, Texas, U.S.A.
[28] Lambert DM (2008) Supply Chain Management: Processes, Partnerships, Performance (Terza edizione) Sarasota, Florida: Supply Chain Management Institute.
[29] Supply Chain Council (2010) Supply Chain Operations Reference Model USA.
[30] Garcia H, Giachetti R. (2010) Using Experts to Develop a Supply Chain Maturity Model in Mexico. Supply Chain Management: An International Journal. 15(2): 415-424.
[31] Battista C, Fumi A, Schiraldi MM. (2012) The Logistics Maturity Model: guidelines for logistic processes continuous improvement. In Proceedings of the XXIII World POMS Conference, 20-23 April 2012; Chicago (USA)
[32] McCormack P, Ladeira MB, Valadares de Oliveira MP. (2008) Supply chain maturity and performance in Brazil. Emerald Emerging Markets Case Studies. 13.
[33] Visconti M, Cook C. (1998) Evolution of a maturity model - critical evaluation and lessons learned. Software Quality Journal. 7(3/4): 223-237.
[34] Netland TH, Alfnes E. (2008) A practical tool for supply chain improvement – experiences with the supply chain maturity assessment test (SCMAT). In Proceedings of the EurOMA/POMS Conference, 5-8 August 2008; Tokyo
[35] (2010) Supply Chain Operations Reference (SCOR) model - Version 10.0. USA: Supply Chain Council (SCC) Inc.
[36] Fumi A, Scarabotti L, Schiraldi MM. (2013) The effect of slot-code optimization in warehouse order picking. International Journal of Engineering Business Management. 5(20): 1-10.
[37] Fumi A, Scarabotti L, Schiraldi MM. (2013) The Effect of Slot-Code Optimization on Travel Times in Common Unit-Load Warehouses. International Journal of Services and Operations Management. 15(4): 507-527.
[38] Fumi A, Scarabotti L, Schiraldi MM. (2013) Minimizing warehouse space with dedicated storage policy. International Journal of Engineering Business Management. 5(21): 1-8.
[39] Battista C, Fumi A, Laura L, Schiraldi MM. (2013) Multiproduct slot allocation heuristic to minimize storage space. International Journal of Retail & Distribution Management. In press.
[40] Battistoni E, Fronzetti Colladon A, Mercorelli G. (2013) Prominent determinants of consumer based brand equity. International Journal of Engineering Business Management.
[41] De Felice F, Petrillo A, Autorino C. (2013) Key success factors for organizational innovation in the fashion industry. International Journal of Engineering Business Management.
[42] D'Amico S, Giustiniano L, Nenni ME, Pirolo L. (2013) Product Lifecycle Management as a tool to create value in the fashion system. International Journal of Engineering Business Management.
[43] Pirolo L, Giustiniano L, Nenni ME. (2013) The Italian footwear industry: an empirical analysis. International Journal of Engineering Business Management.
[44] De Carlo F, Borgia O, Tucci M. (2013) Bucket brigades to increase productivity in a luxury assembly line. International Journal of Engineering Business Management.
[45] De Carlo F, Arleo MA, Borgia O, Tucci M. Layout design for a low capacity manufacturing line: a case study. International Journal of Engineering Business Management.
[46] Iannone R, Ingenito A, Martino G, Miranda S, Pepe C, Riemma S. (2013) Merchandise and replenishment planning optimization for fashion retail. International Journal of Engineering Business Management.
[47] Costantino F, Di Gravio G, Shaban A, Tronci M. (2013) Exploring bullwhip effect and inventory stability in a seasonal supply chain. International Journal of Engineering Business Management. [48] Fumi A, Pepe A, Scarabotti L, Schiraldi MM. (2013)
Fourier analysis for demand forecasting in a fashion company. International Journal of Engineering Business Management.
[49] Nenni ME, Giustiniano L, Pirolo L. (2013) Demand forecasting in the fashion industry: a review. International Journal of Engineering Business Management.
[50] Giustiniano L, Clarioni G. (2013) The Impact of Outsourcing on Business Performance: An Empirical Analysis. Journal of Modern Accounting and Auditing. 9(2): 153-158.
[51] Busato D, Fera M, Iannone R, Mancini V, Schiraldi MM. (2013) Evaluating RFID opportunity through process analysis. International Journal of RF Technologies: Research and Applications. (forthcoming).
[52] Cabanillas C, Resinas M, Ruiz-Cortés A. (2012) Automated Resource Assignment in BPMN Models Using RACI Matrices. Lecture Notes in Computer Science. 7565: 56-73.