The Sources of Competitive Advantage in University Spin-Offs: a Case Study
Marco Greco
1, Michele Grimaldi
2, Laura Scarabotti
3, Massimiliano Maria Schiraldi
4Abstract
University Spin-Offs are incorporated to exploit the knowledge and skills achieved within Universities. Often, their competitive advantage is represented by specific know-how that may be hardly imitated by competitors. In this article we present an analysis of the intellectual capital assets owned by a University Spin-Off using a framework recently introduced in literature. The framework resorts to a series of structured interviews to key figures within the organization. The interviews are synthesized through the Analytic Network Process and the results are compared using graphical and cost/ benefit analyses. The implementation of the framework creates a useful panel for the planning of investments in intellectual capital assets in order to create value. Moreover, it may emphasize possible discrepancies among interviewees about the importance of each intellectual capital asset.
Keywords: university spin-off; academic spin-off competitive advantage; analytic network process; value drivers;
intellectual capital assets; operations management; strategic framework.
1,2Department of Civil and Mechanical Engineering, University of Cassino and Southern Lazio
Via G. Di Biasio 43, Cassino (FR), Italy, 03043, Tel. +39 0776 299 3641. E-mail: 1[email protected], 2[email protected] 3,4Department of Enterprise Engineering, “Tor Vergata” University of Rome
preneurs lack those specific resources and skills needed to transform an academic idea into a market-ready product or process innovation (Vohora, Wright, and Lockett, 2004). On the other hand, University Spin-Off companies presum-ably enjoy significant advantages in exploiting technological resources as they possess greater absorption capacity than their non-academic counterparts (Colombo, D’Adda and Piva, 2010). Moreover, the connection network, the cred-ibility and the support structure of a University has been found to help University Spin-Offs develop new contacts and expand their social capital (Borges and Filion, 2013). Ac-cordingly, the scientific background and “connectedness” of spin-off founders in the scientific community should facili-tate the recognition of external knowledge flows, and their assimilation and application to commercial ends (Knock-aert, Spithoven and Clarysse, 2010; Murray, 2004). In addi-tion, marginal returns on internal investments in R&D are likely to be higher for University Spin-Offs than for other innovative startups as a consequence of the technological specialization of their founders acquired in an academic setting (Colombo and Piva, 2008; Mustar, 1997). On top of this, Abramo et al. (2012) showed that the spin-off founders are, on average, more productive than their academic col-leagues; thus, in Universities, entrepreneurship and scientific research are definitively not in conflict.
In literature, many theoretical methods are applied in or-der to examine the performance of University Spin-Offs. Cantner et al. (2010) applied a non-parametric method to compare the performance of University Spin-Offs with other innovative startups: the results show that University Spin-Offs have a higher innovative performance and a lower economic performance, and are able to obtain technologi-cal resources, financial resources and entrepreneurial human capital more easily. The resource-based view is widely used in academic literature to conceptualize spin-off performance (Gras et al., 2008; Powers and McDougall, 2005; Rothaermel, Agung and Jiang, 2007) and a recent meta-analytical review (Rosenbusch, Brinckmann and Bausch, 2011) confirmed that innovation drivers lead the performance evolution of these startups. Other theories that are used to analyze this research area are the social capital theory (Nahapiet and Ghoshal, 1998; Trott, Scholten, and Hartmann, 2008), and the science-based design approach (Van Burg et al., 2008). Brush et al. (2001) studied this problem and identified some cate-gories of resources and capabilities that influence the devel-opment of small new companies. Brush et al. (2001) catego-rized several important resources into six different classes: technological, human, social, financial, organizational and physical capital (i.e. the availability of tangible resources such as scientific research equipment and facilities). Other mod-els do not entirely take these six types of resources into ac-count and seem to fail in generating a complete overview of the factors that determine spin-off performance (Salmador
Introduction
As a favored mechanism through which universities transfer technology to the business world, University Spin-Off firms (USOs), also called “Academic Spin-Offs” (Borges and Filion, 2013; Freitas, et al., 2011), are increasingly becoming a signifi-cant global phenomenon in many different regions, including the United States and Western Europe (Shane, 2004). There are many different ways to describe University Spin-Offs: research-related startup ventures formed by university fac-ulty staff, students or post-docs; firms created around a uni-versity license of intellectual property, or around research conducted at the university; startup firms that arise exploit-ing joint research projects with the university. A University Spin-Off is based on several variables, including the type of university sponsorship, the involvement of the university in the formation of the firm, the level of knowledge applied, the co-localization of the founders, the professional background of the spinoff leader and possible partnerships with other companies. Generally faculty staff and/or students can be in-volved in the creation of USOs (Borges and Filion, 2013), but the leader of the spinoff may not necessarily be a member of the university community.
Despite this wide variety, the significance of University Spin-Offs as a technology transfer mechanism for generating and sustaining regional economic increase and competitiveness is widely acknowledged (Etzkowitz and Leydesdorff, 2000; Rogers, 1986; Wright et al., 2007). As a potential means of generating social wealth through the commercialization of research (Bray and Lee, 2000; Etzkowitz, 1998; Shane, 2002; Vohora, Wright and Lockett, 2004) University Spin-Off com-panies in literature are acknowledged as important con-tributors to economic development (Shane, 2004), being considered as one of the key drivers of economic change (Bercovitz and Feldman, 2006). Universities increasingly use University Spin-Offs as a mechanism for commercialization of research products (Siegel, Veugelers, and Wright, 2007; Wright et al., 2007). If a University Spin-Off is based on spe-cific knowledge, the researchers responsible for the genera-tion of this knowledge are usually involved in the startup process, because they have the largest amount of technolog-ical knowledge and expertise on the subject of the research (Gras et al., 2008; O’Shea, Chugh and Allen, 2008).
For university-based spin-offs, the university serves as a source of competitive advantage providing skilled labour, specialized facilities and expertise (Bercovitz and Feldman, 2006; Chandra and Silva, 2012) but often the partnership with a commercial company is sought right from the begin-ning of the initiative. Indeed, differently from other high-tech startups, University Spin-Offs face one fundamental obstacle when they are initially launched; originating from a non-com-mercial environment, most universities and academic
entre-• Relational capital, which represents the organiza-tional relations and knowledge exchange with its external stakeholders (Carlsson, Corvello and Migliarese, 2009; Cor-vello and Iazzolino, 2013; Cricelli and Greco, 2013), as well as its reputation (Greco, Branca and Morena, 2011).
Here, the three components of intellectual capital are de-scribed using IC assets (ICAs), considering their interde-pendencies.
In order to analyze the components of intellectual capi-tal that enable the creation of sustainable competitive ad-vantage for University Spin-Offs, we analyzed the different points of view of the stakeholders for an Italian University Spin-Off born in 2011, identifying the most important ICAs meriting further investments, and pointing out the different perceptions of a shareholder, an employee, a customer, the CEO and the academic scientific supervisor.
Case description
The Operations Management Team s.r.l. (henceforth, OMT) is a privately held limited company, born as a University Spin-Off of “Tor Vergata” University of Rome (Italy) result-ing from the initiative of the Operations Management Re-search Group in the Enterprise Engineering Department, led by prof. M.M. Schiraldi, an assistant professor in Opera-tions Management. “Tor Vergata” University – the second largest public university in Rome – holds a 10% share of the company’s capital stock. The main purpose of the com-pany’s creation was to preserve the knowledge and expe-rience built up through numerous consulting projects car-ried out as a University Research Group, and to enter the market as high value added consulting service specialists. The specific working methodology of the company relies on the team’s specialist skills in the use of a variety of state-of-the-art Operations Management approaches and tech-niques regarding the production of either goods or services. These skills were developed through several projects and industrial consultancies, as well as through intensive train-ing in industrial engineertrain-ing and management techniques. All three managing partners are PhDs in Engineering & Manage-ment and worked in the Operations ManageManage-ment Research Group at the University.
On top of the technology transfer action – which inevitably results from any University Spin-Off initiative – some specific working tools and consultancy techniques were developed directly within the company, e.g. a maturity model (Battista and Schiraldi, 2013) that can be used by manufacturing and retailing companies to evaluate their level of knowledge in the production and logistics areas; an optimization tool for industrial warehouses (Fumi, Scarabotti and Schiraldi, 2013a,b,c ); an improved version of the material require-and Bueno, 2007; Shane, 2004; Siegel, Veugelers require-and Wright,
2007). The results of this research show that the external acquisition of required management team experience and size positively influence venture performance. Furthermore, the acquisition of both a mainly external private investor funding and small amounts of government funding benefit University Spin-Off performance. In terms of social capital, exploiting the network position of a University Spin-Off as well as the increase of the number of collaboration partners show positive relationships with venture performance. Most of these models are based on semi-structured or structured interviews that identify which resources could generate a high performance in University Spin-Offs; on top of this, it is also important to understand how these resources can guarantee a competitive advantage.
Although the notion of “value creation” has not been thor-oughly analyzed in literature, many authors tried to investi-gate its sources and its beneficiaries. Indeed, organizations need to fully comprehend the sources of their competitive advantage and how they create value in order to improve their performance and, therefore, grow. The current streams of literature agree on the critical role played by intangible assets and intellectual capital in value creation (Alberghini, Cricelli, and Grimaldi, 2013; Andrikopoulos, 2009; Brogi, Calabrese, Campisi, Capece, Costa, Di Pillo, 2013; Calabrese, Capece, Costa, Di Pillo, Paglia, 2013; Chen, Zhu and Xie, 2004; Steenkamp and Kashyap, 2010; Kujansivu, 2009; Tan, Plowman and Hancock, 2008). In this article we implement a framework proposed prior to the assessment of intellectual capital (Grimaldi, Cricelli and Greco, 2013). The framework itself is an adaptation of a more generic version (Greco, Cri-celli and Grimaldi, 2013) which also included tangible assets in its analysis and in which assets were assessed accord-ing to their capability to be valuable, rare, inimitable, and non-substitutable (Barney, 1991). In the case we analyzed, the University Spin-Off does not own specific tangible as-sets, which may be deemed as a source of value creation, thus we focused on its intellectual capital (IC). Often the components of intellectual capital have been categorized as follows (Andriessen, 2004; Bernhut, 2001; Bontis, 1998; Cri-celli and Grimaldi, 2010; Dalkir et al., 2007; Grimaldi, CriCri-celli, and Rogo, 2012):
• Human capital, which refers to the cumulative
im-plicit knowledge and competencies of the people working for the organization.
• Structural capital, which refers to the explicit
knowledge embedded in an organization. It includes the or-ganizational databases, routines, processes, culture, patents, documents, brands, copyrights, etc...
B. Intellectual property & technology: patents and in-dustrial secrets owned by the organization;
C. Knowledge & competence: both “hard” knowledge
regarding, for instance, operation management, and “soft” competencies regarding, for instance, public speaking or em-pathy, owned by people within the organization;
D. Processes: procedures to run projects, get in touch
with customers, work as a team, etc.
E. Relations with customers: breadth and depth of the
organizational relations with customers
F. Relations with institutions: breadth and depth of
the organizational relations with institutions (e.g. local gov-ernment, Ministries, etc.)
G. Relations with investors: breadth and depth of the
organizational relations with Investors (e.g. shareholders, banks, venture capitalists, etc.)
H. Relations with Partners & Suppliers: breadth
and depth of the organizational relations with partners and suppliers
After collecting pairwise comparisons by an interviewee, the consistency of his/her judgments was verified. This is because when the number of alternatives is quite high, the transitivity of judgments (if you prefer A to B, and B to C, then you also prefer A to C) has to be checked as the judgments may be-come inconsistent (Saaty, 2004). Inconsistency is considered acceptable if the consistency ratio (Saaty, 1980) is not great-er than 0.1. Othgreat-erwise the intgreat-erviewees’ judgments should be revised according to the best methodologies found in literature, such as the identification of those judgments that increase inconsistency the most (Saaty, 2006). Nonetheless, recent studies showed that some inconsistency is accept-able and does not significantly alter the conclusions (Bat-tistoni, Fronzetti Colladon, Scarabotti and Schiraldi, 2013).
The relative weights are estimated through the cal-culation of eigenvalues and eigenvectors. In the case of the ANP implementation, the weights are included in a “weighted Supermatrix” and then summarized by raising the weighted supermatrix to powers of 2k+1 (with k large enough to find an approximation of W∞) in order to indicate the long-term mutual influences of the elements. The final output of the process is a vector of values identifying the relative impact of each ICA on value creation.
Similarly, the calculation of eigenvalues and eigen-vectors results in a vector of values identifying the relative investment needed by each ICA in order to create value. ment planning software for manufacturing companies
(Breg-ni et al., 2013; D’Avino, Breg(Breg-ni and Schiraldi, 2013; D’Avino, De Simone, and Schiraldi, 2013; D’Avino, Macry Correale and Schiraldi, 2013). These tools and techniques represent a strategic source of competitive advantage compared to other consultancy firms and can be considered part of the intellectual capital of the company.
Methodological approach
The framework requires interviewees to make compara-tive judgments between ICAs regarding their capability to create value for customers, shareholders and workforce. Judgments are aggregated by using the Analytic Network Process (ANP) (Saaty, 1996). The ANP is a generalization of the widely known Analytic Hierarchy Process (AHP) (Saaty, 1980). The ANP considers the interdependencies among ICAs. Both AHP and ANP have been used in litera-ture for similar purposes (Battistoni, Fronzetti Colladon and Mercorelli, 2013; Cabana-Villca et al., 2013; De Felice and Petrillo, 2013a, 2013b; Falsini, Fondi and Schiraldi, 2012; González Ortiz and Zúñiga Álvarez, 2011; Greco, Grimaldi and Hanandi, 2013; Murgia and Sbrilli, 2012; Limam Mansar, Reijers and Ounnar, 2009; Wu and Lee, 2007). Interviewees are also asked to assess the relative investments to be made in each ICA with respect to the others in order to achieve competitive advantage.
The interviewees were selected from the most experienced stakeholders of the OMT Spin-off. We interviewed the OMT Chief Executive Officer (CEO), a shareholder (SHA), the sci-entific supervisor (SS), an employee in charge of the spin-off since its foundation (EM) and a long-term customer (CUS). Each interviewee was provided with detailed information regarding the features of each ICA, the aim of the study and the dynamics of the pairwise comparisons. Interviewees expressed their pairwise comparisons using the “Super De-cisions” software (version 2.2.3, designed by Bill Adams and the Creative Decision foundation, PA) for the analysis of the ICA-relative impact on value creation and for the analysis of expected relative investments in ICAs. Super Decisions is a useful tool that implements ANP.
Design
Interviewees were asked to evaluate pairwise comparisons regarding the following standard ICAs, as defined in (Gri-maldi, Cricelli and Greco, 2013):
A. Corporate culture & internal relationships: the set
of values, rules, relational dynamics that characterize the or-ganization;
The comparison of the two vectors for each interviewee allowed to carry out a cost/benefi t analysis. Moreover, the comparison of the weights obtained from all the interview-ees points out the different perceptions regarding the role played by each ICA, as well as the different perceptions re-garding the benefi ciaries of the value creation to be favoured by the organization.
Results
Hereafter we present the results achieved using a summary of the judgments expressed by the interviewees; we identify the ICAs for which the cost/benefi t analysis recommends further investments and discuss the alignment of the inter-viewees’ opinions regarding the ICAs.
Cost/benefi t analysis
Table 1 shows the mean values and the standard deviations of the eight ICA weights calculated based on the pairwise comparisons provided by each interviewee. The table shows the impact of value creation of each ICA, their perceived expected costs and cost/benefi t analyses, where benefi t β is defi ned as the ICA’s impact on value creation, and cost γ is defi ned as the perceived expected investment to be made in it. Several approaches can be used in order to conduct a cost/benefi t analysis. In the most widely used analysis, the ratio between benefi ts (i.e. ) and costs
(i.e. ) is calculated, and the corresponding j-th
ICA is considered suitable if the ratio is greater than 1 (i.e. benefi ts are higher than costs). Another approach to collect-ing the interviewees’ points of view calculates the average
values of f or every i-th interviewee ( ).
Although the two cost/benefi t approaches are strongly cor-related (Spearman correlation 0.952, p=0.012), they may lead to slightly different strategic choices. Therefore, in a conservative perspective, we only recommended invest-ments in those ICAs resulting as suitable according to both perspectives.
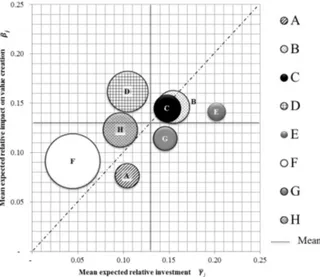
Figure 1 synoptically represents the ICA’s impact on value creation and its expected relative investment, providing the reader with two different cost/benefi t results
simultaneous-ly: the diameter of the circles represents ; the position
of the circle represents : each circle located above the dotted bisector may be considered as a potential target for further investments in the immediate future, as benefi ts outperform costs.
The biggest circle in Figure 1 is represented by ICA F (Re-lationships with institutions): even though its relative impact
Procedure
At fi rst, interviewees received information regarding the aim of the study, the features of the ICAs and of the stakeholders who are supposed to be benefi ciaries of the created value. Each interview was performed individually. The interviewee was allowed to ask questions about the comparisons which had to be made in case of doubts (e.g. could you please explain how this ICA may affect value creation for this stake-holder?). It is important to underline how the interviewer was not allowed to express his own opinion on a specifi c comparison (e.g. in my opinion ICA1 is much more impor-tant than ICA2 because…), neither was he allowed to point out obvious inconsistencies that may have been caused by oversights (e.g. you said you prefer A to B, and B to C; are you sure that you also prefer C to A?).
Consistently with the requirements of the ANP, interview-ees completed pairwise comparisons, expressing their judg-ments using the Saaty’s Scale (Saaty, 1980), saying whether the two elements were equally important, or one was mod-erately more important, much more important, very much more important, or extremely more important than the other one. Verbal judgments were translated into numerical values (1, 3, 5, 7, 9 respectively). The following comparisons had to be completed to assess ICAs’ relative importance (Grimaldi, Cricelli and Greco, 2013):
• Comparisons between S.i and S.j (for i, j =1..3) with
respect to the VC process (e.g. Customers are three times more important than Workers with respect to VC).
• Comparisons between ICA.h and ICA.k (for h,
k =1..n) with respect to ICA.z (for z =1..n, if both ICA.h and ICA.k are connected directly with ICA.z with an arch) (e.g. Knowledge is fi ve times more important than Rel. with Investors with respect to the development of Intellectual Property & Technology that may have an impact on VC).
• Comparisons between ICA.h and ICA.k (for h, k
=1..n) with respect to S.i (for i =1..3) (e.g. Corporate culture is nine times more important than Rel. with institutions with respect to the value created for Workers).
For each interviewee, the overview of his/her pairwise com-parisons returned a vector of weights for every ICA whose sum is 1. Every weight expresses the importance of an ICA for value creation for the organization, from the interview-ee’s point of view. Similarly the framework allowed the ex-pected investment believed to be necessary in each ICA to be assessed with respect to the others.
(i.e. ) is calculated, and the corresponding j-th
(i.e. ) is calculated, and the corresponding j-th
ICA is considered suitable if the ratio is greater than 1 (i.e.
values of f or every i-th interviewee ( ).
Although the two cost/benefi t approaches are strongly
cor-values of f or every i-th interviewee ( ).
Although the two cost/benefi t approaches are strongly
cor-
ly: the diameter of the circles represents ; the position
of the circle represents : each circle located above the
of the circle represents : each circle located above the dotted bisector may be considered as a potential target
Alignment of interviewees on judgment analysis
Table 1 also highlights the most relevant ambigui-ties in the perceptions regarding ICAs of the interviewees in terms of standard deviation. The above average values of standard deviation relative to the impact on value creation refer to ICAs D (Process), B (Intellectual property & tech-nology) and H (Relationships with partners & suppliers). The above average values of standard deviation relative to the expected investments refer to ICAs H (Relationships with investors), B (Intellectual property & technology) and E (Relationships with customers). In general terms, the inter-is quite low, the expected investment inter-is much lower. Thinter-is
seems reasonable since the company, as well as the major-ity of Universmajor-ity Spin-Offs, benefi ts from privileged relation-ships with the University and, consequently, with Institutions. Thus, this results in an advantageous target for further in-vestment. ICA D (Process) is characterized by the highest impact on value creation, while its expected relative invest-ment is below average. Thirdly, ICA H (Relationships with partners & suppliers), could be targeted for further invest-ments. Although A, B, C and G have positive values of (i.e. visible circles in Figure 1), they are placed below the bisector and, therefore, are not acceptable in terms of .
Table 1. Mean and standard deviation values of: impact on value creation (β), expected relative investment (γ), and cost/benefi t analysis for each of the eight ICAs.
ments. Although A, B, C and G have positive values of (i.e. visible circles in Figure 1), they are placed below the bisector and, therefore, are not acceptable in terms of . bisector and, therefore, are not acceptable in terms of . bisector and, therefore, are not acceptable in terms of .
Figure 1. Graphical representation of the mean values of impact on value creation and expected relative investment, the diameter of the circles represents the mean value resulting from the cost/benefi t analysis for each of the eight ICAs
ICAs Investment ( ) Investment (Standard Dev.) Impact
( ) Impact (Stan-dard Dev.)
A Corporate culture & inter-nal relationships 0.104 0.0543 0.077 0.0319 0.7404 1.105
B Intellectual property & technology 0.155 0.0897 0.146 0.0584 0.9419 1.488
C Knowledge & competence 0.148 0.0691 0.145 0.0180 0.9797 1.232
D Process 0.104 0.0647 0.162 0.0593 1.5577 1.867
E Rel. with customers 0.202 0.0862 0.141 0.0432 0.6980 0.839
F Rel. with institutions 0.045 0.0182 0.091 0.0306 2.0222 2.508
G Rel. with investors 0.146 0.1132 0.114 0.0080 0.7808 1.087
H Rel. with partners & sup-pliers 0.097 0.0702 0.123 0.0469 1.2680 1.565
Total Mean 0.13 0.125 0.0819 0.125
( )
( )
0.7404
The opinions regarding the impact and the cost of investing in ICA D are very different among interviewees (see Table 2): the OMT customer is convinced of the importance of D, while the relative investment in his/her opinion is pointless. The resulting cost/benefi t analysis is the third highest value obtained from the forty registered in our study. EM is less enthusiastic but also convinced of the importance of invest-ing in D, and all the other shareholders agree on the conven-ience of investing in D. Interestingly, the scientifi c supervisor perceives a much lower impact on both value creation of Process and expected investment in it, while the ratio is kept positive. This result is consistent with the interviewee’s char-acter and with his creative approach to work, which is less constrained and rigorous compared to how processes are structured within OMT. Indeed, EM, CEO and SHA are very rigorous in abiding by organizational processes, and probably CUS took advantage of their approach.
viewees’ judgments disagreed the most with regard to the assessment of the expected investment in ICAs rather than in the assessment of their impact on value creation. This result may be typical for recently-born spin-off companies: the stakeholders show a notable alignment regarding the ap-proach to the market, because they still share the company’s mission completely. On the other hand, their lack of compe-tence or experience as entrepreneurs highlights diffi culties in reaching a fair evaluation of costs.
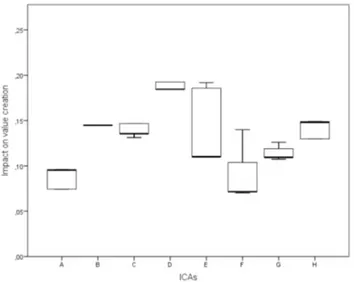
Figure 2 and Figure 3 show the distributions of the impact on value creation of each ICA and its estimated invest-ment respectively, calculated separately by each interviewee. Hereafter we will analyze the most controversial ICAs iden-tifi ed in terms of standard deviation and discuss the possible causes of the misalignments.
Figure 2. Boxplots of the distribution of weights regarding the
impact on value creation of each ICA, calculated by interviewee Figure 2. Boxplots of the distribution of weights regarding the Figure 3. Boxplots of the distribution of weights regarding the Figure 3. Boxplots of the distribution of weights regarding the estimated investment in each ICA, calculated by interviewee
Table 2. Specifi c Impact on value creation of ICA D (process), Expected investment in ICA D and cost/benefi t ratios calculated sepa-rately by interviewee.
Interviewee Impact on value creation of process ( ) Expected investment on process ( )
CUS 0.192 0.163 1.180 EM 0.184 0.055 3.368 SHA 0.192 0.089 2.167 SS 0.184 0.181 1.022 CEO 0.056 0.035 1.600 Mean 0.1620 0.1045 1.8674 Standard Deviation 0.0593 0.0647 0.8486
process ( ) 0.192
process ( ) 0.163
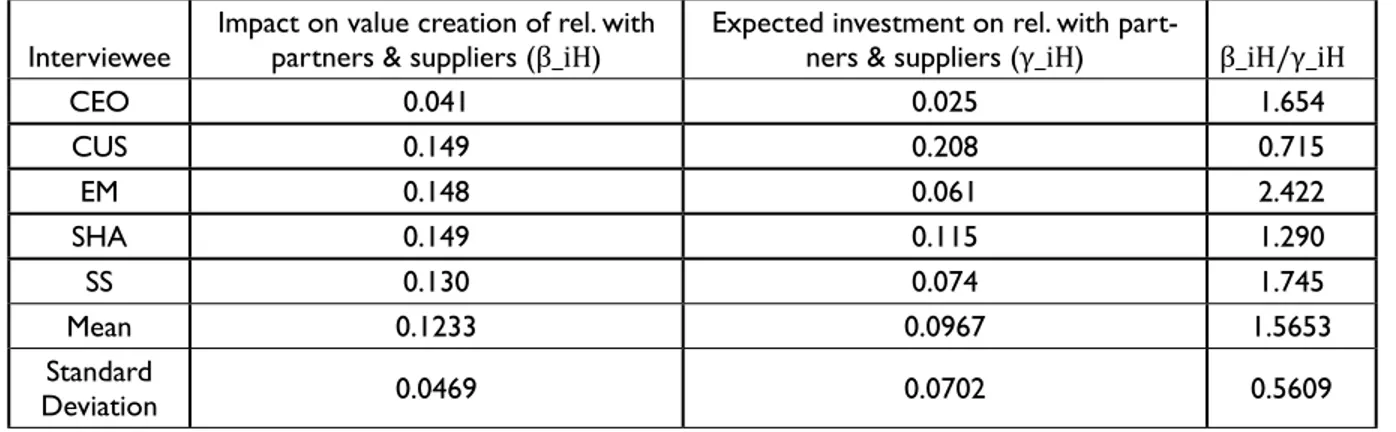
Most OMT stakeholders agree on the usefulness of ICA H (Relationships with partners & suppliers), although the cus-tomer estimates a much higher investment than the others and, therefore, he/she would rather invest in other ICAs. In-terestingly, the CEO has a very low perception of H’s impact on value creation, much lower than every other stakeholder, which, in any case, is compensated by a similarly low evalua-tion of the expected investment.
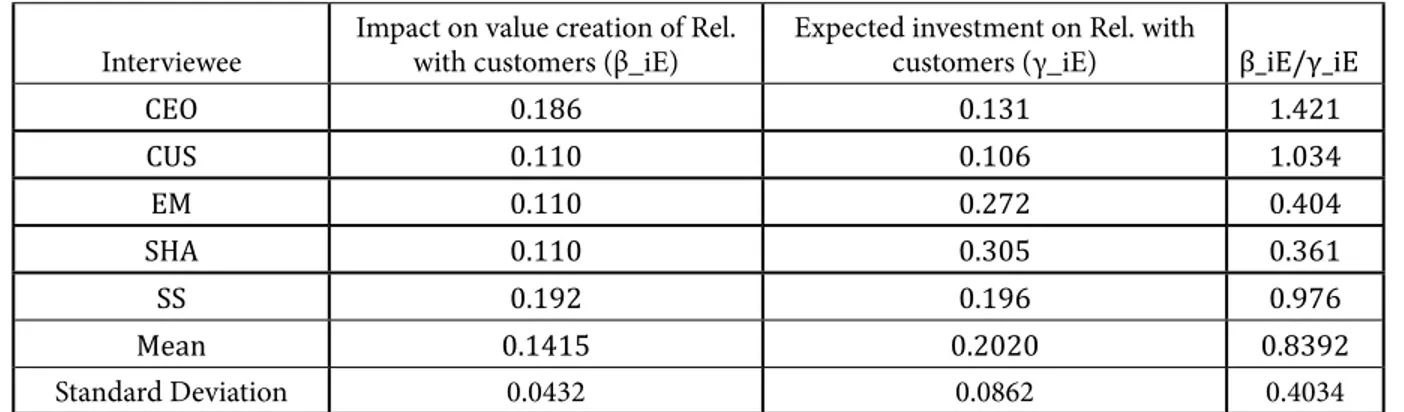
With respect to ICA E (Rel. with customers), the interview-ees assess the expected investments quite differently (see Table 5): the SHA and the EM perceives E to be very costly compared to other ICAs; the SS and CEO consider the in-vestment less costly, but still above the mean value of all the other ICAs (see Table 1); finally, the CUS has the lowest perception of the expected investments in E. This result may alert the internal shareholders: the customer has a distorted idea of the necessary costs to maintain and create relation-ships between OMT and its customers. He/she seems to be-lieve that a small investment might greatly increase the value creation process of OMT, while internal stakeholders believe that an effective investment would have to be remarkable. The assessed impact on value creation of ICA B
(Intellectual property & technology) is extremely similar among the interviewees, with the remarkable exceptions of the SS, who considers its impact to be very high, and of the CEO who – on the contrary – considers its impact to be very low. The results are consistent with the former’s role, which understandably gives special consideration to the sci-entific aspects of the initiative. On the other hand, the lat-ter’s point of view originates from a role-affected approach which is much more oriented to the benefits deriving from an efficient process and good external relationships. The alignment of the other stakeholders returns a mean value that is probably representative of a fair assessment of B’s impact on value creation. The CUS pointedly underestimat-ed the expectunderestimat-ed investment in B comparunderestimat-ed to the internal stakeholders, who are more reasonably aligned (their stand-ard deviation was 0.070). The result should be an issue to discuss for the CEO and the SS, who were probably person-ally involved with regard to the expected investment in B and should engage in communicating more clearly with the external stakeholders just how costly it is – and was – to gain OMT’s intellectual property and technology.
Table 3. Specific Impact on value creation of Intellectual property & technology, Expected investment in Intellectual property & technol-ogy and cost/benefit ratios calculated separately by interviewee.
Interviewee Impact on value creation of Intellectual property & technology (β_iB) Expected investment on Intellectual property & technology (γ_iB) β_iB/γ_iB
CEO 0.066 0.255 0.258 CUS 0.145 0.038 3.836 EM 0.145 0.131 1.108 SHA 0.145 0.115 1.254 SS 0.231 0.234 0.986 Mean 0.1462 0.1546 1.4884 Standard Deviation 0.0584 0.0897 1.2229
Table 4. Specific Impact on value creation of relationships with partners & suppliers, Expected investment in relationships with partners & suppliers and cost/benefit ratios calculated separately by interviewee.
Interviewee Impact on value creation of rel. with partners & suppliers (β_iH) Expected investment on rel. with part-ners & suppliers (γ_iH) β_iH/γ_iH
CEO 0.041 0.025 1.654 CUS 0.149 0.208 0.715 EM 0.148 0.061 2.422 SHA 0.149 0.115 1.290 SS 0.130 0.074 1.745 Mean 0.1233 0.0967 1.5653 Standard Deviation 0.0469 0.0702 0.5609
with respect to the ICAs’ importance in creating value and to the investments needed to achieve value through them. As several cost/benefit analyses have been proposed in literature, in this article we identified the most important ICAs by adopting a hybrid approach, which simultaneously aggregates the perceptions of the interviewees in different ways. Three ICAs appeared to be the most worthy of being beneficiaries of further investments according to the follow-ing points of view adopted: Relationships with institutions, Process, and Relationships with partners & suppliers. Nevertheless, in several cases some interviewees significant-ly disagreed with the others with respect to the ICAs’ im-pact on value creation and/or on the estimated investments that should be made in them. We analyzed the most relevant cases, often finding that the misalignments were linked to the specific role and/or personal background of the inter-viewee. In addition, we found that the customer had very different perceptions from the “internal” interviewees with respect to the expected investment in Intellectual property & technology and to the expected investment in Rel. with customers. The two results seem to lead to the conclusion Despite this result being understandable, it may also
sug-gest that a more effective communication strategy should be implemented in order to make the customers aware of the investments being made in them.
As a measure of coherence among the interviewees we constructed Table 6, which shows, for each ICA, whether or not an interviewee agrees with the recommendation given in the previous section. On average, we obtained a 70% agreement ratio with the recommendations given. If we were to eliminate the customer from our analysis, and per-form an internal-only analysis, the average agreement ratio would increase to 75%
Discussion and conclusion
This article presented an analysis of the ICAs within a Uni-versity Spin-Off, based on interviews submitted to five key figures (the CEO, the scientific supervisor, a shareholder, an employee and a long-term customer). The analysis is aimed both at identifying those ICAs in which future investments should be made, and at identifying possible misalignments among the perceptions of the organization’s stakeholders
Table 5. Specific Impact on value creation of relationships with customers, Expected investment in relationships with customers and cost/ benefit ratios calculated separately by interviewee.
Table 6. Representation of a dummy variable that equals 1 if the interviewee agrees with the recommendation, and 0 otherwise; between brackets (B_ij-C_ij)/C_ij·∀) i-th interviewee and j-th ICA
Interviewee Impact on value creation of Rel. with customers (β_iE) Expected investment on Rel. with customers (γ_iE) β_iE/γ_iE
CEO 0.186 0.131 1.421 CUS 0.110 0.106 1.034 EM 0.110 0.272 0.404 SHA 0.110 0.305 0.361 SS 0.192 0.196 0.976 Mean 0.1415 0.2020 0.8392 Standard Deviation 0.0432 0.0862 0.4034
ICAs Recommendation CEO CUS EM SHA SS % agree % internal agree
A NO 1 [0.46] 0 [1.79] 1 [0.71] 0 [2.4] 1 [0.17] 60% 75% B NO 1 [0.26] 0 [3.84] 0 [1.11] 0 [1.25] 1 [0.99] 40% 50% C NO 0 [1.95] 1 [0.82] 1 [0.71] 0 [2.05] 1 [0.63] 60% 50% D OK 1 [1.18] 1 [3.37] 1 [2.17] 1 [1.02] 1 [1.6] 100% 100% E NO 0 [1.42] 0 [1.03] 1 [0.4] 1 [0.36] 1 [0.98] 60% 75% F OK 1 [3.03] 1 [2.23] 1 [1.15] 1 [1.14] 1 [4.98] 100% 100% G NO 1 [0.99] 1 [0.32] 0 [1.64] 1 [0.95] 0 [1.54] 60% 50% H OK 1 [1.65] 0 [0.72] 1 [2.42] 1 [1.29] 1 [1.74] 80% 100%
References
ABRAMO, G., D’Angelo, C., Ferretti, M., Parmentola, A. (2012). An individual-level assessment of the relationship between spin-off activities and research performance in uni-versities. R&D Management, 42(3), p. 225-242.
ALBERGHINI, E., Cricelli, L., Grimaldi, M. (2013). KM versus enterprise 2.0: a framework to tame the clash. International Journal of Information Technology and Management, 12(3/4), 320-336.
ANDRIESSEN, D. (2004). IC valuation and measurement: classifying the state of the art. Journal of Intellectual Capital, 5(2), 230-242.
ANDRIKOPOULOS, A. (2009). Accounting for intellectual capital: on the elusive path from theory to practice. Knowl-edge and Process Management, 12(3), 217-224.
BARNEY, J. (1991). Firm resources and sustained competi-tive advantage. Journal of Management, 17(1), 99-120. BATTISTA, C., Fumi, A., Schiraldi, M. (2012). The Logistic Ma-turity Model: Application to a Fashion Company, Interna-tional Journal of Engineering Business Management, 5 (29) Special Issue Innovation in Fashion Industry, 1-11
BATTISTONI, E., Fronzetti Colladon, A., Scarabotti, L., Schi-raldi, M. (2013). Analytical Hierarchy Process for New Prod-uct Development. International Journal of Engineering Busi-ness Management, 5(42), 1-8.
BATTISTONI, E., Fronzetti Colladon, A., Mercorelli, G. (2013). Prominent determinants of consumer-based brand equity. International Journal of Engineering Business Manage-ment, 5(25), 1–8.
BERCOVITZ, J., Feldman, M. P. (2006). Entpreprenerial Uni-versities and Technology Transfer: A Conceptual Framework for Understanding Knowledge-Based Economic Develop-ment. Journal of Technology Transfer, 31(1), 175-188. BERNHUT, S. (2001). Measuring the value of intellectual cap-ital. Ivey Business Journal, 65(5), 16-20.
BONTIS, N. (1998). Intellectual capital: an exploratory study that develops measures and models. Management Decision, 36(2), 63-76.
BORGES, C., Filion, L. J. (2013). Spin-off process and the de-velopment of academic entrepreneur’s social capital. Journal of Technology Management & Innovation, 8(1), 21-34. that the customer does not perceive the relevant costs
as-sociated with the two ICAs; this can be caused by a lack of a visible return on investment – the analyzed company invests a lot in them, but the customer is unable to perceive how big the investment actually is - or by some communication problems that can be solved by management.
The implementation of the framework of analysis allowed the company to identify ICAs that may improve its future performance, to measure the alignment of its stakehold-ers on their perceptions regarding ICAs and to highlight critical issues that need to be solved in order to improve the relationships with its customers. The framework was found to be effective and simple to implement in a Uni-versity Spin-Off, providing useful information that may have an impact both on strategic and tactical planning, and on human resource management, as well as on customer relationship management.
COLOMBO, M., D’Adda, D., Piva, E. (2010). The contribution of university research to the growth of academic start-ups: an empirical analysis. Journal of Technology Transfer, 35(1), 113-140.
CORVELLO, V., Iazzolino, G. (2013). Factors affecting the practices of external problem solvers in broadcast search. Journal of Technology Management and Innovation, 8(2), 166-177.
CRICELLI, L., Grimaldi, M. (2010). Knowledge-based inter-organizational collaborations. Journal of Knowledge Manage-ment, 14(3), 348-358.
CRICELLI, L., Greco, M. (2013). Relational Capital and Per-formances in Interuniversity Research Consortia, Interna-tional Journal of Engineering Business Management, 5(4), 1-7. D’AVINO, M., Bregni, A., Schiraldi, M. (2013). A revised and improved version of the MRP algorithm: Rev MRP. Applied Mechanics and Materials, 328, p. 276-280.
D’AVINO, M., De Simone, V., Schiraldi, M. (2013). Revised MRP for reducing inventory level and smoothing order re-leases: a case in manufacturing industry. Production Planning & Control, [available online since 12 Mar 2013]
D’AVINO, M., Macry Correale, M., Schiraldi, M. (2013). No news, good news: positive impacts of delayed information in MRP. International Journal of Management and Decision Making 12(3), 312-334.
DE FELICE, F., Petrillo, A. (2013a). Multicriteria approach for process modelling in strategic environmental management planning. International Journal of Simulation and Process Modelling, 8(1), 6-16.
DE FELICE, F., Petrillo, A. (2013b). Absolute measurement with analytic hierarchy process: a case study for Italian race-course. International Journal of Applied Decision Sciences, 6(3), 209-227.
DALKIR, K., Wiseman, E., Shulha, M., McIntyre, S. (2007). An intellectual capital evaluation approach in a government or-ganization. Management Decision, 45(9), 1497-1509. ETZKOWITZ, H. (1998). The norms of entrepreneurial sci-ence: cognitive effects of the new university-industry link-ages. Research Policy, 27(8), 823-833.
ETZKOWITZ, H., Leydesdorff, L. (2000). The dynamics of in-novation: from national systems and “mode 2” to a triple helix of university-industry-government relations. Research Policy, 29(2), 109-123.
BRAY, M., Lee, J. (2000). University revenues from technology transfer: licensing fees vs.equity positions. Journal of Busi-ness Venturing, 15(5), 385-392.
BREGNI, A., D’Avino, M., De Simone, V., Schiraldi, M. (2013, April). Formulas of revised MRP. International Journal of En-gineering Business Management 5(10), 1-8.
BROGI, S., Calabrese, A., Campisi, D., Capece, G., Costa, R., Di Pillo, F. (2013). Effects of online brand communities on brand equity in luxury fashion industry. International Journal of Engineering Business Management, 5(32), 1-9.
BRUSH, C., Greene, P., Hart, M. (2001). From initial idea to unique advantage: The entrepreneurial challenge of con-structing a resource base. Academy of Management Execu-tive, 15(1), 64-78.
CABANA-VILLCA, R., Cortes-Castillo, I., Plaza-Pasten, D., Castillo-Vergara, M., Alvarez-Marin, A. (2013). Análisis de Las Capacidades Emprendedoras Potenciales y Efectivas en Alumnos de Centros de Educación Superior. Journal of Tech-nology Management & Innovation, 8(1), 65-75.
CALABRESE, A., Capece, G., Costa, R., Di Pillo, F., Paglia, D. (2013). The Impact of Workforce Management Systems on Productivity and Quality: A Case Study in the Information and Communication Technology Service Industry. Knowl-edge and Process Management, 20(3), 177-184.
CANTNER, U., Goethner, M., Stuetzer, M. (2010). Disentan-gling the effects of new venture Team Functional Hetero-geneity on New Venture Performance. Jena Economics Re-search Paper, 29, 1-34.
CARLSSON, S., Corvello, V., Migliarese, P. (2009). Enabling open innovation: Proposal of a framework supporting ICT and KMS implementation in web-based intermediaries. Pa-per presented at the 17th European Conference on Infor-mation Systems, ECIS 2009
CHANDRA, A., Silva, M. (2012). Business incubation in Chile: Development, financing and financial services. Journal of Technology Management & Innovation, 7(2), 1-13.
CHEN, J., Zhu, Z., Xie, H. (2004). Measuring intellectual capi-tal: a new model and empirical study. Journal of Intellectual Capital, 5(1), 195-212.
COLOMBO, M. G., Piva, E. (2008). trengths and weaknesses of academic start-ups: A conceptual mode. IEEE Transactions on Engineering Management, 55(1), 37-49.
GRIMALDI, M., Cricelli, L., Rogo, F. (2012). A methodology to assess value creation in communities of innovation. Journal of Intellectual Capital, 13(3), 305-330.
KNOCKAERT, M., Spithoven, A., Clarysse, B. (2010). The in-novation paradox explored: what is impeding the creation of ICT spin-offs. Technology Analysis and Strategic Manage-ment, 22(4), 479-493.
KUJANSIVU, P. (2009). Is there something wrong with in-tellectual capital management models? Knowledge Manage-ment Research & Practice, 7(4), 300-307.
LIMAM Mansar, S., Reijers, H., Ounnar, F. (2009). Develop-ment of a decision-making strategy to improve the efficiency of BPR. Expert Systems with Applications, 36(2), 3248–3262. MURGIA, G., Sbrilli, S. (2012). A decision support system for scoring distressed debts and planning their collection. In: Gil-Aluja, J., Terceno, A. (Eds), Methods for Decision Mak-ing in an Uncertain Environment, World Scientific PublishMak-ing, Singapore. pp. 69-89
MURRAY, F. (2004). The role of academic inventors in entre-preneurial firms: sharing the laboratory life. Research Policy, 33(4), 643-659.
MUSTAR, P. (1997). Spinoff enterprises. How French aca-demics create hi-tech companies: The conditions for success and failure. Science and Public Policy, 24(1), 37-43.
NAHAPIET, J., Ghoshal, S. (1998). Social capital, intellectual capital, and the organizational advantage. Academy of Man-agement Review, 23(2), 242-266.
O’SHEA, R., Chugh, H., Allen, T. J. (2008). Determinants and consequences of university spinoff activity: A conceptual framework. Journal of Technology Transfer, 33(6), 653-666. POWERS, J., McDougall, P. (2005). University start-up forma-tion and technol- ogy licensing with firms that go public: a resource-based view of academic entrepreneurship. Journal of Business Venturing, 20(3), 291-311.
ROGERS, E. M. (1986). The role of the research university in the spin-off of high-technology companies. Technovation, 4(3), 169-181.
ROSENBUSCH, N., Brinckmann, J., Bausch, A. (2011). Is in-novation always beneficial? A meta analysis of the relation-ship between innovation and performance in SMEs. Journal of Business Venturing, 26(4), 441-457.
FALSINI, D., Fondi, F., Schiraldi, M. (2012). A logistics provider evaluation and selection methodology based on AHP, DEA and linear programming integration. International Journal of Production Research, 50(17), 4822-4829.
FREITAS, J. S., Gonçalves, C. A., Cheng, L. C., Muniz, R. M. (2011). Parsimonious Determinants of pre-incubated aca-demic spin-offs initial performance: A configurational per-spective. Journal of Technology Management & Innovation, 6(2), 50-65.
FUMI, A., Scarabotti, L., Schiraldi, M. (2013a). Minimizing warehouse psace with dedicated starage policy International Journal of Business Engineering and Management, 5(21), 1-11 FUMI, A., Scarabotti, L., Schiraldi, M. (2013b). The effect of slot-code optimization in warehouse order picking. Inter-national Journal of Business Engineering and Management, 5(20), 1-10
FUMI, A., Scarabotti, L., Schiraldi, M. (2013c). The effect of slot-code optimization on travel times in common unit-load warehouses. International Journal of Services and Opera-tions Management, 15(4), 507-527
GONZÁLEZ ORTIZ, R., Zúñiga Álvarez, A. (2011). Método CEPCES para la Evaluación del Potencial Emprendedor. Jour-nal of Technology Management & Innovation, 6(1), 77-99. GRAS, J., Lapera, D., Solves, I., Jover, A., Azuar, J. (2008). An empirical approach to the organisational determinants of spin-off creation in European Universities. International En-trepreneurial Magazine, 4(2), 187-198.
GRECO, M., Branca, A., Morena, G. (2011). An experimental study of the reputation mechanism in a business game. Simu-lation & Gaming, 42(1), 27-42.
GRECO, M., Cricelli, L., Grimaldi, M. (2013). A strategic man-agement framework of tangible and intangible assets. Euro-pean Management Journal, 31(1), 55-66.
GRECO, M., Grimaldi, M., Hanandi, M. (2013). How to se-lect knowledge management systems: a framework to sup-port managers. International Journal of Engineering Business Management, 5(4), 1-11.
GRIMALDI, M., Cricelli, L., Greco, M. (2013). The assessment of the intellectual capital impact on the value creation pro-cess: a decision support framework for top management. International Journal of Management and Decision Making, 12(2), 146-164.
VAN BURG, E., Romme, A., Gilsing, V., Reymen. (2008). Creat-ing university spin-offs: A science-based design perspective. Journal of Product Innovation Management, 25(2), 114-128. VOHORA, A., Wright, M., Lockett, A. (2004). Critical junc-tures in the development of university high-tech spinout companies. Research Policy, 33(1), 147-175.
WRIGHT, M., Clarysse, B., Mustar, P., Lockett, A. (2007). Aca-demic entrepreneurship in Europe. Cheltenham (UK): Ed-ward Elgar.
WU, W., Lee, Y. (2007). Selecting knowledge management strategies by using the analytic network process. Expert Sys-tems with Applications, 32(3), 841-847.
ROTHAERMEL, F. T., Agung, S. D., Jiang, L. (2007). University entrepreneurship: A taxonomy of the literature. Industrial and Corporate Change, 16(4), 691-791.
SAATY, T. L. (1980). The Analytic Hierarchy Process. New York, NY: McGraw-Hill.
SAATY, T. L. (1990). How to make a decision: the analytic hi-erarchy process. European Journal of Operational Research, 48(1), 9-26.
SAATY, T. L. (1996). Decision making with dependence and feedback: the analytic network process. Pittsburgh, PA: RWS. SAATY, T. L. (2004). Fundamentals of the analytic network process — Dependence and feedback in decision-making with a single network. Journal of Systems Science and Sys-tems Engineering, 13(2), 129-157.
SAATY, T. L. (2006). Fundamentals of Decision Making and Priority Theory with the Analytic Hierarchy Process. Pitts-burgh, PA: RWS.
SALMADOR, M. P., Bueno, E. (2007). Knowledge creation in strategy-making: Implications for theory and practice. Euro-pean Journal of Innovation Management, 10(3), 367-390. SHANE, S. (2002). Executive forum: University technology transfer to entrepreneurial companies. Journal of Business Venturing, 17(6), 537-552.
SHANE, S. (2004). Academic entrepreneurship: University spin-offs and wealth creation. Cheltenham: Edward Elgar Publishing.
SIEGEL, D., Veugelers, R., Wright, M. (2007). Technology transfer offices and commercialization of university intellec-tual property: performance and policy implications. Oxford Review of Economic Policy, 33(4), 640-660.
STEENKAMP, N., Kashyap, V. (2010). Importance and con-tribution of intangible assets: SME’s managers’ perceptions. Journal of Intellectual Capital, 11(3), 368-390.
TAN, H., Plowman, D., Hancock, P. (2008). The evolving re-search on intellectual capital. Journal of Intellectual Capital, 9(4), 585-608.
TROTT, P., Scholten, V., Hartmann, D. (2008). How university incubators may be overprotective and hindering the success of the young firm: Findings from a preliminary study. (p. 1-5). Europe: International Engineering Management Conference.