Separation of multiple Secondary Surveillance Radar sources
in a real environment for the near-far case
Petrochilos
(1), E. G. Piracci
(2), G. Galati
(2)(1) University of Hawaii at Manoa, 2540 Dole Street, Honolulu, HI 96822
(2) Tor Vergata University, DISP, via del Politecnico 1, 00133 Rome Italy
E-mail:
[email protected]
,
[email protected]
Abstract
Multilateration systems based on Secondary Surveillance Radar (SSR) systems and omni-directional antennae are operational today [1,2]. Assuming the replacement of the single-element antenna by an array, we proposed new algorithms to discriminate overlapped
signals in previous works [3,4,5]; other solutions were also proposed in the literature
[6,7,8]. Unfortunately, all have either some shortcomings, or an expensive computational cost, or no simple practical implementation. Therefore, we proposed in [9] a reliable, simple, and effective projection algorithm. Nevertheless, some issues were overlooked: in particular the relative power ratio between the signals to be separated may be important, which we study in this paper with real-life signals.
Introduction
Multilateration systems implement location and identification of cooperating aircraft in the airport area and beyond. These systems are based on a network of interrogating and receiving stations, which use the Secondary Surveillance Radar (SSR) Mode S signals. The SSR Mode S signals (hereafter : replies) are a pulse position modulated finite-length signal at a carrier frequency of 1090 MHz (see [10]). The Multilateration systems rely on the estimation of time of arrival, of the target emitted signal, to perform intersection of hyperbolic surfaces. Using a vehicular (i.e. a non-airborne standard) transponder is possible to extend the surveillance to cooperating vehicles [11]. Long range distributed receive stations allows to perform a wide area multilateration (WAM) extending the surveillance area. These two enhancements increase the number of received replies per unit time. The use of omni-directional antennae at the receive station improve the probability of overlapped Mode S signals in the time domain. When replies overlap, very often the message transmitted by the aircraft is corrupted and cannot be recovered, nor the aircraft can be located and identified [12].
Source separation based on array response matrix, for instance [6], is not reliable, as it needs a perfect calibration and does not tolerate multipath. High-Order Statistic Separation algorithms [7] can't be used, as the replies are ``pseudo-Gaussian'' up to order 5 [13]. Deterministic separation algorithms have been considered in [8,4,5], but they have a high computational burden, and need a joint diagonalisation of several tensors of order at least 3.
In [9] and [14], we proposed two solutions addressing two different problems: the PA (Projection Algorithm) [9] separates two mixed Mode S on the condition that there are time intervals in which each one of the overlapped replies is free from overlapping - while the EPA (Extended PA) [14] has the potential to separate any kind of mixture. Nevertheless, it has been acknowledge that when the condition required by PA is
3988 1-4244-0878-4/07/$20.00 ©2007 IEEE
satisfied, the PA is more efficient and robust than the EPA. One problem not addressed previously is the case of replies of unequal power: this is the well-known “near-far” scenario, which we study in this contribution. We present the data model and the PA algorithm for array antenna system. Then we present an analysis of the algorithm performances on an extensive library of real data acquired by an experimental platform that we designed in TU Delft, before concluding.
Data model and PA: Projection algorithm
The precise model can be found in [10], but also in [3,4,5,7,8,9,11,12,13,14], for sake of space, let us admit that we receive on an m elements array antenna and d independent source signals. The base band signals are sampled at frequency T and stacked in vectors
x[n] (size m). After collecting N samples, the observation model is:
=
+
X M S N
,Where X=[x[1],…,x[N]] is the m N× received signal matrix, and the d×N matrix
S=[s[1],…,s[N]] is source matrix, with s[n]=[s1[n],…, sd[n]]T being the stacking of the d
source signals, with zero-padding to account the limited time extend of the sources. N is the m×N noise matrix, whose elements are temporally and spatially white. M is the m×d mixing matrix that contains the array signatures and the complex gains of the sources. We assume that the replies are independent (so uncorrelated). Finally, we assume d < m and M is full column rank.
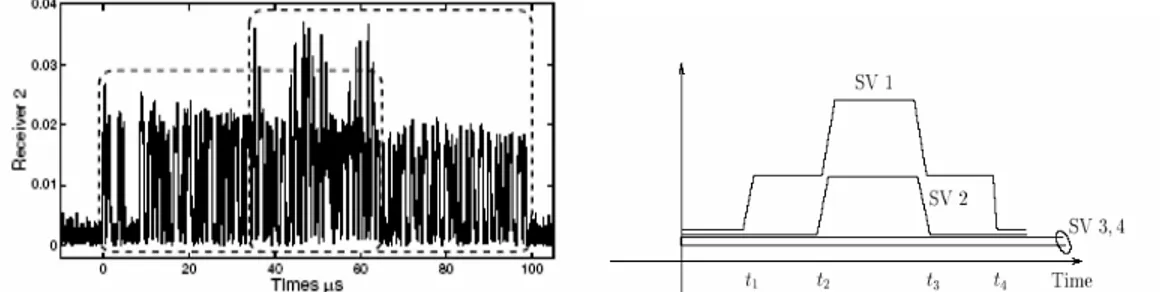
In this work we consider the case of two sources, i.e. two overlapping Mode S signals of equal length. (See Fig. 1.a). If the two Mode S replies have significantly different times of arrival, t1 and t2, the times support of the two sources is partly overlapping. Then at the beginning of the data record (t1 till t2) there is only one source present; and at the end of the data (t3 till t4), only the second source is present.
The first step of the algorithm consists in the detection of the ti’s. The data - resulting from signal sampling at 50Ms/s - is sliced by time slots of 200 samples (4 µs), on each time slot is performed a whiteness test based on the Singular Value Decomposition (SVD), (See Fig. 1.b) of the matrix X.
This allows us to estimate the presence of the sources as a function of time, and to isolate
the two time support when each source is single. By the notation ( )(1) the matrix
collecting the subset of the columns related to the time interval t1 till t2 (selection of the columns). Similarly, we define the notation ()(2) for the subset of the columns related to t3 till t4. then we have the following relationship:
) 1 ( ) 1 ( ) 1 (
MS
N
X
=
+
andX
(2)=
MS
(2)+
N
(2)where the matrix (S)(1) is the sub-matrix of S containing the samples in [t
1,t2]. Therefore (X)(1) contains only the first source and can be simplified as (resp. for (X)(2)):
) 1 ( ) 1 ( 1 1 ) 1 (
m
s
N
X
=
+
and (2) (2) 2 2 ) 2 (m
s
N
X
=
+
Fig. 1: A record of two overlapped Mode S, and the singular values as function of time
3989
^
^
^
^
^
where the m1’s are the columns of M, and the s1’s the rows of S. Note that(X)(1) and (X)(2)
are rank-one matrices in the noiseless case. By SVD on (X)(i), we can estimate the main
vector m1, which is the vector corresponding to the highest singular value. Once the
space signatures m1 and m2 have been identified, the matrix M is thus estimated. We
finally multiply X by the Moore-Penrose pseudo-inverse of M (M†=(MHM)-1MH), and
recover the estimated sources:
†
ˆ =
S M X
Experimental performances
The SSR signals are received and recorded by means of an ad-hoc acquisition system by the Technical University of Delft (CAS/IRCTR, TUD). This system is made up by a four-elements receive array connected to a wide band acquisition system. Due to the lack of
real overlapping cases (27 cases), we present the performance of our algorithm with semi-synthesized signals. We mean by the term “semi-synthesized” that we mix (by a coherent sum) two real single signals digitally after the recording, in order to obtain an overlapping case. This is reasonable as some preliminary studies have shown the linearity of the acquisition system. This method permits to set the SNR of each source (hence their relative power), as well their difference in TOA. We compare the PA with the MDA [5], but also with the conventional decoding algorithm presently used, and to the version with a matched filter presented in [12]. In [3,5], mainstream algorithms [6,7,8,…] have been evaluated, which did not shown good performances. For sake of clarity on Figure 2, we do not present them here. In this study the SNR of the trailing source is 15 dB, and the relative power of the leading one ranges in [-10,…,10] dB, i.e. its absolute SNR ranges in [5,…,25] dB; finally, the time delay is, again, set to 6 µs.
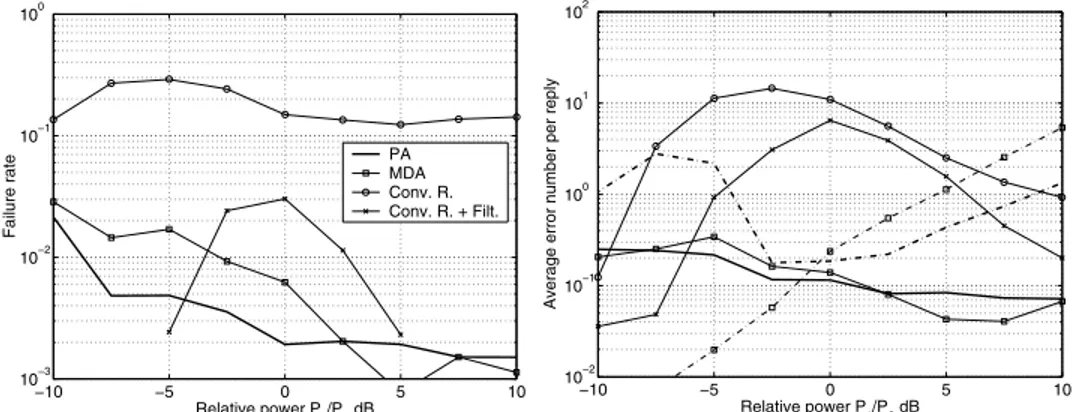
Figure 2.-left presents the failure rate as a function of the ratio between the power of the leading and trailing sources. This is a situation that most likely happens in our problem. First, we note that the conventional receiver is equally bad for every situation; but next to it, we have a very interesting discovery, which is that the Conventional receiver with a matched filter under-perform only for two sources of equal power, and, conversely, when one source is largely dominant over the other, it can without failure recover it (nevertheless, by its intrinsical nature it may recover only one source). Lastly, we note that the MDA and the PA have a failure rate decreasing as the SNR of the leading source increase, with a similar rate.
−10 −5 0 5 10 10−3 10−2 10−1 100 Relative power P 1/P2 dB Failure rate PA MDA Conv. R. Conv. R. + Filt. −10 −5 0 5 10 10−2 10−1 100 101 102 Relative power P1/P2 dB
Average error number per reply
Fig. 2: The failure rate (left) and the average error number per reply(right) versus the power ratio of the sources. The plain curves refer to the leading reply, and the dash-dotted
to the trailing reply.
3990
In Figure 2.-right the average number of errors is plotted as a function of the ratio between the power of the leading and trailing sources. Unlike the results from [9], the average number of errors for the leading and the trailing sources are dissimilar, which makes sense as the SNR are now very much different. These results show the capability of PA in most cases to correctly decode the leading reply even in the very critical situation when its SNR is smaller than the one of the trailing reply and is as low as 5 or 10 dB (SSR operation is generally considered reliable for SNR > 20 dB).
Conclusion
In this contribution, we demonstrated with real-recorded semi-synthesized measurements that our algorithm to discriminate and decode Mode S replies in typical Multilateration environments is efficient and outperforms the known existing solutions, in particular in those situations where the near-far effect could make the other algorithms useless.
References:
[1] P. Bezousek, “A passive radar surveillance system VERA for ATC,” in IRS'98, Munich, Germany, 1998.
[2] G. Galati, “USA Patent 6,819,282 B1,” 16 Nov. 2004, EU patent 02728019-7-2220-IT 0200206.
[3] N. Petrochilos, “Algorithms for Separation of Secondary Surveillance Radar Replies,” Ph.D. thesis, University of Nice-Sophia-Antipolis and TU Delft, Nice, France, July 2002 (http://cas.et.tudelft.nl/~nicolas) ISBN 90-407-2371-0, in english. [4] N. Petrochilos and A.J. van der Veen, “Algorithms to separate overlapping secondary
surveillance radar replies,” in Proc. of ICASSP 2004, 17-21 May 2004, pp. II.49-53. [5] N. Petrochilos and A.J. van der Veen, “Algebraic algorithms to separate overlapping
secondary surveillance radar replies,” IEEE Trans. on Signal Proc., accepted, 2007. [6] R. Roy and T. Kailath, ”ESPRIT estimation of signal parameters via rotational
invariance techniques,” IEEE Trans. on Signal Processing, vol. 37, no. 7, pp. 984--995, July 1989.
[7] E. Chaumette, P. Comon, D. Muller, “An ICA-Based Technique for Radiating Sources Estimation; Application to Airport Surveillance", IEE Proceedings - Part F, vol. 140, pp. 395-401, December 1993.
[8] A.J. van der Veen and J. Tol, “Separation of zero/constant modulus signals,” in Proc. IEEE ICASSP, Munich (FRG), April 1997, pp. 3445--3448.
[9] N. Petrochilos, G. Galati, L. Mené, E. Piracci, “Separation of multiple Secondary Surveillance Radar sources in a real environment by a novel projection algorithm”, in Proc. of IEEE ISSPIT 2005, (Athens, Greece), 17-21 December 2005.
[10] M.C. Stevens, Secondary Surveillance Radar, Artech, Norwood, MA, 1988.
[11] G. Galati, P. Magarò, E.G. Piracci, L. Cicciotti, “Multilateration applied to
airport vehicles management systems: the Agile Transponder”, in Proc. of EuMW 2006 - EuRAD, (Manchester, GB), 12-15 September 2006.
[12] Gaspare Galati, Simone Bartolini, and Luca Menè, “Analysis of SSR signals by
super resolution algorithms,” in Proc. of IEEE ISSPIT-04, Roma, Italy, Dec 2004.
[13] N. Petrochilos and P. Comon, “A zero-cumulant random variable and its
applications,” Signal Processing Magazine, vol 86, pp. 3334-3338, 2006,
[14] N. Petrochilos, G. Galati, E. G. Piracci, “Projection techniques for separation of
multiple secondary surveillance radar sources in a real environment”, in Proc. of IEEE SAM 2006, (Waltham, MA), 12-14 July 2006.
3991