DEPARTMENT OF NEUROSCIENCES, BIOMEDICINE AND MOVEMENT SCIENCES
Ph.D. Life and Health Sciences School
Biomolecular Medicine Program
Cycle XXX
S.S.D. BIO/10
Thesis:
Chronic hypoxia induces dormancy in breast cancer cell line MDA-MB-231
Coordinator: Prof.ssa Lucia De Franceschi __________________________________
Tutor: Prof.ssa Sofia Giovanna Mariotto __________________________________
Co-tutor: Dr.ssa Elena Butturini
__________________________________
Candidate: Dr. Michele Rossin ________________________________
ABSTRACT ... 4
1. INTRODUCTION ... 6
1.1 Tumor microenvironment ... 6
1.1.1 Hypoxia in tumor microenvironment ... 9
1.1.2 Signaling pathways in hypoxic tumor microenvironment: hypoxia inducible factors ... 10
1.1.3 ROS production in tumor microenvironment ... 13
1.2 Tumor dormancy and the interplay with tumor microenvironment ... 15
1.2.1 Signaling mechanisms in tumor dormancy ... 19
1.3 Cancer stem cells in tumor microenvironment ... 22
1.3.1 Tumor dormancy and cancer stem cells ... 23
1.4 Autophagy ... 24
1.4.1 Autophagy sustains survival of dormant cancer cells ... 27
2. AIM OF THE THESIS ... 29
3. MATERIALS AND METHODS ... 30
3.1 Cell lines and cells culture ... 30
3.2 Morphological analyses of dormant cells and tumorspheres ... 30
3.3 Cells viability ... 31
3.4 Immunophenotype ... 31
3.5 Cell cycle ... 31
3.6 Cell proliferation ... 31
3.10 Western Blot ... 33
3.11 Real time PCR ... 34
3.12 Detection of autophagic markers ... 35
3.13 Statistical analysis ... 35
4. RESULTS ... 36
4.1 Survival of the cells under chronic hypoxia ... 36
4.2 Analysis of redox state under chronic hypoxia ... 40
4.3 Evaluation of energy metabolism under chronic hypoxia ... 41
4.4 Chronic hypoxia induces different protein profile in MDA-MB-231 ... 43
4.5 Chronic hypoxia selects cancer stem cells population ... 43
4.6 Autophagy sustains MDA-MB-231 under chronic hypoxia ... 46
5. DISCUSSION ... 49
6. REFERENCES ... 52
SOMMARIO
Il microambiente tumorale, ossia l’insieme di cellule e componenti extracellulari che si sviluppano attorno ad un tumore solido, non solo partecipa attivamente alla progressione del tumore stesso, ma anche contribuisce allo sviluppo della chemioresistenza e alla comparsa di metastasi. A causa della struttura anomala dei vasi sanguigni e della rapida proliferazione delle cellule tumorali, l’ambiente tumorale è in alcune parti caratterizzato da zone di parziale o totale ipossia. Sebbene gran parte delle cellule tumorali non sopravviva in queste condizioni ipossiche, una parte di esse si adatta, entrando in uno stato di dormienza, una particolare fase della progressione del tumore, in cui le cellule presentano un basso flusso metabolico e sono bloccate nella fase G0/G1 del ciclo cellulare. Queste cellule possono restare quiescenti per molto tempo senza dare sintomi clinici, sfuggire alle terapie e in condizioni ambientali appropriate ricominciare a proliferare dando origine a metastasi.
Sebbene molti dati sperimentali e clinici individuino nella dormienza uno dei principali responsabili della formazione di metastasi e del fallimento di alcune chemioterapie, tale fenomeno rimane un processo non ancora completamente chiarito in quanto sono presenti pochi modelli cellulari in vitro che permettono di definire le risposte biologiche delle cellule dormienti.
In questo lavoro, esponendo la linea cellulare umana di tumore al seno MDA-MB-231 ad almeno 3 cicli di ipossia (1% O2) e successiva riossigenazione, abbiamo selezionato una sub-popolazione di cellule resistenti all’ipossia. Tali cellule, chiamate chMDA-MB-231, coltivate in ipossia per lungo tempo sopravvivono, entrando in uno stato di dormienza.
La trasformazione delle cellule MDA-MB-231 in chMDA-MB-231 è legato alla diminuzione del rapporto p-ERK/p-p38, uno dei principali switch molecolari della dormienza in un microambiente avverso descritti in letteratura. Questo stato di dormienza è reversibile poiché, una volta rimesse le cellule in normossia, la proliferazione riprende in 2 settimane.
Inoltre, i risultati ottenuti dimostrano che lo stress indotto da diversi cicli di ipossia e riossigenazione ha selezionato cellule con un fenotipo staminale CD24 -/CD44+/ESA+ e caratterizzate dalla capacità di formare sferoidi.
Infine, le cellule chMDA-MB-231 sopravvivono in queste condizioni di dormienza attivando il processo autofagico in quanto presentano alti livelli di autofagolisosomi e della proteina LC3-II.
In conclusione, il modello presentato rappresenta un valido approccio sperimentale per selezionare cellule dormienti caratterizzate da marcatori di staminalità tumorale utile per lo sviluppo di nuovi agenti chemioterapici che possano colpire tali cellule, impedendo loro di formare metastasi, o renderle maggiormente sensibili ai chemioterapici.
ABSTRACT
The tumor microenvironment (TME) is recognized as a key factor in multiple stages of disease progression, local resistance, immune-escaping and metastasis. TME is the product of developing crosstalk between different cells types and components, which provide an essential communication network through the secretion of growth factors and chemokines, and induce oncogenic signals enhancing cancer-cell proliferation and invasion.
The rapid proliferation of tumor cells and the aberrant structure of the blood vessels within tumors result in a marked heterogeneity in the perfusion of the tumor tissue with regions of low oxygen or hypoxia. Although most of the tumor cells die in these hypoxic conditions, a part of them can adapt and survive for many days or months in a dormant state. Dormant tumor cells are characterized by cell cycle arrest in G0/G1 phase as well as low metabolism and, are refractive to common chemotherapy giving rise to metastasis. Despite these features, the cells retain their ability to proliferate when conditions improve.
Exposing human breast cancer cell line exposure MDA-MB-231 to at least three cycles of 1% O2 hypoxia and reoxygenation, we select a subpopulation of hypoxia resistant cells. These cells, designed as chMDA-MB-231, stably survive under 1% O2 hypoxia condition by entering in dormant state. The reprogramming of cells into tumor dormancy results from the low p-ERK/p-p38 ratio that is described as the molecular switch of tumor dormancy in restrictive environment. This dormant state is reversible since once replaced in normoxia the cells recover the
proliferation rate in 2 weeks. Moreover, the data in this thesis demonstrate that cycling hypoxic/reoxygenation stress selects dormant MDA-MB-231 cells that present the cancer stem-like phenotype characterized by CD24-/CD44+/ESA+ expression and spheroid forming capacity.
Different reports recognize autophagy as a mechanism activated by microenvironment stresses that may contribute to survival of cells in tumor dormancy. Interestingly, we found that chMDA-MB-231 cells have a high level of autophagy, as measured by the detection of autophagolysome and LC3-II expression, suggesting that autophagy may be the survival mechanism of dormant chMDA-MB-231 cells.
We believe that the proposed experimental approach to select dormant breast cancer cells could provide a rationale for the development of novel agents to target dormant tumor cells population.
1. INTRODUCTION
1.1 Tumor microenvironment
For many years, cancer has been considered a complex disease driven by genetic mutations and genomic instability. It is now clear that cancers are not just masses of malignant cells but also intricate organs, to which cells are recruited and interaction between malignant and non-transformed cells contributes to the development and progression of cancer itself.
Tumor microenvironment (TME) is comprised of a complex network of
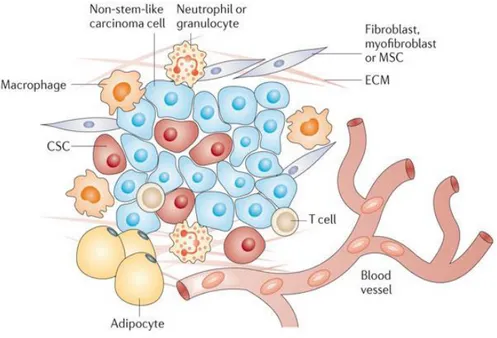
components that are not mere bystanders, but regulate tumor initiation, malignant progression and metastasis and has profound effects on therapeutic efficacy (1). These elements can be widely classified into three main groups: (i) cells of haematopoietic origin, (ii) cells of mesenchymal origin and (iii) non-cellular components (Figure 1) (2). First, cells of haematopoietic origin arise in the bone marrow and can be subdivided into cells of lymphoid lineage consisting of T cells, B cells, natural killer cells, and those of the myeloid lineage, which include macrophages, neutrophils and myeloid-derived suppressor cells. The different subsets of cells have either positive or negative effects on the outcome of the tumor. Importantly, interactions between cell types within the stroma can also have a major role in tumor progression, as has been shown, for example for CD4+ T cells and macrophages (3).
Then, cells of mesenchymal origin derive from the mesenchyme and include fibroblasts, myofibroblasts, mesenchymal stem cells, adipocytes and endothelial cells. Myofibroblast and mesenchymal stem cells directly support cancer stem cells (CSCs) by creating a favorable niche and facilitating tumor progression, while endothelial cells constitute the walls of blood vessels and have a major role in vascular functionally and angiogenesis. So far, adipocytes were thought only as energy storage houses; however, recent studies have revealed the importance of factors secreted by adipocytes in tumor progression (1).
Finally, the extracellular matrix, the major non-cellular component of the TME, is involved in the formation of a stem cell niche. Although it acts to maintain tissue
architecture and prevent cancer cells formation, an abnormal ECM has been shown to promote tumor growth and angiogenesis (4).
Figure 1. Components of tumor microenvironment. In TME there are cells of hematopoietic
origin (T-cells, B-cells and NK-cells), cells of myeloid lineage (macrophages, neutrophils and
myeloid-derived suppressor cells), cells of mesenchymal origin (fibroblasts, myofibroblasts, mesenchymal stem cells –MSCs-, adipocytes, endothelial cells and extracellular matrix (ECM).
Image taken from: “What constitutes the tumor microenvironment: Tackling the cancer stem cells - what challenges do they pose? Pattabiraman et al., Nat Rev Drug Discov, 2014”.
Many hallmarks of cancer are related to TME, including the ability to induce proliferation and inhibit apoptosis, to reprogram metabolism, to increase factors that support cancer invasion and metastasis and to promote angiogenesis and avoid hypoxia.
Because the rapid proliferation of the cells requires an accelerated production of basic cellular building blocks, differences in cellular metabolic programs occur within the cells of TME and some proteins, such as HIF-1α, P13K, AKT, p53, PTEN, known as crucial components in the metabolic pathways, can be differently regulated in cancer cells (6). Although recent studies have revealed the importance of fatty acids and proteins as fuel sources for cancer cells, aerobic glycolysis (Warburg effect) remains the major fuel source for tumor cells (7). It is well described that cancer cells can metabolize 10-fold more glucose to produce
lactate than normal tissues. Despite enhanced glycolysis, most cancer cells also maintain mitochondrial respiration to produce a significant fraction of ATP. The metabolic switch of cancer cells toward a more glycolytic phenotype increases the concentration of protons [H+], causing the acidification of cytoplasm. To overcome low intracellular pH (pHi), cancer cells employ a large redundancy of mechanisms, such as the activation of plasma membrane proton pump ATPase (V-ATPase), carbonic anhydrases (CAIXs) and Na+/H+ exchangers or anion exchangers that determine a slow increase of pHi. In response to H+ efflux, the pH of tumor extracellular space (pHe) becomes acidic, forming a reversed pH gradient. The acidosis of TME promotes cancer progression and induces migration and invasion (8).
Moreover, TME is characterized by disorganized blood vessels that are immature, tortuous and hyperpermeable. The tumor vasculature is typically a complex labyrinth of vessels in which arterioles, capillaries, and venules are not clearly identifiable. Furthermore, tumor vessels are more permeable than normal ones because they are poorly invested with smooth muscle cells, and have a discontinuous endothelial cell lining with an abnormal basement membrane. Increased vessel permeability results in aberrant osmotic forces, leading to accumulation of vascular contents and elevated interstitial fluid pressure. As result, the irregular vasculature system leads to impaired blood flow of tumor, where vessels cannot supply nutrient to cells and remove waste products. In addition, the aberrant geometry of vessels causes an inadequate oxygen supply to tumor cells with micro-regional hypoxia. These particular characteristics of tumor vasculature lead to adverse micro-environmental conditions that obstruct traditional therapeutic anti-cancer strategies (9,10).
Overall, the manipulation of TME could be used as a valid approach to formulate new therapeutical cancer treatment and identifying the most important molecular players in TME represents the first step toward this goal.
1.1.1 Hypoxia in tumor microenvironment
O2 is an important factor in cells metabolism and the maintenance of O2 homeostasis is essential for the survival of the cells. Indeed, O2 is the final electon acceptor during mitochondrial ATP production and other intracellular reactions. As described above, most of solid tumors are characterized by regions of hypoxia, which result from structural abnormalities of vasculature network, rapid growth of tumor cells and high interstitial pressure. In this microenvironment cells undergo genetic and adaptive changes that allow them to survive and even proliferate. Tumor tissues are characterized by 1-2% O2 levels or below; these concentrations depend on the initial oxygenation of the tissue, the size and the stage of the tumor as well as on the methods of measurements and in which part of the measurement is performed.
The two most frequently described and investigated subtypes of tumor hypoxia are acute and chronic. These two subtypes can lead to completely different hypoxia-related responses within the tumor, which could have a direct effect on tumor development and response to treatment. In order to accurately assess the specific biological consequences, it is important to understand which time frames best define acute and chronic hypoxia. The discrepancy and lack of clear description about the time frames and the biological consequences of acute and chronic hypoxia are often considered a great problem in oncology (11,12).
Generally, it is accepted that acute hypoxia is an abrupt and brief exposure to hypoxia, which occurs when vessel occlusion lasts for several minutes until hours. It is reversible and often leads to following oxygen fluctuations called cycling hypoxia (13,14). Different in vitro models of acute hypoxia are set up by exposing cells to continuous hypoxia between few minutes to 72 hours. Short-term hypoxia allows cells to survive by activating different mechanisms such as autophagy that is achieved by decreasing oxidative metabolism. Furthermore, it has been described that high level of reactive oxygen species (ROS) induced by acute or cycling hypoxia may contribute to tumor cells survival (13,15). Conversely, enduring changes in blood flow and low oxygen availability, which are especially pronounced in larger tumors, result in chronic hypoxia and contribute to long-term cellular changes. In experimental setting, chronic conditions are achieved
incubating the cells in hypoxia between few hours and as long as several weeks. Longer exposure to hypoxia is associated with high frequency of DNA breaks, accumulation of DNA replication errors since hypoxia hampers DNA repair systems leading to genetic instability and mutagenesis. Moreover, chronic hypoxia induces metabolic switch from oxidative phosphorylation to anaerobic glycolysis that leads to continuous lactate production from pyruvate resulting in acidosis (16). Even if both acute and chronic hypoxia can increase resistance to therapy, chronic hypoxia is associated with more aggressive tumor phenotype through the development of micro-niches of quiescent cells and induction of spontaneous metastasis (11,17,18). In any case, cycling hypoxia/reoxygenation represents the oxygenation state that better reflects in vivo situation. The biological responses activated by reoxygenation can instigate continuous adaptive mechanisms that contribute to increase the aggressiveness of the cancer cells. Thus, the chemoresistance, the radio-resistance and the ability to proliferate or metastasize are extensively enhanced during hypoxia/reoxygenation cycles. Although different hypoxic stimuli within tumors makes it difficult to generalize the real effects on tumor biology, and metabolism, it is now well known that the biology of hypoxic cancer cells is the product of the interplay between the prevailing oxygen tension, hypoxia-induced signaling, and cellular damage by ROS (13).
1.1.2 Signaling pathways in hypoxic tumor microenvironment: hypoxia inducible factors
Hypoxia inducible factors (HIFs) are heterodimeric transcription factors consisting in a stable and constitutively expressed β-subunit (HIF-1β) and an oxygen sensitive α-subunit (HIF-1α). To date, three isoforms of HIF-α subunit (1α, 2α and 3α) have been described, from which 1α and HIF-2α are the best characterized. While HIF1α is expressed ubiquitously, HIF2α is expressed in more restricted number of cell types such as hepatocytes and endothelial cells.
HIF activation is a multi-step process involving HIF-α stabilization, nuclear translocation, heterodimerization with HIF-1β and transcriptional activation of
genes that function in angiogenesis, tumor vascularization and chemoresistance. The key regulation of HIF-1 signaling is orchestrated by two types of oxygen-sensor proteins: prolyl hydroxylase (PHDs) and asparaginyl hydroxylase (FIH), known as factors inhibiting HIF-1α through hydroxylation under normoxic condition. Specifically, PHDs hydroxylate two conserved prolyl residues in HIF-1α allowing a rapid interaction with the von Hippel-Lindau tumor-suppression protein (VHL), a component of E3 ubiquitin ligase complex. Subsequently, HIF-1α becomes marked with polyubiquitin chains that drive them to destruction by the proteasome system.
Another oxygen-dependent major mechanism for negative regulation of HIF-1α pathway does not involved VHL protein. In this case, FIHs hydroxylate an asparagine residue in the carboxy-terminal transcriptional activation domain (C-TAD) of HIF-α and block the cooperative interaction with the co-activator CBP/p300 impairing HIF-1α gene transcription (19). Thus, PHDs and FIHs ensure full repression of the HIF pathway under normoxia condition by controlling both the degradation and inactivation of HIF-1α subunit.
On the other hand, when the oxygen level drops, the hydroxylases lose their activity and HIF-1α is stabilized , translocates to the nucleus where dimerize with the constitutively expressed HIF-1β subunit. HIF complex binds to DNA in the hypoxia-response elements (HRE) region and promotes transcription of genes involved in angiogenesis, metabolic adaptation, survival, apoptosis and cells migration (20).
Figure 2 is a schematic representation of HIF-1α signaling pathway under normoxia and hypoxia.
Figure 2. HIF-1α oxygen-dependent regulation. HIF-1α protein is oxygen-sensitive and its stability dependes on O2 level. In normoxic conditions, PHD enzymes hydroxylate proline 402 and
564 in HIF-1α allowing a rapid poly-ubiquitylation and subsequently proteasome degradation. Furthermore, FIH-1 hydroxylates asparagine 803 in HIF-1α impairing its DNA binding. Under hypoxic conditions, the rate of asparagine and proline hydroxylation decreases and HIF-1a that is not prolyl-hydroxylated is not degradated. HIF-1α dimerizes with the β-subunit and translocates to the nucleus. P402 and P564, proline residues; N803, asparagine residue; HIF-1a, hypoxia-inducible factor 1 alpha; FIH, factor inhibiting HIF; PHD, prolyl-hydroxylase domain; VHL, von Hippel-Lindau; CBP, CREB binding protein; HRE, hypoxia responsive enhancer elements. Image
taken from: “Therapeutic targeting of hypoxia and hypoxia-inducible factor 1 alpha in multiple myeloma, Borsi E., Translational Research, 2014”.
In most in vitro chronic hypoxia studies, HIF-1α subunit levels are increased and stabilized within few hours, but after few days decrease to lower expression levels. This is likely due to the HIF-1-mediated upregulation of PHD2, which retains enough activity to hydroxylate HIF-1α, resulting in its renewed degradation (21). Instead, cycling hypoxia results in an enhanced activity and stabilization of HIF-1α, which is at a much greater level than that in chronic hypoxia (22). This damaging phenotype, where HIF-1α is accumulated, is also associated with an increased resistance to radiotherapy and chemotherapy as well as increased metastatic potential (16).
of glycolysis through the upregulation of almost all glycolytic genes and the monocarboxylate transporters that export lactate. It has been shown to upregulate the expression of genes encoding glucose transporters 1 and 3, glycolytic enzymes such as hexokinase 1 and 3, aldolase A and C and glyceraldehyde-3-phosphate dehydrogenase-6.
HIF transcription factors have also been shown to affect the function and stability of some oncogenes and tumor suppressor genes. Although one of the most studied oncogenes linked to HIF is p53, the relationship between HIF and p53 remains still discussed. Hypoxia has been shown to induce p53 stability in some conditions but the molecular mechanism is unclear (23). It appears that severity and duration of the hypoxic stimulus influence the hypoxia-induced differences in metabolism that are dependent on HIF during acute hypoxia, but engages p53-mediated gene expression changes during chronic hypoxia (16).
HIFs proteins, in particular HIF-1, also regulate a set of genes involved in extracellular matrix remodeling, migration and digestion of the basement membrane. This group includes vimentin, fibronectin, keratins, matrix metalloproteinase 2, cathepsin D that is associated with a concomitant loss of E-cadherin, a crucial feature of epithelium mesenchyme transition (EMT). In this regard, the first evidence linking HIF to decreased expression of E-cadherin was demonstrated in ovarian carcinoma in 1999 when immunolocalization of nuclear HIF-1α showed a strong topological correlation with loss of E-cadherin (24).
1.1.3 ROS production in tumor microenvironment
ROS are a broad class of oxygen radical species that are produced in cells as a normal byproduct of metabolic processes. They are characterized by heterogeneous properties and have a plethora of downstream effects, depending on their concentrations. Under physiological conditions the continuous production and detoxification of cellular ROS lead to a tightly controlled and well-balanced redox status. On the other hand, an imbalance between ROS production and removal results in the accumulation of ROS in the cells and leads to oxidative stress. In order to maintain the redox balance, cells activate some ROS scavenging systems, mainly composed of antioxidant
enzymes and non-enzymatic ROS scavengers. Common enzymes that are involved in the detoxification process of ROS are superoxide dismutase, catalase, peroxiredoxins and glutathione peroxidases. For their reducing power, glutathione and NAD(P)H are the most well-known electrons donators (25). ROS and associated oxidative stress have been historically considered harmful to the cell as they can damage cellular DNA, oxidize fatty acids and aminoacids. The effects of these oxidation lead to tissue destruction associated with various diseases.
Consequences of ROS production in cancer biology are pleiotropic and complex.
Although higher ROS levels are related to cancer cell growth, angiogenesis and metastasis, their role in cancer cells is still disputed. It has been shown that ROS have mainly dual functions, cytotoxic or tumorigenic, depending on different types and levels of ROS (25). At low concentration, ROS seem to increase cell proliferation and survival through the post-modification of some kinases and phosphatases. Conversely, excessive ROS levels irreversibly damage the cellular macromolecular components and result in cell death. Furthermore, high ROS levels can mediate mobility and invasive properties of cancer cells, contribute to extracellular matrix remodeling, increase neo-angiogenesis and induce metabolic reprogramming of both cancer and stromal cells.
TME is characterized by elevated ROS levels that trigger oxidative stress, deeply affecting tumor progression and metastasis. This condition can result from increased basal metabolic activity, mitochondrial dysfunction, peroxisome activity, uncontrolled growth factor of cytokines signaling, and oncogene activity, as well as from enhanced activity of known ROS sources as NADPH oxidase (NOXs), cyclooxygenases (COXs), or lipoxygenases (LOXs) (26,27).
It is well accepted that ROS levels strongly increase during hypoxic exposure, mainly in chronic hypoxia ranges and reoxygenation periods that follow hypoxia (22). These events partially justify the different impacts of continuous and cycling hypoxia on a variety of parameters, such as angiogenesis, metastatic behavior and treatment responses. Mechanisms that mediate adaptation to burst of ROS lead to activate the detoxification systems with an increase of hypoxia-induced glutathione and NAD(P)H synthesis. These signaling pathways in TME,
contribute to render cancer cells even more resistant to a variety of stresses including anticancer drug exposure or mechanical forces when entering the bloodstream (13). Thus, within TME, both ROS production and detoxification are known to be critical to maintain the redox balance for the cancer cells viability (28).
1.2 Tumor dormancy and the interplay with tumor microenvironment
The development of metastasis rather than tumor itself is one of the major causes of death among cancer patients. In some instances, this occurs shortly after primary tumor detection and treatment because tumor cells are already expanding at the moment of the diagnosis. However, in many types of tumors, metastatic diseases occur years or decades after tumor resection. The appearance of tumor relapse after prolonged time is explained by the survival of disseminated tumor cells (DTCs) in a dormant state. These cells survive in a quiescent state and remain undetected for long periods, explaining the prolonged asymptomatic residual disease and treatment resistance.
The period between primary tumor detection and metastatic relapse is often defined as tumor dormancy, a poorly understood stage in cancer progression in which cells are characterized by mitotic cycle arrest in G0/G1 phase and low metabolism (29). This state is reversible and under certain conditions, such as induction by growth factors, cytokines, nutrients, or chemical agents, the cells can re-enter in the cell cycle to proliferate again.
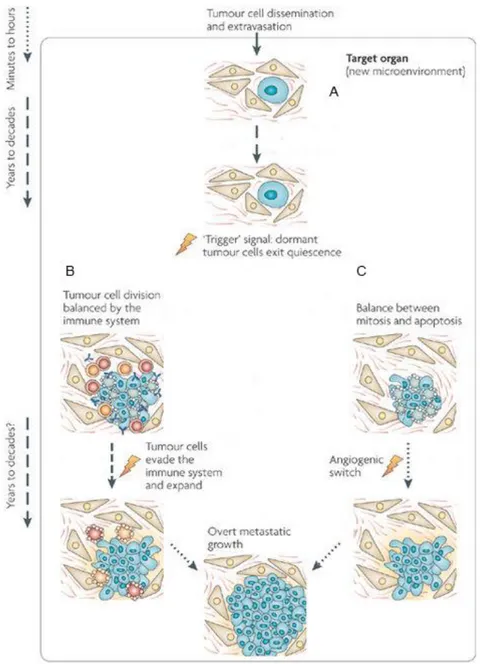
Tumor dormancy results by tumor cell growth arrest (cellular dormancy) and by mechanisms that antagonize the expansion of a dividing tumor cell population (tumor mass dormancy) (Figure 3). The first one can occur when tumor cells enter a state of quiescence. In this regard, the absence of proliferation in dormant cells has been attributed to the up-regulation of cell cycle inhibitors such as p21 and p27. In contrast to single cell dormancy, in tumor mass dormancy, the cells usually divide but the micrometastatic lesion does not expand beyond a certain size because of either limitations in blood supply or an active immune system. It seems to be caused by a balance of cells proliferation and apoptosis, regulated by pro-angiogenic proteins and angiogenic inhibitors produced by tumor and stromal
cells, as well as immunological switches. This phenomenon is also termed
angiogenic dormancy (30). According to this definition, Naumov et al. sustain
that a failure to activate the angiogenic switch contributes to maintain a group of cells in a dormant state (31). Indraccolo et al. reported that a short-term perturbation in a transient angiogenic burst could be sufficed to interrupt tumor dormancy (32). In this regard, therapeutic strategies to target tumor vasculature, such as anti-VEGF drugs, are the current approaches to oppose dormant cells. Tumor mass dormancy can be also maintained by the immune system that controls and does not completely eliminate malignant tumor growth. This process is termed immunologic dormancy and given that tumor cells are inherently genetically unstable, the strong immune pressure placed on tumor cells in equilibrium makes them susceptible to acquire mutations that may allow for immune evasion. These adapted tumors frequently defects in antigen presentation, processing or both, through loss of MHC class I or latent membrane protein (LMP)-family molecules, rendering them undetectable by the adaptive immune system. They are also capable of establishing a global immunosuppressive state in the TME by secreting some cytokines, such as TGF-β and VEGF, or by recruiting immunosuppressive cell type, including T regulatory cells and myeloid-derived suppressor cells (MDSCs). These recruited cells contribute to the anti-inflammatory cytokine production and suppress the anti-tumorigenic capacities of the other immune cell types. Once micrometastases overcome dormancy, they become receptive to signals and cell types within the TME to support their expansion. Thus, controlled immune activation, marked by an induction of T cells, is a promising avenue to force tumor dormancy (Figure 3) (30).
To date, little is known regarding tumor dormancy and the biology of dormant cells. Nevertheless, it is clear that one major driving force for tumor dormancy is cellular environment, which poses a challenge to the cells regarding survival and proliferation. Indeed, cells enter or escape dormancy according to restrictive or permissive microenvironment, adapting themselves to better serve its needs. In the restrictive TME, one of the early responses of tumor cells is to reduce growth and the rate of oxygen consumption. Using immunocytochemical techniques, some researchers have demonstrated that hypoxic tumor cells are in a non- or
slow-proliferating state and a majority of these cells are negative for proliferation markers, such as Proliferating Cell Nuclear Antigen (PCNA) or Bromodeoxyuridine (BrdU) (20).
In according to these evidences, the link between cellular dormancy and TME is highlighted by the fact that if the dormant DTCs are originated from the hypoxic niche of the primary tumor, they may be already pre-programmed to be growth-arrested and enter a dormant state before to reach other sites. On the other hand, the inductor of dormancy can be the restrictive microenvironment of the target organs where the DTCs arrive. However, whether hypoxia signaling prepares a “metastatic soil” in distant organs to remain in a prolonged state of dormancy is not well clarified. However, in several different types of cancers, the bone marrow is a common homing organ for DTCs. In most studies, DTCs are detected in the hypoxic regions of bone marrow and persist there over many years with the potential to recirculate into other organs.
In order to find treatments to remove solitary dormant cells or dormant micrometastasis, the researchers need to understand which mechanisms are responsible for metastatic dormancy and what processes trigger dormancy escape. Next paragraph points out some aspects of the knowledge on the mechanisms underlying dormancy in cancer.
Fig. 3. An integrated view of cancer dormancy. Tumor cells that survive dissemination lodge in the target organ parenchyma. A. This new microenvironment most probably determines the fate of the disseminated tumor cells and could account for most of the dormancy time (cellular
dormancy). If the cells are not genetically progressed it is possible that they are unable to grow
autonomously or transduce growth signals from the microenvironment, instead entering a quiescence-like phenotype. Even with genetic alterations, stress and/or microenvironment signals might impose a growth-suppressive program. For tumor cells, a quiescent state might be a natural response to a microenvironment that lacks recruitment signals, tumor cells can fully progress into overt lesions. B. It is possible that before becoming overt lesions, dormancy might continue owing to the immune system preventing tumor expansion (immunologic dormancy). The immune system might prevent tumor mass expansion for long periods. C. Moreover, a tumor cell mass can enter
angiogenic dormancy. Differentiated tissues can produce angiogenesis inhibitors to maintain
tumor vasculature from expanding for long periods. However, it is still unclear how long this mechanism can be maintained in a genetically unstable proliferative tumor cell population, which probabilistically should be prone to accumulating new genetic alterations that activate the angiogenic switch. Image taken from: “Models, mechanisms and clinical evidence for cancer
1.2.1 Signaling mechanisms in tumor dormancy
To date, several cancer cell-intrinsic pathways that lead to cellular dormancy have been described. The first signaling mechanism that has been connected with the cells proliferation and DTCs dormancy were the balance between the activities of the mitogen-activated protein kinases (MAPKs) ERK1/2 and p38 (33). In particular, the switch toward phosphorylation of ERK1/2 favors proliferation, while predominant phosphorylation of p38 lead to quiescence. It is now well accepted that in a permissive microenvironment, the interaction between DTCs and extracellular matrix as well as stromal cells results in the in activation of mitogenic signaling (high p-ERK/p-p38) that promote cell growth. Conversely, in restrictive microenvironment, where the activation of stress signaling occurs, low p-ERK/p-p38 ratio represents the molecular switch for induction of a prolonged phase of dormancy (34). The activities of these kinases were found to be driven by the interaction of urokinase-type plasminogen activator receptor (uPAR), α5β1 integrin, fibronectin focal adhesion kinase (FAK) and Src-kinases. It has been demonstrated that proliferating cells are characterized by high expression of uPAR that lead to activation of Src-kinase resulting in the ERK1/2 phosphorylation. Increased level of fibronectine also results in ERK1/2 phosphorylation. Conversely, p38 phosphorylation is favored when uPAR expression is lost and fibronectin is absent (35-37).
Recently, it has been shown that transforming growth factor β2 (TGFβ2) activates p38 in cancer cells disseminated to bone inducing dormancy. This correlates with up-regulation of the proliferation inhibitor p27 and down-regulation of cyclin-dependent kinase 4 (CDK4). In this regard, an up-regulation of TGFβ2 and p27 expression induced by hypoxia has been shown in dormant cancer cells, confirming a key role of hypoxia on dormancy (38).
Moreover, phosphorylation of p38 leads to the activation of the unfolded protein response (UPR) pathway, which promotes cells survival and dormancy. Some studies from Aguirre-Ghiso laboratory highlight that, although all the three sensors of UPR, PERK, ATF6, IRE1 are activated in dormant human epidermoid carcinoma HEp3 cell, only PERK activation contributes towards the growth arrest of cells (35,39-41). This occurs by attenuating translation of G1-S transition
regulators such as cyclin D1, D3 and CDK4. On the other hand, the activation of both ATF6 and IRE1 are required for the basal adaptation and cell survival in restrictive microenvironment. This occurs in part via the ATF6 mediated Rheb induction and a strong inhibition of mTOR signaling (Figure 4) (42).
Figure 4. Signaling mechanisms in response to TME. In a permissive microenvironment (right), interactions with the ECM, and stromal cells, allow to DTCs to adapt and integrate growth-promoting signals and activate the mitogenic signaling (high p-ERK/low p-p38 ratio). Conversely, in restrictive microenvironment (left), the loss of surface receptors or the interaction with non-growth-permissive ligands result in activation of stress signaling (low p-ERK/high p-p38 ratio) inducing both dormancy and survival signals. Activation of p38 induces G0/G1 arrest that is mediated by DEC2 e NDRG1, which control the expression of regulators of the cell cycle such as p21 and p27. Furthermore, phosphorylated p38 induces an ER stress response that coordinates growth arrest and survival through the activation of PERK. It leads to the downregulation of cyclin D1/D3 and CDK4 and to the induction of dormancy. ATF6 and IRE1 contribute to DTCs dormancy by promoting survival. ■ Three yellow squares indicate UPR. Image modified from:
“Regulation of tumor cell dormancy by tissue microenvironmentsand autophagy”, Sosa M.S. et al., Adv. Exp. Med. Biol., 2013.
Recently, it has been demonstrated the key role of the suppression of PI3K/AKT pathway in the induction of tumor dormancy as well as in the survival disseminated tumor cells (34). PI3K/AKT signaling regulates cell proliferation, survival and metabolism in cancer cells and it is frequently constitutively activated in multiple human cancers (43). Under prolonged lack of nutrients, the
suppression of AKT activity is necessary for preserving the energy source, decreasing energy demand and activating a strategy of cancer cells to survive in a chronically deteriorated microenvironment (44). The mechanism by which AKT activity is suppressed is not completely understood. It may involve different steps in the PI3K/AKT signaling such as inappropriate activation of receptor tyrosine kinase (RTK), inactivation of upstream kinases, i.e. PI3K, activation of phosphatase PTEN or/and inactivation of mTORC1 (Figure 5). PI3K/AKT axis directly inhibits glycogen synthase kinase 3-beta, which normally suppresses proliferation, and activates the canonical cell cycle pathway. Conversely, the suppression of AKT that occurs in dormant state, allows to activate both CDKs inhibitors p21 and p27 that arrest cell cycle, and the autophagic machinery that protects cells during starvation or stress condition (45).
Fig.5 Prototypic mechanisms of Akt regulation. The lipid kinase PI3K is activated in response to mitogenic signals and phosphorylates the phosphoinositides PI(4)P and PI(4,5)P2 at their D3
position, generating PI(3,4)P2 and PI(3,4,5)P3, respectively. The tumor suppressor PTEN opposes
this activity of PI3K. PI(3,4)P2 and PI(3,4,5)P3 bind to Akt and PDK1, promoting their
translocation to the cell membrane. Akt is then activated by sequential phosphorylation of T308 and S473 by PDK1 and mTORC2, respectively. Akt, in turn, activates mTORC1 indirectly by phosphorylation and inactivation of TSC2, which suppresses the activity of the Rheb GTPase, an activator of mTORC1. Akt also directly activates mTORC1 through phosphorylation of PRAS40, a component of mTORC1. Image taken from: “Akt-dependent and -independent mechanisms of
1.3 Cancer stem cells in tumor microenvironment
Recent studies indicate the presence of a small, intra-tumoral subpopulation of tumor-initiating cancer cells with deregulated stem-cell-like properties that enable them to be resistant to conventional therapies. These tumorigenic cancer cells, called cancer stem cells (CSCs), may be the linchpins of disease recurrence and may significantly contribute to metastasis (2).
Specifically, CSCs exhibit a functional stemness signature comprising self-renewal and ability to differentiate into multiple cancer cells (63). Self-self-renewal is a characterized mitotic cell division in which a stem cell originates one or two undifferentiated cells perpetuating the stem cell pool. On the other hand, the stem cells differentiate into more specialized cell types generating all the diverse cellular phenotypes of the primary lesion (2). Evidences support the vital role of this subset of cells in initiation and maintenance of a tumor in addition to their capability to dictate invasion, metastasis, heterogeneity, and therapeutic resistance. Therefore, the identification and isolation of these CSCs using putative surface markers have been a priority of research in cancer. However, definition of specific CSCs surface markers in all cancer types requires further investigations. It is clear that heterogeneity among tumors renders it difficult to discover unique markers (64).
There are some putative stem cell markers that are in major use for identification and isolation of CSCs from different solid tumors (65-67) Even if every marker shows independent expression, it seems to be a co-expression of surface markers in CSCs, debatable in several cancer types. Indeed, CD44 and CD24 have been used extensively in combination or with other putative markers (CD133, CD166, EpCAM) to isolate CSCs from solid tumors (64). Abraham et al. demonstrated that the majority of breast human tumors tissue (78%) displayed ≤10% CD44+/CD24−/low cells and the remainder contained >10%. (68).
CSCs selection and evolution are influenced by TME that provides a breeding ground to maintain a more stem-like and undifferentiated phenotype. For instance, hypoxia exerts a selective pressure on the CSCs population contributing directly to the development of more aggressive cancer cells and resistance to therapies (69,70). Recently, it has been demonstrated that prolonged hypoxia exposure
results in the induction of genes essential for stem cell function such as Oct4, Nanog and c-Myc. These genes are regulated by HIFs, in particular the isoform HIF-2α, which is specifically involved in the self-renewal and multipotency of CSCs. Molecular database analyses revealed that HIF-2α expression correlates with poor outcome of patients with metastasis and represent a promising target for the eradication of CSCs in cancer therapy (71).
1.3.1 Tumor dormancy and cancer stem cells
There is a tight and complex relationship between stemness and dormancy even if the ability of CSCs to proliferate and initiate robust tumor outgrowth, seems to be incompatible with a cancer dormant state. Elegant studies provided strong evidences for the existence of dormant cells as a subpopulation of CSCs in different tumors such as breast, colon, pancreas and ovary (72-77). Nevertheless, it is important to note that not all dormant cells have the stem like properties of self-renewal and differentiation (78).
Unlike dormant tumor cells that can remain quiescent for several years, it is not clear if CSCs undergo so long phase of quiescence (69). However, it is well described that these dormant CSCs exploit phases of cellular dormancy to ensure tumor maintenance and survival in harmful TME, including growth-inhibitory niches and cytotoxic mileus.
It is clear from the previous discussion that hypoxic TME maintains an undifferentiated and quiescent state of CSCs and, since hypoxia promotes tumor dormancy, it could be one of the key links between the dormancy and the stemness. How the hypoxia triggers CSCs populations towards quiescence is still unclear even if some improvements are carried out. It has been demonstrated that slow-cycling CSCs are more likely localized in the low oxygen area of the tumor, away from the blood vessels whereas the fast-cycling cells with limited self renewal capacities, reside in areas much closer to the vasculature (79).
Moreover, several studies have unraveled intriguing parallels between the mechanisms regulating CSCs behavior and angiogenic control of tumor dormancy. While CSCs might survive in the angiostatic environments associated with dormancy, they also promote cancer vascularization in settings of tumor
outgrowth (80,81). Since CSCs own the ability to promote tumor progression by triggering angiogenic responses, they are likely to represent the dormant tumor populations ultimately responsible for delayed cancer recurrences (79).
Another direct link between CSCs and dormant tumor populations is their converging to survive cancer therapy. Indeed, dormant cells are often spared by current treatment modalities, as determined in both animal models and clinical disease (82,83). Similarly, CSCs frequencies are enhanced in metastatic tumor recurrences post-therapy compared to those in pre-therapy samples. Importantly, therapeutic refractoriness of tumor dormant cells is attributable to several resistance mechanisms also intrinsic to the CSCs compartment, including impairment of cancer apoptotic pathways, alterations of cell cycle checkpoints, and reduced drug accumulation. (84).
Taken together these findings highlight the critical importance of TME in the biology of CSCs that creates a strong relationship with tumor dormancy.
However, in light of the intriguing discussion between CSCs biology and the mechanisms controlling tumor dormancy, insights from CSCs biology could help the future research on tumor dormancy.
1.4 Autophagy
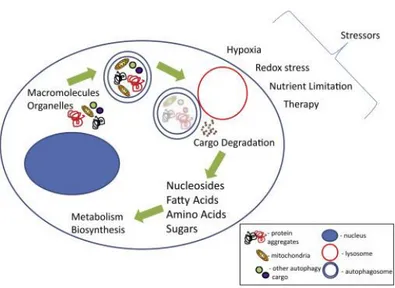
Autophagy, or type II programmed cell death, is a catabolic process, evolutionarily conserved and genetically controlled, whereby cells self-digest intracellular organelles to remove those with compromised function and to maintain cell homeostasis. However, autophagy can also be considered a temporary survival mechanism during periods of starvation where self-digestion offers an alternative energy source and may facilitate the disposal of unfolded proteins under stress conditions. The catabolic function provided by autophagy is thereby suppressed once the external nutrient supply is adequate to support cellular metabolism. Besides starvation, autophagy can be also activated by other physiological stress stimuli, such as hypoxia, endoplasmatic reticulum stress, high temperature, hormonal stimulation or pharmacological agents (85) (Figure 6).
Fig. 6 The process of autophagy leads to the degradation of cargo. The blue double-membraned vesicle, autophagosome; red vesicle, lysosome; blue shaded oval structure, nucleus. Cargo in the autophagosome is represented by the following: mitochondria in yellow, protein aggregates in black and red, and other cargo generally represented in green and purple Image taken
from: “Autophagy and tumor metabolism, Kimmelman AC et al, Cell Metabolism, 2017”.
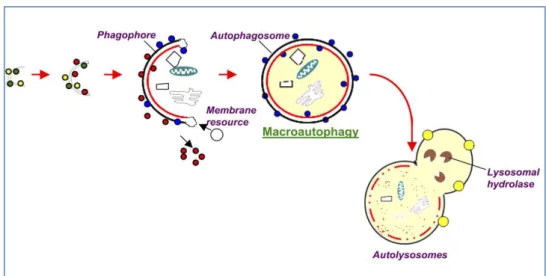
Depending on the mode of cargo delivery to lysosome, autophagy can be subdivided into three subtypes: chaperon-mediated autophagy, microautophagy and the most studied process named macroautophagy (86). Chaperone-mediated autophagy involves the direct translocation of cytosolic proteins across the lysosomal membrane, by molecular chaperones (e.g., the 70 kDa heat shock cognate protein, Hsc70). Microautophagy involves inward invagination of lysosomal membrane, which delivers a small portion of cytoplasm into the lysosomal lumen. Macroautophagy is the most efficient autophagic clearance mechanism and the most common type of autophagy, therefore, hereafter macroautophagy will be referred to as autophagy. Macroautophagy is a process conserved by yeast to mammals and is mediated by a double-membrane special organelle termed autophagosome. Upon induction, a small vesicle (phagophore) elongates and encloses a portion of cytoplasm, which results in the formation of the autophagosome. Then, the outer membrane of the autophagosome fuses with a lysosome to form an autolysosome, leading to the degradation of the enclosed materials together with the inner autophagosomal membrane (Figure 7). Aminoacids and other small molecules that are generated by autophagic
degradation are delivered back to the cytoplasm for recycling or energy production (87). Specifically, the process of autophagosome formation involves two major steps, nucleation and elongation of the isolation membrane, in which different proteins, such as the products of AuTophaGy-related (Atg) genes and microtubule-associated protein light chain 3 (LC3) are involved (88). LC3 is one of the best characterized protein on autophagosome, and therefore, it serves as widely used marker of autophagy (89). It is expressed in cells as a full-length cytosolic protein that, upon autophagy induction is proteolytically cleaved, to generate I that is conjugated with phosphatidylethanolamine and forms LC3-II (90-92).
Fig. 7 Macroautophagy steps. Macroautophagy starts with the de novo formation of a cup-shaped isolation double membrane that engulfs a portion of cytoplasm. Colored balls indicate proteins (Atgs, etc) involved in the process. The image is taken from: “Autophagy: molecular
machinery, regulation, and implications for renal pathophysiology”, Periyasamy-Thandavan et al, American Journal of Physiology - Renal Physiology, 2009”.
Among the numerous components involved in the regulation of autophagy, the Mammalian Target of Rapamycin (mTOR) is now recorgnized as sensor that coordinately regulates the balance between growth and autophagy in response to cellular physiological conditions and environmental stress (93). mTOR is a serine/threonine protein kinase that belongs to the phosphatidylinositol
kinase-related kinase (PIKK) family. The inhibition of mTOR activity, through Akt and MAPK signaling, under nutrient starvation, induces autophagy as well as negative regulation of mTOR, through AMPK and p53 signaling, promotes it (94).
Under physiological conditions, autophagy has a number of other vital roles such as maintenance of the aminoacid pool during starvation, prevention of neurodegeneration, antiaging function, clearance of intracellular microbes and regulation of innate and adaptive immunity (86,95).
In addition to the physiological roles of autophagy, many reports describe its controversial involvement in the genesis and the progression of cancer (96-98). Indeed autophagy acts either as a tumor suppressor, by preventing the accumulation of damaged proteins and organelles, or as a mechanism of cell survival that promote and maintain the growth of established tumors (99).
1.4.1 Autophagy sustains survival of dormant cancer cells
A potential role of autophagy in dormancy was originally evidenced in C.
elegans during a dormancy-like state, where larvae are exposed to hostile
microenvironment. In this model, C. elegans activated autophagy that could promote survival during quiescent states (100).
Since autophagy is activated in response to changes of the microenvironment, it could be interesting to investigate the mechanisms that induce autophagy and allow to the survival and the maintenance of the dormant state in tumor cells. Although the efforts to show through in vitro or in vivo models, the role of autophagy in dormancy and the mechanisms that are activated during this state remain largely discussed. However, studies in models of breast cancer cells suggest that the decreased mitogenic signaling of β1-integrin in dormancy may stimulate autophagy (101). Moreover, it has been shown that dormant cancer cells activate p27 that is involved in cell cycle arrest and directly induces autophagy to facilitate cells survival in response to growth factor withdrawal (102,103).
It would be critical to determine whether autophagy plays a dormant or survival-inducing role, or both, in quiescence tumor cells. If autophagy induces a pro-survival state, then strategies to block it could eradicate dormant cells. In case that
it contributes to both quiescence and survival, then more detailed analysis of these pathways would be required to reveal ways to inhibit only the survival signals without interrupting quiescence (104).
2. AIM OF THE THESIS
The hypoxic tumor microenvironment has been recognized as a cause of malignancy or resistance to various cancer therapies. However, the effect of a chronic exposure of the cells to hypoxia and the following reoxygenation cycles remain elusive. Although most of the tumor cells die in chronic hypoxia, some of them can survive for more than several days in a quiescent state. This dormant state is reversible, with tumor cells recovering the ability to self-renew once closed vessels reopen or new vasculatures reach the hypoxic area. Because dormant tumor cells may be the founders of metastasis, one hypothesis is that these cells share stem cell-like characteristics that may be responsible for their long half-lives.
An understanding of the regulatory machinery of tumor dormancy is essential for identifying early cancer biomarkers and could provide a rationale for the development of novel agents to target dormant tumor cells population. The lack of established in vitro models of tumor dormancy represents the major factor that hampers the understanding of dormant cells response. Indeed, the majority of in
vitro hypoxia studies have been carried out exposing cell lines to acute hypoxia
(3-24 h), whereas only few reports of chronic hypoxia have been published. Therefore, the aim of the thesis is to establish and characterize a new in vitro model of cell dormancy using hypoxia/reoxygenation cycles and culturing the surviving cells in chronic hypoxia condition.
3. MATERIALS AND METHODS
3.1 Cell lines and cells culture
Human breast cancer cell lines MDA-MB-231, MDA-MB-468, T47D, and MCF-7 were purchased from American Type Culture Collection. All the cell lines were cultured in DMEM (LifeTechnologies) supplemented with 10% FBS, 100 UI/mL penicillin, 100 μg/mL streptomycin, and 40 μg/mL gentamycin (Life Technologies) in a 5% CO2 atmosphere at 37°C. Hypoxic culture was achieved by incubating cells with 1% O2 and 5% CO2 in a Multigas Incubator (RUSKINN C300, RUSKINN Technology Ltd) in DMEM without sodium pyruvate and supplemented with 25 mM HEPES, 10% FBS, 100 UI/mL penicillin, 100 μg/mL streptomycin, and 40 μg/mL gentamycin. After some hypoxia/reoxygenation cycles, the surviving cells were cultured under 1%O2 athmosphere for at least 3 months. The hypoxia-resistant MDA-MB-231 cell line was designed as chMDA-MB-231.
3.2 Morphological analyses of dormant cells and tumorspheres
Approximately 6 x 10⁴ MDA-MB-231 and chMDA-MB-231 cells were seeded on a 4-chamber slide, with 13 mm glass bottom (IbidiGmbH). After 24 h, cells were incubated for 5 min with a staining solution made of CellMaskDeep Red
(LifeTechnologies) 1:1000 cell media without serum. Before the acquisition, the
medium was replaced with a special medium without phenol red (DMEM/F12 NoPhenolRED, LifeTechnologies) to avoid any interference with the fluorescence signal.
The tumospheres deriving from 60 wells of a coated 96 well-plate were gently collected by a p1000 tip with a cut extremity and seeded on a 4-chamber slide. After 24 h, cells were incubated for 60 min with a staining solution made of CellMaskDeep Red 1:1000 (LifeTechnologies) and Hoescht 1:1000
(LifeTechnologies) in DMEM/F12NoPhenolRED. Cell images were captured
Microsystem) at 63x magnification and processed using Adobe Photoshop and
ImageJsoftwares (Rasband, W.S., ImageJ, http://rsb.info.nih.gov/ij/, 1997–2008).
3.3 Cells viability
The viability of MDA-MB-231 and chMDA-MB-231 cells were evaluated with a 0.1% Trypan Blue exclusion test using a Countess Automated Cell Counter
(LifeTechnologies).
3.4 Immunophenotype
Cells were harvested, washed in phosphate buffer saline (PBS) and stained with anti-human CD326/ESA-FITC, CD24-FITC (MiltenyiBiotec), CD44-PE (BD
Pharmingen). After incubation at room temperature for 15 min, cells were washed
in PBS, acquired on aFACScan cytometer (Becton Dickinson) and analyzed by FlowJo9.3.3 software (Tree Star). Data were expressed as the difference of Median Fluorescence Intensity (MFI) between stained and unstained cells.
3.5 Cell cycle
Cells were incubated with 10 mM Vybrant DyeCycle orange stain
(LifeTechnologies) for 15 min and with 1 mM Sytox Blue dead Cell stain (LifeTechnologies) for additionally 15 min to exclude dead cells from cytometric
analysis.
3.6 Cell proliferation
Cells were labeled with the amine-reactive dye 5,6-carboxyfluor-escein diacetate, succinimidyl ester (CFSE), as described previously (105).This dye is incorporated into cells and divided equally into daughter cells during proliferation. Thus, cells proliferation can be determined by measuring the MFI by flow cytometry on a FACS scan flow cytometer. Briefly, they were resuspended at a final concentration of 107cells/mL in PBS-5% FBS and incubated with 5 mM CFSE for 5 min at room temperature. The reaction was stopped by washing twice with PBS-5% FBS. Cells were replated at 106 cells/mL in complete medium in normoxic andhypoxic conditions. An aliquot of cells was harvested every 24 h for 3 days,
added with TO-PRO-3 (LifeTechnologies) and subjected to flow cytometry analysis.
3.7 Measurement of glucose, pyruvate, and lactate concentration
After 3–5 days of culture under normoxic or hypoxic conditions, the medium of MDA-MB-231 and chMDA-MB-231 cells were harvested and cells were counted. The concentration of glucose and lactate in the media was measured by using the glucose assay kit (CaymanChemical) and the lactate assay kit (Megazyme
International), respectively, according to the manufacturer’s instructions. To
measure the amount of pyruvate produced, 5–50 L of medium were added to 370 mM Tris–HCl pH 8, containing 350 mM NADH and 3 mg of LDH (Sigma), to a final volume of 300 L. The total change of the absorbance at 340 nm was measured and using the molar extinction coefficient of NADH at 340 nm (6,220 M/cm), the moles of NADH oxidized, that are equal to the moles of pyruvate produced, were calculated.
3.8 Glutathione content quantification
The intracellular GSH concentration was measured by endpoint spectrophotometric titration on a Jasco V/550 spectrophotometer (JASCO) using the 5,50-dithiobis(2-nitrobenzoic acid) (DTNB, Ellman’sreagent) (106). Briefly, MDA-MB-231 and chMDA-MB-231 cells were lysed by freezing and thawing in 100 mM sodium phosphate buffer, pH 7.5, containing 5 mM EDTA, (KPE buffer), and after centrifugation at 16,000 rpm for 10 min, total protein concentration was determined by Bradford reagent (Pierce) using bovine serum albumin as standard (107). The supernatants were deproteinized with 5% trichloroacetic acid. For [GSH] measurement, acidified clear supernatants were neutralized and buffered at pH 7.4 with 200 mM K2HPO4, pH 7.5. The reaction was then started by the addition of 60 mM DTNB and the increase inabsorbance at 412 nm was measured until no variation in absorbance was evident. The amount of total GSH was determined by comparison with GSH standard curve.
3.9 Detection of intracellular reactive oxygen species (ROS)
a) CM-H2DCFDA staining: MDA-MB-231 and chMDA-MB-231 cells were resuspended in HBSS (LifeTechnologies) at 3x10⁵ cells/mL and loaded with 2.5 μM of the cell-permeant probe 5-(and-6)-chloromethyl-2'7'- dichlorodihydrofluorescein diacetate acetyl ester (CM-H2DCFDA; Molecular Probes) for 1 h at 37°C, as previously described (108). ROS generation was
evaluated in flow cytometry (Becton Dickinson) by measuring the green fluorescence signal (Fl-1) of CM-H2DCFDA that occurs after removal of the acetate groups by intracellular esterases and oxidation by free radicals. Data were analyzed by FlowJo 9.3.3 software.
b) Mitosox staining: Approximately 6 x 10⁴ MDA-MB-231 and chMDA-MB-231 cells were seeded on a 4-chamber μslide, with 13 mm glass bottom (Ibidi GmbH). After 24 h, cells were incubated for 30 min with a staining solution made of Mitosox 1:1000 (LifeTechnologies), Mitotracker greenFM 1:5000 (LifeTechnologies) and Hoescht 1:1000 (LifeTechnologies) in medium without FBS. Before the acquisition, the medium was replaced with a medium without phenol red (DMEM/F12 NoPhenolRED, LifeTechnologies) to avoid any interference with the fluorescence signal. Cell images were captured using a confocal laser-scanning fluorescence microscope Leica SP5 at 63× magnification and processed using Adobe Photoshop and ImageJ softwares (Rasband, W.S.,
ImageJ, http://rsb.info.nih.gov/ij/, 1997–2008).
3.10 Western Blot
Cells were homogenized at 4°C in 20 mM HEPES, pH 7.4, containing 420 mM NaCl, 1 mM EDTA, 1 mM EGTA, 1% Nonidet-P40 (NP-40), 20% glycerol, protease cocktail inhibitors (GE Healthcare, Amersham) and phosphatase cocktail inhibitors. Protein concentration was measured by Bradford reagent using bovine serum albumin as standard (107). Protein extracts (50 μg/lane) were resolved by SDS PAGE electrophoresis and transferred to PVDF membrane (Immobilon P,
Millipore). Immunoblotting assays were carried out by standard procedures using
LC3, p(Thr180/182)-p38, p38, p(Ser)-AKT, AKT and anti-P70S6 kinase antibodies (Cell Signaling Technology), anti-STAT1, anti-STAT3,
anti-p53, anti-p(Thr202/Tyr-204)-ERK and anti-ERK antibodies (Santa Cruz Biotechnology), anti-HIF1α antibody (BD bioscience) anti-actin antibody (Millipore), anti-HIF2α antibody (Novus Biologicals). After washing, membranes were developed using anti-rabbit or anti-mouse IgG peroxidase-conjugated antibodies (Cell Signaling Technology) and chemiluminescent detection system
(Immun-Star™ WesternC™ Kit, Bio-Rad). Blotted proteins were detected and
quantified using the ChemiDoc XRS Imaging System (Bio-Rad).
3.11 Real time PCR
Cellular RNA was extracted by PureLink Total RNA kit (AmbionTM) according to the manufacturer's instructions. Total RNA was quantified at 260/280 nm, and the integrity of the samples was checked by 1% agarose gel electrophoresis. Aliquots corresponding to 1µg of total RNA were reverse transcribed by using the SuperScript Vilo cDNA synthesis kit (InvitrogenTM) following the manufacturer's protocol. Aliquots of the cDNAs (corresponding to 50 ng of the original RNA) were subjected to real-time PCR with the QuantiTect SYBR Green PCR Kit
(Qiagen,) following the manufacturer's instructions. Bioinformatically validated
primer sets for real-time PCRs were purchased by Qiagen (QuantiTect Primer Assays: Hs_RRN18S_1_SG for 18S, Hs_PGK_1_SG for PGK, Hs_SLC2A1_1_SG for GLUT1 and Hs_GADPH_2_SG for GAPDH). 18S rRNA was used as the housekeeping gene for sample normalization and was amplified in separate tubes within the same run. The PCR was performed with an initial pre-incubation step for 15 min at 95°C, followed by 45 cycles of 94°C for 15 s, annealing at 55°C for 30 s, and extension at 72°C for 30 s. The specificity of the amplified products was monitored performing melting curves at the end of each amplification reaction. All amplicons generated a single peak, thus reflecting the specificity of the primers. Real-time PCR was performed using the Rotor-Gene 6000 (Corbett Cambridgeshire, UK) and data analysis was conducted using the Rotor-Gene Software. Data were normalized to 18S and sample expression levels are shown as percentages of the internal control gene. Experiments were repeated at least three times.
3.12 Detection of autophagic markers
a) Acridine orange staining. Approximately 6 x 10⁴ MDA-MB-231 and chMDA-MB-231 cells were seeded on a 4-chamber µslide, with 13 mm glass bottom (ibidi
GmbH, Germany). After 24 h cells were rinsed in phosphate buffer saline (PBS)
and stained with acridine orange (AO) (1:1500 in PBS). Cell images were captured immediately by using a confocal laser-scanning fluorescence microscope Leica SP5 (Leica Microsystem) at 63× magnification and processed using Adobe Photoshop and ImageJ softwares (Rasband, W.S., ImageJ, http://rsb.info.nih.gov/ij/, 1997–2008).
b) Monodansylcadaverine staining and autophagosome formation assay. MDA-MB-231 and chMDA-MDA-MB-231 cells were incubated with the fluorescent probe monodansylcadaverine (MDC, Sigma) a selective marker for acidic vesicular organelles, such as autophagic vacuoles. Briefly, cells were seeded in 96-well plates (3 × 10⁴ cells/well) and after 24 h were incubated in culture medium containing 50 μM MDC at 37 °C for 15 min. Cells were then washed with Hanks buffer (20 mM HEPES pH 7.2, 10 mM glucose, 118 mM NaCl, 4.6 mM KCl, and 1 mM CaCl2) and fluorescence was measured using a multimode plate reader (Ex340nm and Em535nm) (GENios Pro, Tecan). The values were normalized for cell proliferation by Crystal Violet assay.
c) LC3-II. The presence of lipidated LC3-II isoform was analysed by Western Blot as described above using mouse anti-LC3I/II antibody that detects endogenous levels of LC3B isoforms I and II.
3.13 Statistical analysis
Data reported are the means ± S.D. of a least three independent experiment. Statistical analysis were performed by one-way analysis of variance (ANOVA) with Bonferroni test. P value ≤ 0.05 was indicated as a statistically significant.
4. RESULTS
4.1 Survival of the cells under chronic hypoxia
In order to establish a new in vitro model of breast cancer dormancy, we cultured four human breast cancer cell lines in 1% O2 atmosphere: MB-231, MDA-MB-468, T47D and MCF-7. The cells were exposed to hypoxia for 1-7 days and then the surviving cells were reoxygenated for 1-3 weeks depending on the rescue of the cells and their proliferation rate. In our hands, only MDA-MB-231 cells were able to recover their proliferation rate and grow until the confluence. Then, MDA-MB-231 cells were exposed to repetitive cycles of hypoxia/reoxygenation. We set up the hypoxia/reoxygenation conditions regarding the number of cycles and exposure time.
The optimized procedure included exposure of MDA-MB-231 cells up to 7 days to hypoxia and reoxygenation of the surviving cells for 7-10 days depending on their viability. After reoxygenation and growing, we exposed the cell line again to a second round of hypoxia, and found an increase in viability. After three rounds of hypoxia and oxygenation, the cells, designed as chronic hypoxia resistant MDA-MB-231 (chMDA-MB-231), were able to stably grow in 1% O2 hypoxia even if with a decreased proliferation rate. ChMDA-MB-231 cells were cultured under hypoxia for at least 3 months.
Cells cycle analysis revealed that the new established hypoxia-resistant chMDA-MB-231 cells were accumulated in G0/G1 phase and the percent in G2/M phase was drastically reduced (Figure 9A).
Analysis of CFSE dilution showed a lesser decrease of fluorescence corresponding to higher concentration of the probe in chMDA-MB-231 after 24, 48, and 72 h of culture under hypoxia respect to MDA-MB-231 in normoxia conditions. These data indicate that chMDA-MB-231 cells have a lower proliferation rate than the parental ones (Figure 9B).
The arrest in G0/G1 phase and the low proliferation rate were reversible. Indeed, once replaced into fresh medium and re-oxygenized the cells, designed as reverted chronic hypoxia resistant MDA-MB-231 (RchMDA-MB-231), showed a recovery of the proliferation rate in 2 weeks (Figure 9).