The Immune-Modulator Pidotimod
Affects the Metabolic Profile
of Exhaled Breath Condensate
in Bronchiectatic Patients: A
Metabolomics Pilot Study
Maria D’Amato 1†, Debora Paris 2†, Antonio Molino 1†, Paola Cuomo 2†, Andrea Fulgione 3, Nunzia Sorrentino 1, Letizia Palomba 4, Mauro Maniscalco 5*‡ and Andrea Motta 2*‡
1 Division of Pneumology, Department of Respiratory Diseases, University of Naples Federico II, AORN dei Colli-Monaldi
Hospital, Naples, Italy, 2 Institute of Biomolecular Chemistry, National Research Council, Pozzuoli, Italy, 3 Department of
Agriculture, University of Naples Federico II, Portici, Italy, 4 Department of Biomolecular Sciences, University of Urbino Carlo
Bo, Urbino, Italy, 5 Pulmonary Rehabilitation Unit, ICS Maugeri SPA, IRCCS, Telese Terme, Italy
Introduction: Pidotimod, a synthetic dipeptide molecule with biological and immunological
activities, is used to reduce the number of exacerbations or pneumonitis in patients with inflammatory diseases.
In the present study, we investigated whether Pidotimod modifies the metabolomic pathways measured in the exhaled breath condensate (EBC) of non-cystic fibrosis bronchiectatic patients (NCFB).
Materials and Methods: We analyzed 40 adult patients affected by NCFB. They were
randomly selected to receive Pidotimod 800 mg b/d for 21 consecutive days (3 weeks) per month for 6 months (20 patients, V1 group) or no drug (20 patients, V0 group), with a
1:1 criterion and then followed as outpatients.
Results: EBC samples were collected from all patients at baseline and after 6 months.
They were investigated by combined nuclear magnetic resonance (NMR) spectroscopy and multivariate statistical analysis to uncover metabolic differences between EBC from NCFB patients before and after therapy with Pidotimod. Pulmonary function test and pulmonary exacerbations were analyzed at baseline and at the end of Pidotimod therapy. The EBC metabolites were all identified, and through statistical evaluation, we were able to discriminate the two samples’ classes, with acetate, acetoin, lactate, and citrate as statistically significant discriminatory metabolites. The model vas validated by using a blind set of 20 NCFB samples, not included in the primary analysis.
No differences were observed in PFT after 6 months. At the end of the study, there was a significant decrease of exacerbation rate in V1 group as compared with V0 group, with a
substantial reduction of the number of mild or severe exacerbations (p < 0.001).
Discussion: Pidotimod modifies the respiratory metabolic phenotype (‘‘metabotype’’) of
NCFB patients and reduces the number of exacerbations.
Keywords: biomarkers, bronchiectasis, disability, exhaled, metabolomics, NMR, outcome, rehabilitation
Edited by:
Ildiko Horvath, National Koranyi Institute of TB and Pulmonology, Hungary
Reviewed by:
Nadia Mores, Catholic University of the Sacred Heart, Italy Zsofia Lazar, Semmelweis University, Hungary *Correspondence: Mauro Maniscalco [email protected] Andrea Motta [email protected]
†These authors have contributed
equally to this work
‡These authors share senior
authorship
Specialty section:
This article was submitted to Respiratory Pharmacology, a section of the journal Frontiers in Pharmacology
Received: 10 April 2019 Accepted: 30 August 2019 Published: 03 October 2019 Citation:
D’Amato M, Paris D, Molino A, Cuomo P, Fulgione A, Sorrentino N, Palomba L, Maniscalco M and Motta A (2019) The Immune-Modulator Pidotimod Affects the Metabolic Profile of Exhaled Breath Condensate in Bronchiectatic Patients: A Metabolomics Pilot Study. Front. Pharmacol. 10:1115. doi: 10.3389/fphar.2019.01115
INTRODUCTION
Bronchiectasis represents one of the most important healthcare problems due to the high mortality rate and the increased incidence worldwide (King et al., 2006). It is a pulmonary chronic inflammatory disease characterized by bronchial dilatation that can develop in response to many etiologies, like acquired conditions (infection, pulmonary fibrosis, recurrent, or chronic aspiration), as well as congenital conditions [cystic fibrosis (CF), primary ciliary dyskinesia (PCD)] (Chalmers et al., 2012), all leading to bronchus anomalies. Bronchiectasis is associated with chronic cough and sputum production, and, as a chronic lung disorder, it brings about poor quality of life and frequent exacerbations. The economic burden of this disease has been estimated to be similar to chronic obstructive pulmonary disease (COPD). It obviously increases with disease severity, hospitalizations, need for intensive care, and use of inhaled antibiotics (Goeminne et al., 2019). Therefore, there is a continuous search for a pharmacological therapy useful to improve patient conditions and reduce the economic burden (Kocurek and Jagana, 2019).
Pidotimod is a synthetic dipeptide molecule with biological and immunological activities on the adaptive and the innate immune responses, as suggested by in vivo and in vitro studies (Riboldi et al., 2009; Esposito et al., 2015). Pidotimod has been used to reduce exacerbations or pneumonitis in patients with chronic inflammatory disorders (Trabattoni et al., 2017).
In the last few years, metabolomics has become a leading tool in defining disease phenotype because it is able to correlate the metabolic dysregulation with the phenotype. Metabolomics is a useful tool to investigate airway diseases, their treatment, and follow-up as the respiratory tract offers a natural matrix (exhaled breath), which is easily collected as condensate (EBC) (Maniscalco et al., 2018a; Maniscalco et al., 2019). Nuclear magnetic resonance (NMR)–based metabolomics of EBC has progressively gained importance for quantitative determination of the metabolic response to several respiratory disorders (Paris et al., 2018). It unambiguously recognizes markers that separate adults with COPD from healthy subjects (de Laurentiis et al., 2008), unstable CF from stable CF (Montuschi et al., 2012), CF from PCD (Montuschi et al., 2014), and asthma from COPD (Maniscalco et al., 2018b). Furthermore, NMR-based metabolomics was able to demonstrate that the phenotype of obese asthmatic patients is fully different from that of patients independently affected by asthma or obesity (Maniscalco et al., 2017).
In the present study, we investigated the effects of the Pidotimod in non-cystic fibrosis bronchiectasis (NCFB) patients from EBC samples. By using NMR-based metabolomics, we aimed at uncovering the metabolites and related pathways affected by the immunostimulator, which may become useful indications of the immune response.
MATERIALS AND METHODS
Patients
All patients were recruited from the Respiratory Department of the Monaldi Hospital (Naples, Italy). We enrolled 40 adults
with proven and documented diagnosis of idiopathic or post-infectious bronchiectasis with HRCT affecting two or more lobes; history of at least 4 bronchial infections in the previous year characterized by fever and/or cough with increased sputum; stable pulmonary function with an FEV1 ≥ 80% of predicted;
no asthma or COPD, stable drug treatment in the 4 weeks prior to screening; and ability to read and complete questionnaires. A second set (the test group, not considered for the primary analysis) included 20 NCFB patients and was used as a control set to verify blindly the models’ reliability. They were collected under similar clinical and experimental conditions. Pidotimod was taken at a dose of 800 mg b/d for 3 weeks a month for 6 consecutive months. From these patients, EBC was collected before Pidotimod administration and after 6 months from the first administration. The exacerbation was defined as worsening of two of the following signs or symptoms for at least two consecutive days, and requiring antibiotic treatment: dyspnea, wheezing, cough, amount of sputum, and sputum purulence with subsequent antibiotic treatment.
The local Ethical Committee approved the study, and an informed written consent was obtained from patients.
Exhaled Breath Condensate Collection
and Processing
All subjects were asked to refrain from food intake for 8 h before the test and from alcoholic drinks for 18 h before collecting the EBC, which they confirmed before sample collection. EBC was collected in random order and in the same room with a TURBO-DECCS condenser set at −5.0 ± 1.0°C (Medivac, Pilastrello, Parma, Italy, medivac.it). Briefly, all subjects were asked to breathe at tidal volume through the mouthpiece for 15 min while sitting comfortably and wearing a nose clip. They were instructed to seal their mouth around the mouthpiece, which was kept dry by periodically swallowing excess saliva. They were also asked to rinse their mouth thoroughly before and every 5 min during the test. We obtained, on average, 2.0 ± 0.3 ml (mean ± SD) of EBC from each subject. Volatile substances were removed by a gentle nitrogen gas flow for 3 min. EBC samples were immediately sealed in polypropylene tubes and stored first in dry ice and then at −80°C until NMR acquisition (de Laurentiis et al., 2008).
The salivary contamination of the samples was tested by measuring their α-amylase activity. The colorimetric reaction (Infinity Amylase Reagent, Sigma, Milan, Italy) is based on the hydrolysis of starch. The absorption was detected at 540 nm with a spectrophotometer (HP8453E Agilent Technologies Italia S.p.A., Cernusco sul Naviglio, Milan, Italy). The limit of detection was 0.078 U/ml. Saliva contamination was also checked with the 1D NMR spectra, in which contaminated spectra present signals from carbohydrates (which are absent in EBC spectra). Except for one sample from V0 (untreated) class and two samples from
V1 (treated) group, which presented saliva contamination in
both the amylase test and NMR spectra, the remaining samples (19 untreated and 18 treated) were uncontaminated. In fact, the intense saliva signals, originating from carbohydrates and resonating between 3.3 and 5.5 ppm (de Laurentiis et al., 2008),
were absent in the EBC spectra. Therefore, the samples analyzed were 19 untreated control patients, and 18 were Pidotimod-treated. Regarding the external test group used to verify the model, we considered all of the 20 samples as none of them was contaminated by saliva.
The room temperature remained constant (24°C ± 1.0°C) throughout the sampling period. Possible air contaminants in the collecting room were monitored with a dedicated sampling pump for air monitoring (Zambelli EGO PLUS TT; Zambelli, Milan, Italy), working at a flow rate of 8 l/min and tidal volume (500 ml) into the condenser, so as to simulate human breath. The pump was connected to the condenser outlet for 15 minutes, and special filters (3M Particulate Filters P100; 3M Italia, Milan, Italy; tested against particles approximately 0.3 µm in size) for respiratory protection were applied to the one-way valve of the mouthpiece condenser used for the whole set of experiments. NMR spectra of condensed room air from the collecting device were devoid of signals, confirming the absence of air pollutants (data not shown).
To reduce the risk of contamination by inhaling hospital air, subjects were sampled after a 30-minute rest in the greenhouse of the Department of Respiratory Medicine, which was shown to be contaminant free as described above for the collecting room.
NMR Sample Preparation
EBC samples were rapidly defrosted. To provide a field frequency lock, 70 ml of a 2H
2O solution (containing 0.1 mmol/l sodium
TSP as a chemical-shift reference for 1H spectra and sodium
azide, a bacteriostatic agent at 3 mmol/l) was added to 630 ml of EBC, reaching 700 ml of total volume.
NMR Spectroscopy Measurements
All spectra were recorded on a 600-MHz Bruker AVANCE-III Spectrometer (Bruker BioSpin GmbH, Rheinstetten, Germany) equipped with a CryoProbe. 1D 1H-NMR spectra were collected
at 27°C with the excitation sculpting pulse sequence to suppress the water resonance. We used a double-pulsed field gradient echo, with a soft square pulse of 4 ms at the water resonance frequency and gradient pulses of 1 ms each in duration, adding 128 transients of 64k complex points, with an acquisition time of 4 s/transient. Time-domain data were all zero-filled to 128k complex points, and before Fourier transformation, an exponential multiplication of 0.6 Hz was applied.
2D clean TOCSY spectra were recorded by using a standard pulse sequence and incorporating the excitation sculpting sequence for water suppression (Griesinger et al., 1988). In general, 320 equally spaced evolution–time period t1 values
were acquired, averaging 4 transients of 2,048 points. Time-domain data matrices were all zero-filled to 4,096 points in both dimensions, and before Fourier transformation, a Lorentz-to-Gauss window with different parameters was applied for both t1 and t2 dimensions for all the experiments. The spectral
positions of the lines (‘‘resonances’’) in both homonuclear 1D and 2D spectra were referred to the spectral position of the signal originating from 0.10 mmol/l TSP, which was assumed to resonate at a δ value of 0.00 ppm.
For the natural abundance of 2D 1H-13C HSQC spectra, we
used an echo-antiecho phase-sensitive pulse sequence by using adiabatic pulses for decoupling (Kay et al., 1992). Hundred twenty-eight equally spaced evolution–time period t1 values
were acquired, averaging 48 transients of 2,048 points and using GARP4 for decoupling. The final data matrix was zero-filled to 4,096 in both dimensions and apodized before Fourier transformation by a shifted cosine window function in t2 and
in t1. Linear prediction was also applied to extend the data to
twice their length in t1. The spectral positions of the ‘‘resonances’’
were referred to the lactate signal (βCH3), which was assumed to
resonate at 1.33 ppm for 1H and 20.76 ppm for 13C.
Statistical Analysis
Since there are no standardized methods for evaluating the power of the analysis for projection methods such as orthogonal projections to latent structures (OPLS) analysis, we consider our study a pilot study for which no a priori power analysis was possible. Since biomarkers and their concentration changes that could determine class separation were unknown before analysis, we used our results to backward evaluate the power of our analysis.
By varying the parameters 1−α from 95 to 99.9% and 1−β from 80 to 99.9%, and using the accuracy percentages obtained for our validation tests for untreated/treated patients, for a 1−α value of 95% and a 1−β value of 80%, we obtained a number of subjects corresponding to 14 ± 2 for both classes, whereas for a 1−α value of 99.9% and a 1−β value of 99.9%, we obtained a number of 16 ± 2 for untreated/treated patients.
Here, we analyzed 19 untreated and 18 treated patients, corresponding to a number of enrolled subjects that is in line with the backward analysis. Typically, the 1−α value is 95%, and the 1−β value is at least equal to 80%, whereas a value of 99.9% represents an extreme requirement. On the other hand, the permutation and the validation tests done within the OPLS Discriminant Analysis (OPLS-DA) have confirmed the existence and validity of the model and avoided the overfitting problem (see below).
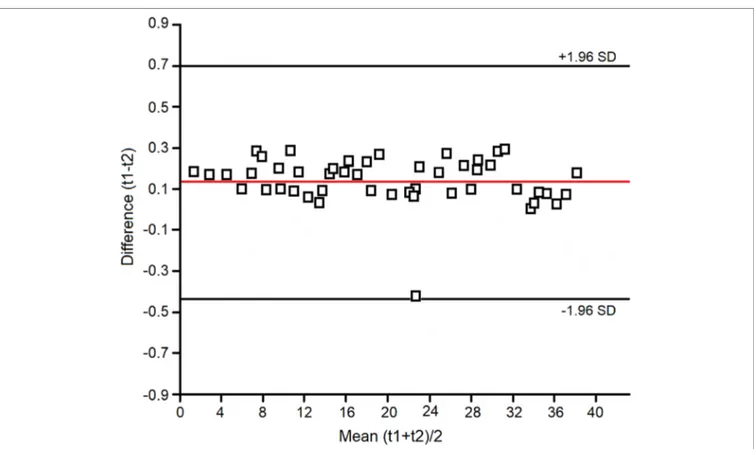
Within-day, between-day, and technical repeatability, and detection limits were assessed as previously reported (Carraro et al., 2007; Montuschi et al., 2012; de Laurentiis et al., 2013). Assessment of within-day repeatability of NMR spectra was according to Bland and Altman, and all spectral lines were considered. Two EBC samples were collected twice within the same day (at times 0 h and 12 h) from four untreated and four treated subjects. Each spectrum was subdivided in six equally corresponding regions, while the region 5.20–4.50 ppm, containing the residual water resonance, was excluded. All regions were integrated and normalized to the total spectrum area. We obtained 6 parameters (the integrated fractional regions) for each spectrum, which for 8 subjects amounted to 48 values. All values except one fell within the 2SD range, indicating a good within-day repeatability (Figure 1).
Between-day repeatability was expressed as ICC of the 4.4–0.4-ppm spectral region. The ICC was 0.99. Technical repeatability was assessed by repeating NMR spectroscopy on four different samples
(two from untreated and two from treated patients) four times consecutively. The ICC for the 4.4–0.4-ppm spectral region was 0.98. The measured detection limit was 0.07 ± 0.02 μM for phenylalanine signals (not shown), the lowest detectable concentration with respect to the internal TSP concentration standard.
We used multivariate analysis to discriminate signals/ metabolites and identify hidden phenomena and trends in ensembles of spectra. Proton NMR spectra were automatically data reduced to 390 integral segments (“buckets”), each of 0.02 ppm, using the AMIX 3.6 software package (Bruker BioSpin GmbH, Rheinstetten, Germany), within the 0.10–8.60-ppm region. The residual water resonance region (5.20–4.50 ppm) was excluded, and each integrated region was normalized to the total spectrum area to avoid possible dilution effects on the signals.
The data format obtained (X matrix) was imported into SIMCA-P +14 package (Umetrics, Umeå, Sweden), and principal components analysis (PCA) and OPLS-DA were performed. PCA is an unsupervised technique that reduces dimensionality without a priori knowledge of sample categories, while OPLS-DA is a supervised technique and requires a priori knowledge of sample categories. Mean-centering was applied as data pre-treatment for PCA, while Pareto scaling was used prior to OPLS-DA. PCA was performed to reduce the dimensionality of the data and to reveal any clustering of the four study groups in an unsupervised manner. Once class homogeneity was assessed for each group, supervised OPLS-DA was applied, where a dummy variable Y matrix was used. Supervised regressions were
conducted comparing two groups at a time in order to generate predictive models. The model quality was evaluated by using the goodness-of-fit parameter (R2) and the goodness-of-prediction
parameter (Q2). We actually tested both OPLS and orthogonal
signal correction (OSC) routines together with the PLS-DA to verify data fitting and possible data over-fitting, which was excluded. The obtained OPLS models turned out to be improved in terms of both predictive and interpretive abilities.
Associated scores plots were used to visualize sample class distribution and highlight putative markers for classification. To check for model overfitting and data regression performance, each OPLS-DA model was validated by an internal iterative 7-round cross-validation, response to permutation test (800 repeats), and analysis of variance testing of cross-validated predictive residuals (CV-ANOVA). Statistical significance for selected metabolites and PFT was determined by parametric (Student’s t) or non-parametric (Wilcoxon) tests for paired data, according to the results of normality test performed to evaluate each distribution (Shapiro–Wilk test). Chi square was used for comparing proportions. For all tests, only p values < 0.05 were considered as statistically significant.
RESULTS
Figure 2 depicts representative NMR profiles (spectra) of EBC samples from a NCFB patient before (B) and after (C)
FIGURE 1 | Bland–Altman plot for the spectral zones considered in the evaluation of within-day repeatability of the NMR measurements (see Materials
Pidotimod treatment. As a comparison, the spectrum of a healthy subject is also reported (A). Spectral lines were assigned to specific metabolites by resorting to 2D correlation experiments (not shown; see Materials and Methods) with the
aid of published chemical-shift data on metabolites, and sample spiking with corresponding standards. A qualitative evaluation of the spectra suggests that the Pidotimod treatment (Figure 2C) simplifies the EBC profile with respect to the untreated
FIGURE 2 | Representative 1H-NMR spectra of EBC samples. (A) Healthy subject (HS); (B) non-cystic fibrosis bronchiectatic (NCFB) patient; (C) NCFB patient treated with Pidotimod. All signals were assigned to single metabolites by resorting to 2D NMR experiments and referring to published data on metabolite chemical shifts. Absorption (related to the intensity) is plotted on the y-axis, and magnetic field strength is plotted on the x-axis. The 8.7−6.5-ppm region has been vertically expanded 32 times. The asterisk in spectrum (C) marks the residual water resonance.
NCFB (the group of the signals between 4.0 and 3.5 ppm, the group around 1.0 ppm as well as the intensity of some sharp singlets in spectrum B), becoming comparable to the healthy subject profile (spectrum 2A). However, some peculiarities are still present. For example, compared with the NCFB profile (2B), the treated NCFB (2C) maintains the citrate and lactate signals at 2.51 and 1.33 ppm, respectively, although reduced in intensity. This would indicate that the Pidotimod treatment affects the NCFB metabolic phenotype (“metabotype”) generating a different metabotype that relates to (but is not the same than) the normal one. That is, Pidotimod administration does not heal from NCFB but improves the pathophysiological status (vide infra).
To obtain relevant biochemical information from NMR data, each spectrum was analyzed trough multivariate statistical analysis, namely, PCA and OPLS-DA.
We first verified the homogeneity of all classes (V0 and V1
patients) and the presence of possible outliers by applying PCA before the application of supervised analysis. Figure 3 reports the PCA scores plots obtained for the EBC samples collected from the NCFB before (3A, green squares) and after (3B, red squares) Pidotimod administration. No discernible patterns were identified, neither subgroups nor outliers, confirming that the classes are homogeneous. Therefore, all of the NMR spectra from the 19 untreated and the 18 treated samples were included in the statistical analysis. The model quality was evaluated by using the
FIGURE 3 | Principal component analysis (PCA) of EBC samples. (A) Scores plot relative to NCFB patients before treatment (green squares); (B) scores plot for the
same patients after Pidotimod treatment (red squares). No satisfactory classification model was obtained, showing (A) R2 = 0.33 and Q2 = 0.16, and (B) R2 = 0.29 and Q2 = 0.21. The labels t[1] and t[2] along the axes represent the scores (the first two partial least squares components) of the model.
goodness-of-fit parameter (R2) and the goodness-of-prediction
parameter (Q2). For them, acceptable values must be ≥0.5, with
|R2−Q2| < 0.2–0.3. For the depicted models, we obtained two
principal components with R2 = 0.33 and Q2 = 0.16, and R2 =
0.29 and Q2 = 0.21 for plots 3A and 3B, respectively, which is an
indication of the absence of subgroups. The existence of probable outliers was also verified in the external test set of 20 NCFB patients. PCA analysis detected neither subgroups nor outliers, with quality parameters R2 = 0.24 and Q2 = 0.19, confirming class
homogeneity (not shown).
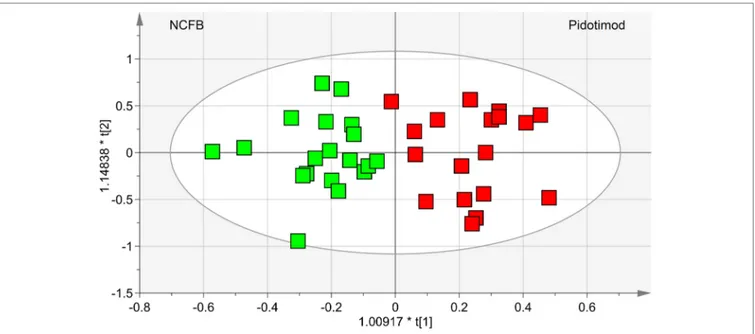
OPLS-DA was next performed, obtaining a strong regression model (97%, p < 0.0001; Figure 4) between NCFB patients before (green squares) and after (red squares) Pidotimod administration. The resulting supervised model was tested by iteratively predicting the class membership of every sample, and the results were used to evaluate R2 and Q2. For this model,
we recorded R2 = 0.86 and Q2 = 0.79. From the associated
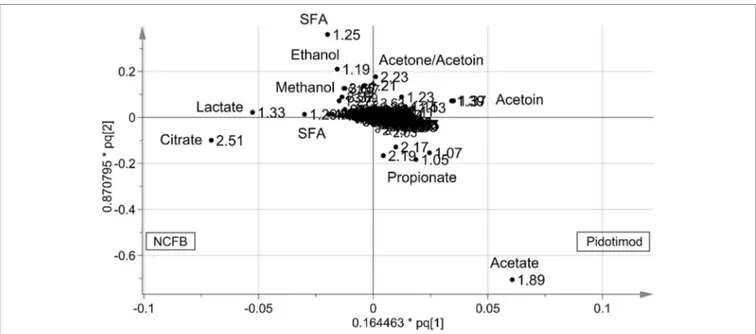
loadings plot (Figure 5), we identified the NMR signals (i.e., the metabolites) responsible for the class separation. Namely, 3.37 ppm (methanol), 2.51 ppm (citrate), 2.23 ppm (acetone/acetoin), 2.19 and 1.07 ppm (propionate), 1.89 ppm (acetate), 1.37 ppm (acetoin), 1.33 ppm (lactate), 1.29 and 1.25 ppm (saturated fatty acids, SFA), and 1.19 ppm (ethanol). The signals on the left side (like 2.51 and 1.33 ppm) were more expressed in the NCFB V0
class, while those on the right side (like 1.89 and 1.37 ppm) were increased in the Pidotimod V1 class. In addition, the signals
at 1.89, 1.25, and 1.19 ppm were more responsible for intra-class differences than for inter-intra-class differences, because their contribution is larger along the orthogonal component than the parallel or predictive component.
The statistically significant metabolites are depicted in the Variable Importance in the Projection (VIP) plot (Figure 6A)
and in the corresponding S plot (Figure 6B). It is important to notice that when more than one chemical group belonging to the same metabolite is observed in the NMR spectrum, the corresponding buckets are all reported in the VIP plot. For example, the two vertical bars (“buckets”) in the VIP at 1.33 and 4.11 ppm both originate from lactate, being the signals of the methyl and methine protons, respectively. Considering VIP > 1 and pcorr > 0.5, we identified four statistically significant variables/
metabolites: 2.51 ppm (citrate), 1.89 ppm (acetate), 1.37 ppm (acetoin), and 1.33 ppm (lactate), whose variations are reported in Figure 7. The four statistically relevant metabolites were then used for between-group classification. We confirmed the above model obtaining only a 4% reduction of the quality parameters (95%; R2 = 0.81; Q2 = 0.72; p < 0.0008). In particular, acetate and
acetoin concentration increased in V1 class (after Pidotimod
administration), while citrate and lactate decreased. Therefore, these metabolites are relevant biomarkers with an important role in the physiological answer to Pidotimod treatment.
The performance of the OPLS-DA model was also evaluated using a sample set not included in the model calculation. Specifically, we tested an external data set of EBC samples obtained from 20 NCFB patients not included in the primary analysis and collected under similar experimental conditions. They were projected onto the corresponding statistical model, and the results are displayed in Figure 8. We obtained high-quality parameters (R2 = 0.87 and Q2 = 0.85) as all samples
(blue-dotted green squares) are correctly located in the predicted NCFB area. The discriminating metabolites characterizing the NCFB-Pidotimod coincide with those found for the above calculated model.
To interpret the biological relevance of the data, using the MetaboAnalyst 4.0 platform (Chong et al., 2018), we examined
FIGURE 4 | OPLS-DA of EBC samples. Scores plot (97%, p < 0.0001) showing the degree of separation of the model between NCFB patients before (green
squares) and after Pidotimod treatment (red squares). For this model, we recorded R2 = 0.86 and Q2 = 0.79. The labels t[1] and t[2] along the axes represent the scores (the first two partial least-squares components) of the model, which are sufficient to build a satisfactory classification model.
the metabolic pathways in which the differently regulated metabolites are involved. The found pathways are depicted in Figure 9, which reports the impact of each pathway versus p values. Using the discriminating metabolites, we uncovered 12 metabolic pathways that appear to be significantly dysregulated upon treatment. From them, we extrapolated pyruvate (p = 1.00×10⁻⁶; impact, 0.24), citrate (p = 9.77×10⁻⁵; impact, 0.08),
sulfur (p = 7.94×10⁻⁵; impact, 0.065), and methane (p =
6.31×10⁻⁴; impact, 0.06) metabolisms as the most probable.
They might contain molecular species potentially relevant as biomarkers for specific pathophysiologic processes within the respiratory metabolome.
No difference was observed in FVC, and FEV1 in patients
who had taken Pidotimod (FEV1 from 2.4 ± 0.9 to 2.8 ± 0.6 l
and FVC from 2.9 ± 1.1 to 3.2 ± 1.1 l) as compared to controls (FEV1 2.6 ± 0.9 to 2.5 ± 0.9 l and FVC 2.8 ± 0.9 to 3.1 ± 0.9 l),
p always > 0.05, although the number of exacerbations was significantly lower (7 in treated group vs. 20 in untreated group, p < 0.001).
The untreated samples were also examined after 6 months (V1). The comparison of the NMR spectra and the (unsupervised)
PCA and (supervised) OPLS-DA analyses did not show relevant changes. In particular, we verified the homogeneity of samples and the presence of possible outliers by applying PCA. The PCA scores plot achieved for the class including the control samples. In particular, at the 19 samples collected at V0, we added 20 samples
obtained after 6 months. Since none of the 20 selected NCFB patients presented saliva contamination, they were all included in the analysis and amounted to 39 samples. No discernible patterns, neither subgroups nor outliers were identified (Figure 10), confirming that they formed a homogeneous class, without notable differences in the metabolic profiles after 6 months. The
goodness-of-fit parameter (R2) and the goodness-of-prediction
parameter (Q2). The quality parameters we obtained were R2 = 0.27
and Q2 = 0.21, which are an indication of the absence of subgroups.
We next applied OPLS-DA obtaining no regression model (32%, p < 0.19) between NCFB controls at 0 time and after 6 months. For this model, we recorded R2 = 0.36 and Q2 = 0.29,
confirming that no relevant metabolic differences were observed after 6 months in the controls.
We found no correlation between metabolomic data and spirometric results in the study group. Identically, no correlations were observed between metabolites and any of the anthropometric parameters (listed in Table 1).
DISCUSSION
In our study, NMR-based metabolomics of EBC has shown that the immunomodulatory Pidotimod affects the respiratory metabolic phenotype (‘‘metabotype’’) of NCFB patients. Pidotimod was administered according to clinical practice, at a dose of 800 mg b/d for 3 weeks (21 days). At such dose, Pidotimod induces dendritic cells (DCs) maturation, up-regulates the expression of HLA-DR and of co-stimulatory molecules, stimulates DCs to release pro-inflammatory molecules driving T-cell proliferation and differentiation toward a Th1 phenotype, enhances natural killer (NK) cells functions, and promotes phagocytosis (Esposito et al., 2015), resulting in a significant upregulation of both innate and, possibly, adaptive immune responses (Trabattoni et al., 2017).
In our respiratory metabolic phenotype, the treatment altered the levels of methanol, citrate, acetone/acetoin, propionate, acetate, lactate, saturated fatty acids and ethanol, with citrate,
FIGURE 5 | Loadings plot associated with the OPLS-DA analysis reported in Figure 4. Metabolites responsible for between-class differences are labeled. Numbers
refer to buckets’ chemical shifts (spectral positions), and the discriminating metabolites are explicitly labeled. The pq[1] and pq[2] values refer to the weight that combines the X and Y loadings (p and q).
acetate, acetoin, and lactate being statistically significant. In particular, after treatment, acetate and acetoin increased while citrate and lactate decreased. Pathway topology analysis indicated (in order of impact percentage) pyruvate, citrate, sulfur, and methane metabolisms as the most probable pathways affected by Pidotimod.
Pyruvate is the end product of glycolysis, which finally enters the mitochondria where it sustains the citric acid cycle. Disorder in pyruvate metabolism is involved in several diseases, including COPD (Gray et al., 2014), in which removal of pyruvate dysmetabolism improved physical performance, which is an important therapeutic goal in COPD (Calvert et al., 2008). Under
aerobic conditions, pyruvate enters the tricarboxylic acid (TCA) cycle to produce also citrate. Consumption of exogenous citrate blocked growth and increased apoptosis in a mesothelioma cell line highly resistant to cisplatin (Zhang et al., 2009) and inhibited proliferation of A549 lung cancer cells in vitro and in vivo (Hanai et al., 2012). Such a potential antitumor function for citrate is attributed to an effect on immune response and signal transduction pathways (Ren et al., 2017). We found that, upon Pidotimod treatment, the level of citrate decreased together with lactate. Therefore, it is conceivable that the immunomodulator activates citrate consumption in bronchiectatic patients, as a part of the general immune response. It is suggested that citrate could
FIGURE 6 | Variables of importance plot (VIP) and S-plot associated with the OPLS-DA analysis reported in Figure 4. (A) VIP reporting on the x-axis the buckets
[identified with chemical shift, in ppm, and labeled “NMR variables” (variable identity)], while on the y-axis, labeled “VIPpred,” the strength of the labeled metabolites in the classification between patient classes is reported. Error bars represent 95% CIs. (B) S-plot reporting p(corr) against the predictive loading vector p of the model.
become a biomarker to monitor the response to the Pidotimod therapy via NMR-based metabolomics of EBC.
The lactate decrease in treated NCFB patients could have a direct link with reduced citrate level. In red blood cells
incubated with deuterated citrate, ca. one-third of the lactate that could not be explained by glucose oxidation and 2,3‐ diphosphoglycerate consumption alone originates from citrate uptake and metabolism (D’Alessandro et al., 2017). Recent
FIGURE 7 | Plots of the NMR variables values for the four statistically significant metabolites contributing to the separation of NCFB groups. Selected bucket
variations are scaled to the total spectral area and correspond to acetate (1.89 ppm, panel A), citrate (2.51 ppm, panel B), acetoin (1.37 ppm, panel C), and lactate
(1.33 ppm, panel D). Patients before Pidotimod treatment are identified by green squares, while red squares identify patients after administration. Numbers on the
x-axis refer to EBC samples used for the analysis; the y-axis reports the bucket variation. Pidotimod increases the levels of acetate and acetoin (A and C panels)
and reduces the levels of citrate and lactate (B and D panels).
FIGURE 8 | Predictive scores plot of the validation untreated NCFB set of samples. Untreated NCFB samples and Pidotimod-treated samples of the training set are
indicated by green squares and red squares, respectively, while the predicted set of 20 new untreated NCFB samples is represented as green squares with a central blue dot. The position of each sample is identified by the associated predictive coordinates (tPS).
FIGURE 9 | MetaboAnalyst 4.0 pathway impact based on metabolites responsible for the class separation (see Materials and Methods section). Circles represent
all metabolic pathways potentially involved in class separation. Numbers identify the metabolisms showing the highest impact: 1, pyruvate; 2, citrate; 3, sulfur; 4, methane. They present different p values and impact parameters (see Results section).
FIGURE 10 | Principal component analysis (PCA) of EBC samples of the controls at V0 and V1 times. The scores plot included 39 samples, 19 at V0 (green squares), and 20 collected after 6 months (green squares with a central blue dot). None of the latter presented saliva contamination, and therefore, all of the initial 20 NCFB patients were included in the analysis. The quality parameters were R2 = 0.27 and Q2 = 0.21, which are an indication of the absence of subgroups.
studies suggest that lactate can be a source of carbon for the citric acid cycle (Hui et al., 2017). As such, the parallel reduction of citrate and lactate in treated NCFB patients could be part of the immune activation brought about by Pidotimod, in which citrate and lactate are both involved via the citric acid cycle.
Sulfur-containing metabolites play an important role in maintaining and supporting immune functions by modulating the actions of oxidant stress in transcription factor activation (Grimble, 2006). For example, in animals under protein-deficient diet and showing inflammation after endotoxin injection, addition of methionine to the diet normalized tissue glutathione (GSH) content and upregulated lung neutrophils (Hunter and Grimble, 1994). Therefore, activation of the sulfur metabolism is part of the defense mechanism, which should favor a reduction of lung inflammation.
Methane metabolism is involved in the global carbon cycle, and, among the three types of known methanogenic pathways, the one converting acetate to methane [KEGG module M00357, www.genome.jp/kegg/ relates to the increased acetate found in treated NCFB patients. Methane metabolism is tightly connected with several metabolic cycles, including sulfur and pyruvate [KEGG map 00680, www.genome.jp/kegg]. It is also involved in the production of cellular energy, which suggests, together with the upregulation of the citric acid cycle, that the energy requirement is increased after treatment, recalling the improved exercise tolerance observed in COPD upon the upregulation of pyruvate metabolism (Calvert et al., 2008).
Acetate and acetoin increased after Pidotimod treatment. Acetate, a short-chain fatty acid, controls some proinflammatory mediators (Arpaia, 2014; Ishiguro et al., 2014) and drives leukocyte migration to inflammatory sites (Vinolo et al., 2011). Therefore, increased levels of acetate after Pidotimod administration responded to the drug immunomodulator activity.
Acetoin (3-hydroxy-2-butanone), which is detected in the breath of patients with cystic fibrosis, causes direct structural damage and likely interacts with the host immune system (Whiteson et al., 2014). It is the product of the detoxication process of acetaldehyde (Otsuka et al., 1996) but may also be a bacterial fermentation product produced by both pathogenic and non-pathogenic bacteria (Filipiak et al., 2012). The relative contribution of lung microbiome to the production of the
acetoin found in the EBC samples is still unknown. In addition, reactive carbonyls such as diacetyl (2,3-butanedione) are contained in tobacco and many food (including butter), and consumer products are detoxified by carbonyl reductases in the lung, in particular, dicarbonyl/l-xylulose reductase (DCXR), a multifunctional lysosomal enzyme expressed in the airway epithelium. The reactive α-dicarbonyl group in diacetyl causes protein damage in vitro. DCXR metabolizes diacetyl to acetoin, its reduced product that lacks this α-dicarbonyl group (Ebert et al., 2015). Therefore, acetoin increases linked to Pidotimod treatment might be explained by the requirement of limiting pulmonary inflammation by activating the detoxification process of diacetyl groups stimulated by Pidotimod.
We are aware that the present study has some limitations. First, it is a non-controlled study and relies on a restricted number of subjects; therefore, our data are preliminary, and this should be considered a pilot study. Further studies on the effectiveness of Pidotimod in the treatment of NCFB patients are needed to determine prospectively the relevance of the perturbed metabolic pathways. However, we confirmed that NMR-based metabolomics is a noninvasive approach for the evaluation of therapy in respiratory diseases, with important implications for follow-ups and personalized treatments.
The metabolic changes are not immediately visible in systemic variations, and therefore, a direct link between clinics and metabolomics may not be manifested. Lack of correlation of metabolic data with clinical parameters could be related to the use of a single biomatrix (EBC) in the understanding of a complex system, which is globally represented by the clinical parameters (Maniscalco and Motta, 2017). The fact that the clinical indications do not always refer to molecules with a MW <2,000 Da may also support the absence of correlation. We are presently applying NMR-based pharmacometabolomics to multiple biofluids (serum, urine, EBC, and saliva) to obtain possible global parameters that could be compared with clinical parameters. By integrating the metabolomics profiles of different biofluids, we aim at better defining the pathways affected by immunomodulators.
Finally, the response to Pidotimod should have been better monitored by clinical parameters—for example, following the decrease of the pulmonary exacerbation occurrence. However,
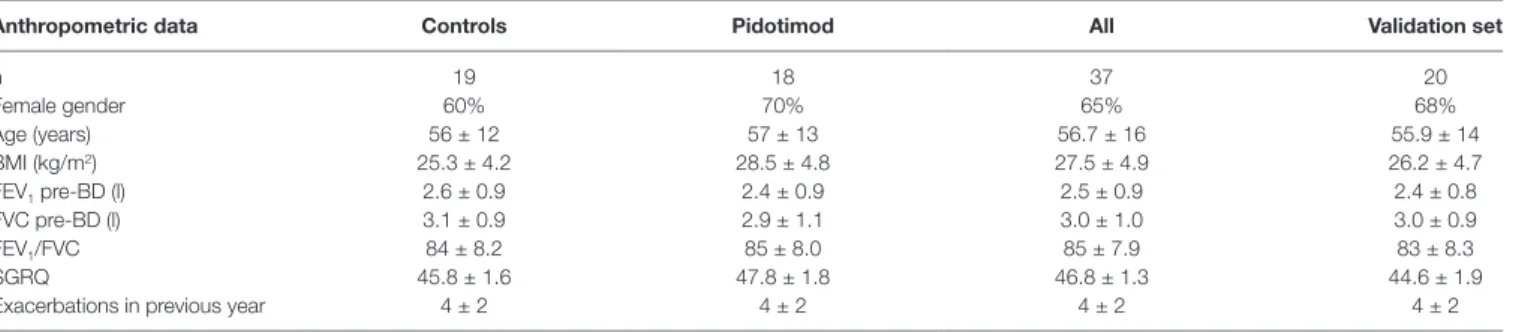
TABLE 1 | Patient characteristicsa.
Anthropometric data Controls Pidotimod All Validation set
n 19 18 37 20 Female gender 60% 70% 65% 68% Age (years) 56 ± 12 57 ± 13 56.7 ± 16 55.9 ± 14 BMI (kg/m2) 25.3 ± 4.2 28.5 ± 4.8 27.5 ± 4.9 26.2 ± 4.7 FEV1 pre-BD (l) 2.6 ± 0.9 2.4 ± 0.9 2.5 ± 0.9 2.4 ± 0.8 FVC pre-BD (l) 3.1 ± 0.9 2.9 ± 1.1 3.0 ± 1.0 3.0 ± 0.9 FEV1/FVC 84 ± 8.2 85 ± 8.0 85 ± 7.9 83 ± 8.3 SGRQ 45.8 ± 1.6 47.8 ± 1.8 46.8 ± 1.3 44.6 ± 1.9 Exacerbations in previous year 4 ± 2 4 ± 2 4 ± 2 4 ± 2
aData are expressed as numbers or means ± SDs. One-way ANOVA and unpaired t tests were used for comparing groups. Significance was defined as a p ≤0.05. Mean ± standard
deviation or percentage.
although the clinical parameters are central, we believe that our analysis may be complementary in the assessment of the Pidotimod effects, and that the evolution of pulmonary exacerbations can be efficaciously monitored via molecular determinants and altered pathways.
Considering these limitations, our findings, obtained by using an unbiased methodology, unequivocally indicate that NCFB patients when treated with Pidotimod present specific metabolic alteration that might be useful to follow the treatment. This possibility adds strong relevance to the use of EBC- and NMR-based metabolomics to the clinics of respiratory pathologies. The described statistical model defines the change in “metabotype” obtained after Pidotimod treatment. This is very important since NMR profiling makes no a priori assumptions about EBC components that may be associated with a particular therapy. Furthermore, it analyzes the sample in a multiparametric way, identifying new and unsuspected links between processes and pathways perturbed in a disease state.
DATA AVAILABILITY STATEMENT
The raw data supporting the conclusions of this manuscript will be made available by the authors, without undue reservation, to any qualified researcher.
ETHICS STATEMENT
Protocol n. 5/18 OSS Maugeri IRCCS, Telese (BN). Committee of the Scientific Institute Pascale, Naples, Italy (23 May 2018).
AUTHOR CONTRIBUTIONS
MD, AMol, MM, and AMot ideated the study, enrolled patients, and discussed the study. DP, PC, AF, NS, and LP acquired the data and followed patients. DP, PC, and AMot performed statistical analysis. MD, AMol, MM, and AMot coordinated and discussed the study.
REFERENCES
Arpaia, N. (2014). Keeping peace with the microbiome: acetate dampens inflammatory cytokine production in intestinal epithelial cells. Immunol. Cell
Biol. 92 (7), 561–562. doi: 10.1038/icb.2014.40
Calvert, L. D., Shelley, R., Singh, S. J., Greenhaff, P. L., Bankart, J., Morgan, M. D., et al. (2008). Dichloroacetate enhances performance and reduces blood lactate during maximal cycle exercise in chronic obstructive pulmonary disease. Am. J.
Respir. Crit. Care Med. 177 (10), 1090–1094. doi: 10.1164/rccm.200707-1032OC
Carraro, S., Rezzi, S., Reniero, F., Heberger, K., Giordano, G., Zanconato, S., et al. (2007). Metabolomics applied to exhaled breath condensate in childhood asthma. Am. J. Respir. Crit. Care Med. 175 (10), 986–990. doi: 10.1164/ rccm.200606-769OC
Chalmers, J. D., Smith, M. P., McHugh, B. J., Doherty, C., Govan, J. R., and Hill, A. T. (2012). Short- and long-term antibiotic treatment reduces airway and systemic inflammation in non-cystic fibrosis bronchiectasis. Am. J. Respir. Crit. Care Med. 186 (7), 657–665. doi: 10.1164/rccm.201203-0487OC
Chong, J., Soufan, O., Li, C., Caraus, I., Li, S., Bourque, G., et al. (2018). MetaboAnalyst 4.0: towards more transparent and integrative metabolomics analysis. Nucleic Acids Res. 46 (W1), W486–W494. doi: 10.1093/nar/gky310 D’Alessandro, A., Nemkov, T., Yoshida, T., Bordbar, A., Palsson, B. O., and
Hansen, K. C. (2017). Citrate metabolism in red blood cells stored in additive solution-3. Transfusion 57 (2), 325–336. doi: 10.1111/trf.13892
de Laurentiis, G., Paris, D., Melck, D., Maniscalco, M., Marsico, S., Corso, G., et al. (2008). Metabonomic analysis of exhaled breath condensate in adults by nuclear magnetic resonance spectroscopy. Eur. Respir. J. 32 (5), 1175–1183. doi: 10.1183/09031936.00072408
de Laurentiis, G., Paris, D., Melck, D., Montuschi, P., Maniscalco, M., Bianco, A., et al. (2013). Separating smoking-related diseases using NMR-based metabolomics of exhaled breath condensate. J. Proteome Res. 12 (3), 1502– 1511. doi: 10.1021/pr301171p
Ebert, B., Kisiela, M., and Maser, E. (2015). Human DCXR—another ‘moonlighting protein’ involved in sugar metabolism, carbonyl detoxification, cell adhesion and male fertility? Biol. Rev. Camb. Philos. Soc. 90 (1), 254–278. doi: 10.1111/ brv.12108
Esposito, S., Garziano, M., Rainone, V., Trabattoni, D., Biasin, M., Senatore, L., et al. (2015). Immunomodulatory activity of pidotimod administered with standard antibiotic therapy in children hospitalized for community-acquired pneumonia. J. Transl. Med. 13, 288. doi: 10.1186/s12967-015-0649-z
Filipiak, W., Sponring, A., Baur, M. M., Ager, C., Filipiak, A., Wiesenhofer, H., et al. (2012). Characterization of volatile metabolites taken up by or released from Streptococcus pneumoniae and Haemophilus influenzae by using GC-MS. Microbiology 158 (Pt 12), 3044–3053. doi: 10.1099/ mic.0.062687-0
Goeminne, P. C., Hernandez, F., Diel, R., Filonenko, A., Hughes, R., Juelich, F., et al., (2019). The economic burden of bronchiectasis—known and unknown: a systematic review. BMC Pulm. Med. 19 (1), 54. doi: 10.1186/s12890-019-0818-6 Gray, L. R., Tompkins, S. C., and Taylor, E. B. (2014). Regulation of pyruvate
metabolism and human disease. Cell Mol. Life Sci. 71 (14), 2577–2604. doi: 10.1007/s00018-013-1539-2
Griesinger, C., Otting, G., Wuethrich, K., and Ernst, R. R. (1988). Clean TOCSY for proton spin system identification in macromolecules. J. Am. Chem. Soc. 110 (23), 7870–7872. doi: 10.1021/ja00231a044
Grimble, R. F. (2006). The effects of sulfur amino acid intake on immune function in humans. J. Nutr. 136 (6 Suppl), 1660S–1665S. doi: 10.1093/jn/136.6.1660S Hanai, J., Doro, N., Sasaki, A. T., Kobayashi, S., Cantley, L. C., Seth, P., et al. (2012).
Inhibition of lung cancer growth: ATP citrate lyase knockdown and statin treatment leads to dual blockade of mitogen-activated protein kinase (MAPK) and phosphatidylinositol-3-kinase (PI3K)/AKT pathways. J. Cell Physiol. 227 (4), 1709–1720. doi: 10.1002/jcp.22895
Hui, S., Ghergurovich, J. M., Morscher, R. J., Jang, C., Teng, X., Lu, W., et al. (2017). Glucose feeds the TCA cycle via circulating lactate. Nature 551 (7678), 115– 118. doi: 10.1038/nature24057
Hunter, E. A., and Grimble, R. F. (1994). Cysteine and methionine supplementation modulate the effect of tumor necrosis factor alpha on protein synthesis, glutathione and zinc concentration of liver and lung in rats fed a low protein diet. J. Nutr. 124(12):2319–2328.
Ishiguro, K., Ando, T., Maeda, O., Watanabe, O., and Goto, H. (2014). Suppressive action of acetate on interleukin-8 production via tubulin-alpha acetylation.
Immunol. Cell Biol. 92 (7), 624–630. doi: 10.1038/icb.2014.31
Kay, L. E., Keifer, P., and Saarinen, T. (1992). Pure absorption gradient enhanced heteronuclear single quantum correlation spectroscopy with improved sensitivity. J. Am. Chem. Soc. 114, 10663–10665. doi: 10.1021/ja00052a088 King, P. T., Holdsworth, S. R., Freezer, N. J., Villanueva, E., and Holmes, P. W.
(2006). Characterisation of the onset and presenting clinical features of adult bronchiectasis. Respir. Med. 100 (12), 2183–2189. doi: 10.1016/j. rmed.2006.03.012
Kocurek, E. G., and Jagana, R. (2019). Noncystic fibrosis bronchiectasis management: opportunities and challenges. Curr. Opin. Pulm. Med. 25 (2), 192–200. doi: 10.1097/ MCP.0000000000000562
Maniscalco, M., and Motta, A. (2017). Biomarkers in allergic asthma: Which matrix should we use? Clin. Exp. Allergy 47 (8), 1097–1098. doi: 10.1111/cea.12978 Maniscalco, M., Paris, D., Melck, D. J., D’Amato, M., Zedda, A., Sofia, M., et al.
(2017). Coexistence of obesity and asthma determines a distinct respiratory metabolic phenotype. J. Allergy Clin. Immunol. 139 (5), 1536–1547 e1535. doi: 10.1016/j.jaci.2016.08.038
Maniscalco, M., Cutignano, A., Paris, D., Melck, D. J., Molino, A., Fuschillo, S., et al. (2018a). Metabolomics of exhaled breath condensate by nuclear magnetic
resonance spectroscopy and mass spectrometry: a methodological approach.
Curr. Med. Chem. doi: 10.2174/0929867325666181008122749
Maniscalco, M., Paris, D., Melck, D. J., Molino, A., Carone, M., Ruggeri, P., et al. (2018b). Differential diagnosis between newly diagnosed asthma and COPD using exhaled breath condensate metabolomics: a pilot study. Eur. Respir. J. 51 (3). doi: 10.1183/13993003.01825-2017
Maniscalco, M., Fuschillo, S., Paris, D., Cutignano, A., Sanduzzi, A., and Motta, A. (2019). Clinical metabolomics of exhaled breath condensate in chronic respiratory diseases. Adv. Clin. Chem. 88, 121–149. doi: 10.1016/bs.acc.2018.10.002 Montuschi, P., Paris, D., Melck, D., Lucidi, V., Ciabattoni, G., Raia, V., et al. (2012).
NMR spectroscopy metabolomic profiling of exhaled breath condensate in patients with stable and unstable cystic fibrosis. Thorax 67 (3), 222–228. doi: 10.1136/thoraxjnl-2011-200072
Montuschi, P., Paris, D., Montella, S., Melck, D., Mirra, V., Santini, G., et al. (2014). Nuclear magnetic resonance-based metabolomics discriminates primary ciliary dyskinesia from cystic fibrosis. Am. J. Respir. Crit. Care Med. 190 (2), 229–233. doi: 10.1164/rccm.201402-0249LE
Otsuka, M., Mine, T., Ohuchi, K., and Ohmori, S. (1996). A detoxication route for acetaldehyde: metabolism of diacetyl, acetoin, and 2,3-butanediol in liver homogenate and perfused liver of rats. J. Biochem. 119 (2), 246–251. doi: 10.1093/oxfordjournals.jbchem.a021230
Paris, D., Maniscalco, M., and Motta, A. (2018). Nuclear magnetic resonance-based metabolomics in respiratory medicine. Eur. Respir. J. 52 (4). doi: 10.1183/13993003.01107-2018
Ren, J. G., Seth, P., Ye, H., Guo, K., Hanai, J. I., Husain, Z., et al. (2017). Citrate Suppresses tumor growth in multiple models through inhibition of glycolysis, the tricarboxylic acid cycle and the IGF-1R pathway. Sci. Rep. 7 (1), 4537. doi: 10.1038/s41598-017-04626-4
Riboldi, P., Gerosa, M., and Meroni, P. L. (2009). Pidotimod: a reappraisal. Int. J.
Immunopathol. Pharmacol. 22 (2), 255–262. doi: 10.1177/039463200902200201
Trabattoni, D., Clerici, M., Centanni, S., Mantero, M., Garziano, M., and Blasi, F. (2017). Immunomodulatory effects of pidotimod in adults with community-acquired pneumonia undergoing standard antibiotic therapy. Pulm. Pharmacol.
Ther. 44, 24–29. doi: 10.1016/j.pupt.2017.03.005
Vinolo, M. A., Rodrigues, H. G., Hatanaka, E., Sato, F. T., Sampaio, S. C., and Curi, R. (2011). Suppressive effect of short-chain fatty acids on production of proinflammatory mediators by neutrophils. J. Nutr. Biochem. 22 (9), 849–855. doi: 10.1016/j.jnutbio.2010.07.009
Whiteson, K. L., Meinardi, S., Lim, Y. W., Schmieder, R., Maughan, H., Quinn, R., et al. (2014). Breath gas metabolites and bacterial metagenomes from cystic fibrosis airways indicate active pH neutral 2,3-butanedione fermentation.
ISME J. 8 (6), 1247–1258. doi: 10.1038/ismej.2013.229
Zhang, X., Varin, E., Allouche, S., Lu, Y., Poulain, L., and Icard, P. (2009). Effect of citrate on malignant pleural mesothelioma cells: a synergistic effect with cisplatin. Anticancer Res. 29 (4), 1249–1254.
Conflict of Interest: The authors declare that the research was conducted in the
absence of any commercial or financial relationships that could be construed as a potential conflict of interest.
The reviewer NM declared a past co-authorship with one of the authors to the handling editor.
Copyright © 2019 D’Amato, Paris, Molino, Cuomo, Fulgione, Sorrentino, Palomba, Maniscalco and Motta. This is an open-access article distributed under the terms of the Creative Commons Attribution License (CC BY). The use, distribution or reproduction in other forums is permitted, provided the original author(s) and the copyright owner(s) are credited and that the original publication in this journal is cited, in accordance with accepted academic practice. No use, distribution or reproduction is permitted which does not comply with these terms.