CUSTOMER SATISFACTION MEASUREMENT PROCEDURES:
ONE-DIMENSIONAL AND MULTI-DIMENSIONAL APPROACH
Mario Montinaro, Paolo Chirico
Dipartimento di Statistica e Matematica applicata “Diego de Castro”, Università degli Studi di Torino. [email protected]; [email protected]
Abstract
The purpose of this paper is to present an overview of the principal methods of measurement of Customer Satisfaction (CS) and to discuss their strengths and limits. Two approaches are dealt with: (i) one-dimensional measurement - namely the measurement of a single variable representing overall satisfaction of the good or the service (the focus here is on measurement scales); (ii) multidimensional measurement, that takes account of all the variables characterizing the CS complex concept. We analyze here compositive models (SERVQUAL) and PLS-Path Models. Finally, we provide some guidelines for possible developments.
1. INTRODUCTION
The great attention to Customer Satisfaction (CS), with regard to a product or service, has been increasingly explained over the past few years, particularly in western economies, by the fact that it is one of the main parts of the optimal company management model (Kanji et al., 2000).
A company is considered well managed if it succeeds in producing goods or planning services that meet the satisfaction of customers and, compatibly with the associated marketing system, allows a convenient payback of the investment carried out by the company in the production of goods or in the design of services. From the point of view of CS it is however wise to distinguish between a company that produces goods and another that produces services, between a company that produces for big customers and another that produces for the end consumer; between a company ranking in the top market range and another operating in the medium or low range; between a company with a high level of dynamism – namely bringing forward several products in the unit of time – and another characterised by a low level of dynamism; lastly between a company with
a strong image on the market, built through investments in communication (advertising and promotion), and another that has a weak image because it has operated with the low price strategy, for example.
In CS assessment it seems clear that a first strong distinction should be made between the tools of measurement – with particular reference to the scales of measurement – that are proposed to verify the customer satisfaction of a durable good compared with a service. Indeed, it is impossible to think that the ordinal scale or interval scale can be the same for measuring a product or a service; nor can the same types of scale be considered for dealing with different company situations, like the ones that have just been defined; and it is fully known that the different type of scale substantially affects the choice of the statistical techniques implemented to define the degree of customer satisfaction.
It is also well-known how important in CS analysis are the theories about changing consumers’ tastes and whether these changes are of an individual or collective nature, i.e. associated with the pressures of the environment or not. If taste is studied in the broader sphere of the social differences system, the subject of marketing surveys is the taste system experienced in a structuralist key that solves the individual–collective dichotomy; this results in the joint presence of an élite taste and a mass taste fuelled by the new disciplines of the theory of information and communication that explains changes of taste as function of information.
Every consumer is therefore exposed to a whole series of messages by the mass media that produce clearly differentiated programmes by which both individually and in terms of social group one is conditioned in the choices of the consumption of products and services, i.e. in the choice of a product, like a type of car for example, or of a service like the different forms of spending leisure time; this triggers an intersubjective relation that intervenes in the evaluation process of single products or of different life styles. The problem of taste, also being a problem of language, is characterised by the joint presence of two subjects: the manufacturing company that brings out the message according to the communication strategy addressed at the maximum qualification of its own product or service and the consumer who receives it and who is in any case more or less influenced by it; therefore CS, both on products and services, despite the effort of methodologists, who are addressing the fine-tuning of tools for the definition of objective judgements, is heavily influenced by the competitiveness among manufacturers who use the classical implements of marketing to direct choices and opinions.
It is therefore possible to understand the evaluation mistakes that give rise to any judgement formulated on an external attribute – because this is actually the question – since the generic consumer is rarely in the condition to be aware of objective technical aspects on quality assessment. The result of this is that in the
choice of consumer samples, the sampling plans must play a primary part, compatible with the constraint of objectivity in relation to literature reported until now on the choices of appropriate sampling plans in CS assessment.
The operative market uses certain tools to achieve the objectives of differentiating between products or between services, which are prevailingly data concerning price, product, distribution and communication strategies. These four basic tools are used exactly to generate the maximisation of the differences between goods or between services of the same type: and it is within this sphere of extreme difference logic that CS studies are created and developed.
The great importance of these studies is explained by the considerations that where for every company high CS values exist, for the company itself the main components of the optimal business management model prevail.
Issues linked with Customer Satisfaction arose in marketing studies starting from the mid Eighties, even if the early studies refer to the mid Sixties. But it was only with the evolution and development of a market and total quality-oriented business philosophy that CS exploded during the past twenty years.
Naturally the development and in-depth investigation of the topics involved all disciplines, which in the broad sense are associated with marketing, also including psychology, with regard to the identification and the cognitive presuppositions of the concept of satisfaction and statistics concerning the tools of measurement and evaluation of the phenomenon.
The characterising points are:
i) How many dimensions does the phenomenon have; ii) How to measure them;
iii) How to combine them in a single measurement.
Point i) pertains mainly to the branch of marketing that studies consumer psychology, expectations and the processes that lead to feeling more or less satisfied. Conversely points ii) and iii) explicitly pertain to methodological statistics. The purpose of this paper is to present the main CS measurement procedures following the dual approach featuring:
• One-dimensional measurement, namely the measurement of a single summary variable of CS that is generally identified with the overall satisfaction of the good produced or the service planned;
• a multidimensional measurement, that takes account of all the variables that characterise CS.
The main objective of this paper is to bring forward some still evolving methodological profiles and the lines of development to obtain a CS measurement index in the field of goods and services.
2. ONE-DIMENSIONAL MEASUREMENT 2.1 SINGLE MEASUREMENT ON ORDINAL SCALE
Since overall satisfaction is by nature an ordinal qualitative phenomenon1, the simplest and most intuitive way of measuring it is to measure it directly on an ordinal scale: i.e. ask the customer/user to formulate his/her own level of overall satisfaction according to a scale of the following type:
Very Dissatisfied Neither satisfied Satisfied Very dissatisfied nor dissatisfied satisfied
During evaluation, the ordinal nature of the scale of measurement suggests, in primis, the mean as summary index of CS; for further “descriptive” indications it is possible to consider the quartiles, the relative, cumulative and retrocumulative frequency distribution, heterogeneity indices, etc. Also the user percentage belonging to the highest level (e.g. very satisfied) can be meaningful in this direction.
These descriptive types of ratings photograph the situation, without however indicating its causes; if the rating is to be raised to this level, i.e. analysis of the dependence of CS on specific aspects (attributes) of the product/service, then the known limits of the qualitative-ordinal nature of the data emerge. However, without resorting to the transformations described in the following paragraphs, it is possible to use, for example, logistic regression to explain the probability that the customer be in the highest category (Cmax); formally:
P C X X ... X 0 1 1 2 2 0 1 1 ( ) exp( ) exp( max = + + + + + +
β
β
β
β
β
1ββ
2X2 +...) (1)where X1, X2… are the variables interpreting the attributes (or levels of them) and
βj the related linear coefficients.
To sum up, the advantages of single measurement on an ordinal scale lie in its obvious simplicity of data survey and treatment for medium-low level indications. On the other hand the non metric nature of the data, restricts the possibilities of more in-depth evaluations, especially with regard to the cause-effect links between overall satisfaction and attributes.
2.2 MEASUREMENT ON PSEUDOMETRIC SCALE
If it is clear that a metric measure of satisfaction would open its evaluation to an upper range of analysis, it is not equally clear how this measurement procedure can be brought about. It has been said that this phenomenon is instinctively perceived by the customer as ordinal qualitative and solutions of the following type:
• State your level of satisfaction with a score between 1,…, k
• Mark your level of satisfaction on the segment: 0 |___________________| max only apparently provide a measurement in a numerical continuum. In fact, the user answering is not always aware that answering 5 in a scale from 1 to 7 expresses a measurement that is half from the maximum compared with the minimum (interval scale) or that marking the segment above expresses an assessment that is in the exact proportion with the maximum satisfaction possible (ratio scale). To make these requirements more credible it is necessary to develop a scaling of the levels of satisfaction, i.e. make a numerical value correspond to the most intuitive ordinal categories, with which the levels are manifested and consistent with them. A fairly simple way to do this consists in the following procedure:
1) choosing categories that meet a semantic equidistance criterion; 2) allocating whole progressive numbers to the categories.
This arrangement corresponds to the differential semantic scale and the Likert
scale. The former is built:
1) initially choosing two opposed and symmetrical categories in relation to a third neutral one to which a value of zero is given;
2) subdividing the two categories into intermediate degrees and giving them progressive values symmetrical to zero.
For example:
dissatisfied Neither satisfied Satisfied
very fairly a little nor dissatisfied a little fairly very
-3 -2 -1 0 1 2 3
The second measure is the degree of agreement/disagreement about meaningful situations, which in CS measurement usually depict the excellence of the product/ service (e.g. “The personnel pays attention to the customer’s requirements”). Generally there is an odd number of levels, according to the following logic:
strongly Neither in strongly in in agreement nor in in disagreement disagreement disagreement agreement agreement
1 2 3 4 5
Measurement with these scales is taken as metric by intervals. This assumption is fairly plausible, although conventional and not based on scientific criteria. In fact, only by convention is it assumed that the difference between level 2 (in disagreement) and level 3 (neither in agreement nor disagreement) is half the distance between level 3 and level 5 (strongly in agreement); in this sense these scales ought to be more correctly considered as pseudometric. On the other hand, the combination of
ordinal categories-numerical value allows a fairly easy survey of the levels of
satisfaction and, therefore, also a broader and more powerful range of statistic analyses. For instance it is possible to resort to the following type of regressive linear models:
Y
=
β
0+
β
1X
1+
β
2X
2...
+
ε
(2)to explain the link between the measure of overall satisfaction Y and the attributes
Xj of the product/service, quantifying its contribution and highlighting the more meaningful ones.
2.3 SCALING BY INVERSION OF THE DISTRIBUTION FUNCTION
The scaling techniques described in the previous paragraph, also known as
direct determinate quantification techniques, are based on the assumption that the
ordinal categories are equidistant. In truth several authors (Marbach, 1974) have proved that this assumption is not universally true, i.e. the distance between the categories of a same set varies according to the population and context.
To remedy this circumstance, different scaling techniques have been adopted known as indirect determinate quantification as the scaling is developed in connection to a probabilistic or explicative model. This includes:
a) scaling by inversion of the distribution function; b) optimal scaling methods.
The first scaling method is based on the assumption of knowing the distribu-tion of the quantitative variable Y, which expresses the phenomenon measured in the continuum. This approach originates from psychometry, where for many phenomena (consider the degree of happiness) the hypothesis of normal distribution of the
relative quantitative variable Y is plausible.
Scaling can be conducted assuming the existence of a corresponding continuous latent variable Y (not directly observable), expressed on a ratio or on an interval scale, so that there are values Y1, Y2, ...YR which correspond to the cumulative probability Fc(·) up to C1, C2, ..., CR, of the observed categorical variable X. In consequence we obtain:
Yk = FY-1[F
C(C k)] if k=1, 2, …, K (3)
where Y1, Y2, ...YR are by hypothesis values on a ratio or interval scale and replace the typically conventional scores C1, C2, ..., CR assigned to the categories of the variable X.
While in psychometry many variables can be assumed as distributed normally (psychometric or Thurston method, 1925), the same in not true for overall satisfaction, the distribution of which2 inevitably depends on the subject of evaluation: if the product/service as a whole is poor quality (excellent), the distribution of Y will logically be asymmetrical to the left (right) as most of the population is concentrated on low (high) values. In this sense the beta distribution:
f x a b x x Y a b ( ) ( , ) ( ) = 1 − − − 1 1 1 B rom which
F y
Y( )
=
∫
yf x dx
Y( )
0 (4)could be indicated to build a scaling in the interval [0, 1], however the question remains open concerning the two parameters a and b, for which a certain determination criterion does not exist3.
2.4 OPTIMAL SCALING METHODS
From a mathematical point of view, the scaling of an ordinal qualitative variable C consists in the identification of a monotonic transformation S : C-> R. With the method described in the previous paragraph, this transformation is the inverse of a probabilistic distribution function4; with the optimal scaling methods transformation is a generic function that optimises a certain relation between the variable in the continuum Y and a suitable explicative model (see Boch, 1960). At
2 Clearly of its quantification in the continuum.
3 However besides the beta distribution other asymmetric probability distribution were proposed
in the context of CS, see e.g. A. Zanella (1998), A Stochastic model for the analysis of customer satisfaction: some theoretical and simulation results, Total Quality Management, 9, n. 7, pp. 599-609, where the so-called logistic-Weibull distribution is presented and discussed.
the base there is the idea that variable Y can be well explained by a suitable model and that therefore the transformation S can be identified in the one that optimises this relation. In the simplest formulation (in our opinion) the explicative model is regressive (monotone regressio, Kruskall, 1965) and the problem can be seen as a system:
Y
S(C)
Y
0X
X
=
=
+
+
+ +
β
β
1 1β
2 2...
ε
(5)the solution of which consists in jointly identifying the monotonic transformation
S and the parameters βj that minimise the sum of the mean square deviations ε. The final solution can be reached with a convergent iteration process, which alternatively seeks the optimal transformation S, given the βj and then the optimal parameters
βj, given S. Since at every iteration the estimators of S 5 and of β
j follow the criterion of least squares, this scaling is known as ALSOS (Alternating Least Square Optimal
Scaling, Young, de Leeuw, Takane, 1976). This scaling technique is at the basis of non metrical conjoint analysis models where the variable answer is originally
qualitative.
The advantages of this approach are that the identification of the scaling is distribution free, unlike what happened with the reverse of the distribution function; in addition, at the same time we have an assessment model of overall satisfaction
Y. The limit consists in the dependence of the scaling on the existence of a good
explicative model. If this fails to exist or is not correctly planned, the resulting scaling will scarcely be indicative.
Both scaling techniques by inversion of the distribution function and those with optimal scaling do not in general give the same scaling to all the qualitative variables present in the CS rating and having the same categories. However, there are some attempts on the subject to get around what, in some ways, would seem to be a logical contradiction (see Zanella et al., 2004 and Chirico, 2005).
5. MULTIDIMENSIONAL MEASUREMENT
The idea at the base of CS multidimensional measurement is that the “Overall Satisfaction” variable alone is not enough to represent it with a reasonable approximation. The reasons behind this idea rest on different considerations;
5 S is identified by a parameter vector [Y
1, …YK] so that Y1<…<YK e Yk=S(Ck). Its unequivocal
among these, one is that the “Overall Satisfaction” manifested in a precise moment is the result not only of the actual reasoned and conscious evaluation, but also of personal, instinctive, emotional and circumstantial factors. Let us think about “Overall satisfaction” for a tourist package and how the extemporaneous manifestation of it depends on factors like the conditions of the weather or the customer’s mood when availing of the product in question.
To get a less “moody” representation of CS and of the inner evaluation process that determines it, it becomes appropriate to consider different aspects (dimensions) of the service or product.
More precisely when we want to “measure” the customer satisfaction we are confronted with a typical case of quantification of a concept of subjective and psychological nature which is deeply different from the physical and technological concepts, like mass velocity, strength etc., whose quantification, in broad terms, is studied and provided for in metrology. Correspondingly in the field of behaviour sciences like psychology, sociology and, let us add marketing, a methodology for the concept quantification has little by little been set up whose essential features can be summarized as fellows, see for instance Bollen (1989), p. 179 and following. Obviously the recourse to the substantial knowledge of the field to which the concept refers is fundamental. It follows a procedure describable by the next phases:
1. Finding an accurate verbal definition of the concept.
2. Pointing out the most important aspects of the phenomenon we are considering which are supposed to be linked to the concept under study: concept “dimensions” to each of which it is typical to associate a latent or not observable variable. In this regard we have to distinguish between exogenous variables, which are only “causes” of the concept present in the observed situation, and endogenous variables, which are related to the concept but may be linked to one another. 3. For each dimension definition of some, at least two, observable indicators, that
we suppose to be “strictly” related to it, which together constitute a measurement procedure (the dimension latent variable is linked to its indicators through linear regression equations, the so-called outer relations).
4. Overall confirmation of the assumed dimensions – which together establish the elements of the concept construct defining the concept under study – by means of the latent factor confirmatory statistical analysis (here in particular for each dimension Cronbach’s index α is often used).
5. Setting up and confirmation of the concept model by means of linear regression equations – inner relations – which link the latent variable of the concept under study or focal concept with the other construct dimensions.
6. Definition of an indirect measurement procedure for the focal concept through a linear weighted aggregate of its indicators whose weights may take into account the regression relations (see below PLS) between the focal concept and the other construct latent variables.
In this sense it is possible to distinguish two different approaches represented by two different measurement models:
– compositive models;
– causal models with latent variables.
3.1 COMPOSITIVE MODELS: THE SERVQUAL
Compositive measurement models interpret CS as the mixture of a certain number of partial satisfactions, related with particular aspects of the product or service. Among these models the most famous is surely the SERVQUAL originally proposed by Parasuraman, Zeithaml, Berry (1988). The model, conceived explicitly for measuring the quality of services is based on the paradigm of the discrepancy (gap) of value, i.e. satisfaction as discrepancy between expected quality and quality perceived by the user. In this sense CS is seen as the composition of the discrepancies between expected and perceived quality related with 5 aspects or dimensions of a service:
– tangible aspects; – reliability; – reactivity;
– capability of reassurance;
– capability to understand the user’s requirements (empathy).
Each of these dimensions is measured doubly (for expectations and perceptions) through a certain set of manifest variables, measured with Likert’s scale; the mean of the scores of the variables of every dimension gives a measurement of it. The CS measurement of every user is lastly obtained composing the measurements of every dimension with weights amounting to the relative importance attributed to each of them. Operatively every user i is given a questionnaire requiring for every dimension h, a degree of importance wih and the degrees of agreement related with nh pairs of assertions (variables) of the following type:
– The expected times for the supply of the service are short (perceptions X);
– The waiting times for the supply of the service ought to be short (expectations Z)6.
The individual measurement of CS will then be:
CSI
iw
ihx
ihkz
ihkn
k n h h h
=
−
= =∑
∑
(
) /
1 1 5 (6)As the measurements are conventionally metric, as a brief index of user CS the arithmetic mean in the population (or in the sample) is considered.
Several authors (Cronin and Taylor, 1992 and 1994) hold that the perceptions
X are already inclusive of the expectations Z and therefore the latter can be omitted
from the formula (SERVPERF model), reducing the questionnaire. Moreover, the exclusion of the distinction between expectations and perceptions precludes understanding if a low score depends on medium performance levels and high expectations or rather low performance levels and medium expectations.
The great value of SERVQUAL and of the models derived from it lies in having developed a practical and simple measurement and evaluation procedure, but at the same time fairly consolidated and recognised. However, certain limits can be noted, including:
– Recourse to pseudometric scales for measuring manifest variables also makes the measurement of the final index pseudometric;
– The measurements of every dimension are obtained with simple arithmetic means of the manifest variables, which are therefore all placed on the same level; – the dimensions are correlated, while they are presented to the answering person as separate aspects; therefore the composition of them should not be a simple weighting according to the relative importance;
– the weight to be given to every dimension is a fairly complex judgement for the person answering, who often does so in a not wholly convinced and weighted manner;
– in addition, being a model explicitly conceived for services, SERVQUAL reveals different rigidities in use in the context of consumer items.
3.2 CAUSAL MODELS WITH LATENT VARIABLES: ACSI AND ECSI INDICES The idea of the multidimensionality of CS is taken up and developed by causal
models with latent variables (Path-LV, Wold 1985). In these, CS is understood as
a semantic concept (construct) h not directly observable, but for which it is possible to have an approximated manifestation (except for an error εh) with a certain number H of indicators Yh:
Within the limits of the above H relations, could be identified through the well-known factorial analysis techniques. But the model (7) is a measurement model that does not take account of the internal determination process of CS, namely the cause-effect relations that involve η. Wanting to recover this process, it is necessary to insert η in a system of cause-effect relations with other constructs according to an appropriate logical pattern, such as for example7:
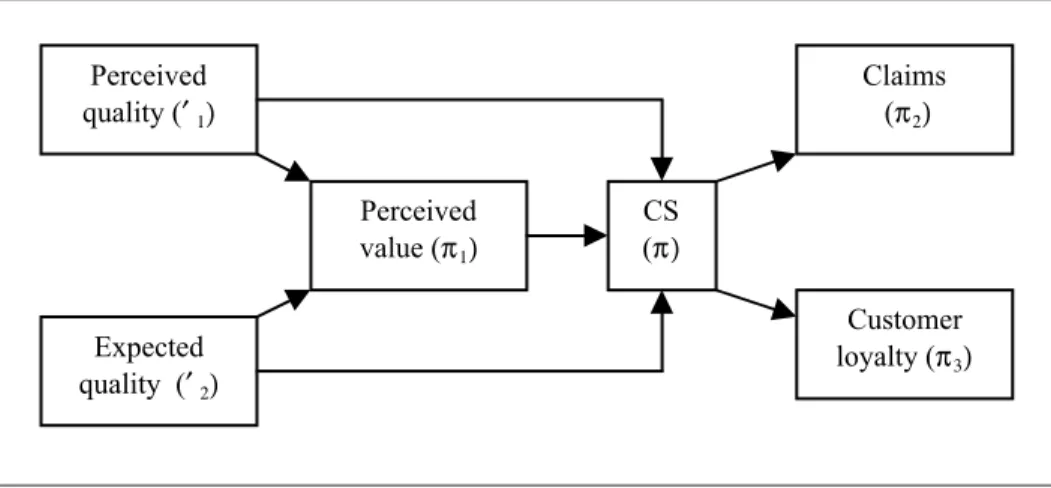
Fig. 1: Conceptual pattern of the ACSI index.
Perceived quality (]1) Expected quality (]2) Perceived value (M1) CS (M) Claims (M2) Customer loyalty (M3)
7 In particular this is the one of the American Customer Satisfaction Index (see further). 8 Some of which are null, according to the derivation structure.
The above pattern can be formalized, in matrix form, by the following system:
η = Βη + Γξ + δ (8)
where η´= [η, η1,...] are the endogenous constructs (which are the effect of other constructs) and ξ´= [ ξ1, ξ2,...] the exogenous constructs (which are only cause); B and Γ are the matrices of the coefficients of the relations between the constructs8;
δ is a vector of random errors.
As the constructs are not directly observable concepts, they are measured by manifest quantitative variables (indicators) through two measurement systems:
Y = Λyη + εy (9)
X = Λx ξ +εx (9bis)
and ξ , while εy, εx are random measurement errors (assumed at mean null and not correlated with each other, as also the errors δ). The Path-LV model, made up of the above relations, is often also known by the acronym LISREL (Linear Structural
Relations, Jöreskog, Sörbom, 1973, 1996), however LISREL precisely identifies an
analysis technique (with the relevant software) that uses a Path-LV model with the main aim of estimating the degree of relation between constructs (parameters), rather than measuring the actual constructs. For CS measurement purposes, a technique known as Partial Least Squares (PLS, introduced by Wold, 1973, 1985 and developed among others by Lohmöller, 1989, Chin 2001) is preferable, which estimates the parameters and scores of the latent variables (latent score) of a Path-LV model through a two step algorithm. In the first stage the latent scores are estimated as linear combination of the relative manifest indicators; the weights of each combination are determined by an iterative procedure which takes account of the direct links between the latent variables (for a review of the technique and an application of it for measuring the ECSI index, see: Tenenhaus, Vinzi, Chatelin, Lauro 2005). Then the parameters of the causal relations are estimated, taken in sequence, with the ordinary least squares criterion. This technique has the advantage of being “free distribution” and does not therefore require any assumption concerning the distribution of the constructs and indicators. The mean of the CS-related scores (η) gives an estimate of the CS of the customers of a product or service.
The measurement approach through Path-PLS models is the one followed by the American Customer Satisfaction Index, ACSI (Anderson and Fornell, 2000), and by the corresponding European ECSI. The ACSI, proposed in 1994 by the National Research Center of Michigan University, is a national quality index of products and services measured with the customer satisfaction viewpoint; it annually surveys the satisfaction of customers with samples of approx. 250 units c/ o over 200 American firms (the major ones), representing all the main sectors of the American economy. The logic measurement pattern is the one shown in fig. 1 and it is developed measuring a total of 14 manifest indicators. The index is calculated at company, sector and nation level, providing important comparative information at each level for firm managers, sector and national administrators. For example, the 1998 ACSI revealed that American consumers were very satisfied with non-durable goods, less with durable goods and not much with services; the FedEx ranked 1st in its sector and 23rd in the general classification.
On the example of the ACSI and of some experiences in single countries9, in
9 The Deutsche Kunden Barometer in Germany and the Customer Satisfaction Barometer in
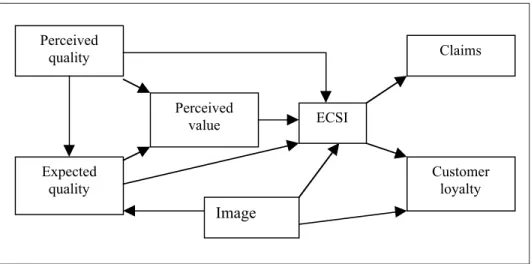
1999 the European organisation for Quality (EOQ) with the support of the European Commission and of the European Society for Opinions and Market Researches (ESOMAR) prepared the European Customer Satisfaction Index (ECSI), which deals with 4 service sectors (banking, large-scale distribution, landline telephony, mobile telephony) in 11 countries that have joined the project (Belgium, Denmark, Finland, France, Greece, Iceland, Italy, Portugal, Spain, Sweden, Switzerland). Compared with the American index, the ECSI also reveals the “Image” construct, which depicts the idea (positioning) that the customer has of the service:
Fig. 2: Conceptual pattern of the ECSI index.
Perceived quality Expected quality Perceived value ECSI Claims Customer loyalty Image
If CS measurement-evaluation with Path-Pls models now seems to be the way mostly recommended by the scientific world, it is also true that there is no unanimous agreement about the logic structure to be adopted; mention has been made of certain differences between the American Index and the European one, which should be joined by the different theses of various authors about the constructs and their structuring in relation to the CS construct (see Brasini, Cagnone, Tassinari; Lombardo; Molteni, 2002).
Cronin and others (2000) do not consider disconfirmation of expectations in their models, also highlighting the perception of performance ratings and including
service quality as construct preceding CS.
Costabile and Molteni (2000), like others before them, highlight the variable role, on CS, of the expectations and of the perceptions according to “experience”
products (with prevalence of the direct effect of perceptions), “research” products (with prevalence of the direct effect of the perceived value) and “trust” products (with prevalence of the direct effect of the expectations).
Wirtz and Bateson (1999) consider emotional constructs, such as pleasure in addition to cognitive constructs, of inner evaluation, such as disconfirmation. This idea of the presence of emotional constructs that affect satisfaction, together with cognitive constructs (on which they also depend) is brought forward in recent works by Miceli, Molteni and Costabile (2005).
Mittal and Kamakura (2001) also reveal the importance of some socio-demographic variables of consumers on disconfirmation. Mittal (1999) and others have proved the role of time in altering the importance of the attributes, which contribute to satisfaction, viewed in the dual aspect of satisfaction with the product and satisfaction with the service.
We personally add that the use of Likert’s scale for the indicators of certain constructs actually makes the measurement scale of the construct itself become pseudometric, with the limits mentioned previously in paragraph 2.2.
To the examples mentioned now, concerning models of a general nature, it is also necessary to add a variety of models for specific contexts, in which the constructs and their structuring vary in proportion to the context, also differing greatly from the standard structure of the ACSI10.
Last but not least, to these observations we should add the technical complexity of these models, which require adequate software and above all expert personnel in both the application method and context.
3.3 OTHER METHODS AND FURTHER CONSIDERATIONS
The Path-Pls models are not however the only models proposed by the scientific world, nor would it be correct to consider them as the methodological forefront or the only way possible. It is wise to remember that national and international technical standards11, on the subject of assessment of the quality of products and services, to which CS measurement should refer, do not impose any explicit model, specifying instead lines of behaviour for the development of a Total Quality Management system (TQM). In this direction many other methodological approaches are legitimate, which owing to their variety and heterogeneity cannot
10 Even only mentioning all these works is impossible and would go beyond the purposes of this
paper. However, some of them, among the most well known to us, are mentioned as an example in the bibliography.
be adequately dealt with here; therefore only a few general examples will be mentioned below.
Different authors have proposed the use of some multivariate statistical techniques, such as for example principal component analysis, to reduce the dimensional space in which CS is measured and use this space to graphically highlight and evaluate the discrepancy between expectations and perceptions (among others, see Lauro, D’ambra, Scepi, Amenta, 2001). This discrepancy can be quantified, thereby providing a CS measurement, with a Mahalanobis distance12, which, as is known takes account of the correlation between the dimensions of the space of measurement. This overcomes the limit revealed by the SERVQUAL methods, in which the problem of the redundancy of information of certain dimensions is not considered.
Still on the subject of data reduction techniques, some scholars of the Turin Polytech (Franceschini, Vicario, Brondino, Galetto, 2004) have resorted to Lattice
Analysis to sort the customer’s multidimensional qualitative evaluations. This
technique places these evaluations in a multidimensional lattice that is “projected” in a single-dimensional space, thereby determining measurements for every level of evaluation.
Others still, have revealed how measurement-evaluation models, in all those contexts where the reference population is not homogeneous, but structured in groups with different characteristics, must follow a multilevel logic (see in Gori, Vittadini, 1999).
6. PROSPECTS FOR THE FUTURE
Though the study and research for the development and fine-tuning of tools for CS measurement and evaluation is still keen, different scholars have for some years been doubting the centrality of CS in the strategic evaluations of who supplies a product or performs a service. Actually, in an essentially market-oriented viewpoint, CS is not a final target, but the presupposition (not alone, though fundamental) for other targets such as for example:
– Customer loyalty for goods and services marketed in a competitive system; – Public/political consensus in the case of public utility services.
Since a high CS level does not always correspond to an adequate return, in terms of loyalty, many analysts have opted directly for Customer Loyalty (CL) and
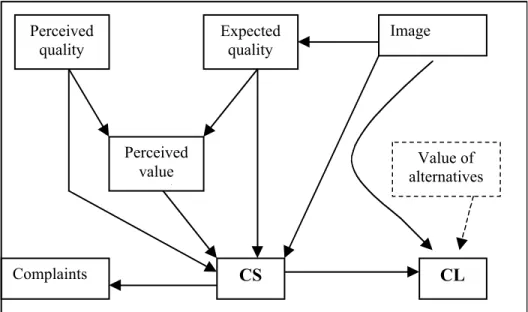
its correct measurement, as well as the evaluation of the links between this and the behaviours and attitudes of the customers. However, CL is not considered an alternative target to CS or an evolution of it, but a separate construct, even if correlated and equally important: CL plays a strategic part in the case of goods and services supplied in a competitive system, but CS remains a more general and reference construct above all for public utility services. For services like railway transport (in the case of Italy), justice or public security, loyalty is a wholly theoretical concept, as there are no realistic alternatives or the possibility to do without them in the case of need, whereas CS has a much more concrete foundation. Very probably, the most correct approach is to adopt a “bifocal” measurement system, with the objective of the joint measurement of both constructs. This arrangement is already partly considered by the ACSI and ECSI measurement models, as may be noted from their conceptual patterns (Figures 1 and 2). Therefore, the most logical way is that of keeping the conceptual framework of the ECSI index, developing the Loyalty aspect and extending the measurement system also to consumer goods. The two development actions are logically connected, owing to the strategic role of CL in consumer goods. Since it is known that CL also depends on the existing alternatives, it is possible to hypothesise a conceptual pattern which, taking up the one for ECSI also takes account of this further construct (Figure 3).
Fig. 3: Hypothesis of implementation of ECSI.
Perceived quality Expected quality Image Perceived value i Value of alternatives Complaints
CS
CL
The Value of alternatives construct would be understood as referring to the best product or service in question present (if it exists!) on the market and its manifest variables ought to take account of the degree of accessibility, of the price and of the relative quality (quality/price). Clearly, this construct like the corresponding
Perceived value has its own conceptual background structure and therefore it would
have to be structured as an endogenous construct. However, for clear ergonomic reasons of the questionnaire to be given, it is advisable to adopt it as exogenous construct.
With regard to the indicator measurement scale, where the indicators have an ordinal qualitative nature, it would be interesting to investigate the possibility of integrating the optimal scaling techniques described in paragraph 2.3 in the Path-PLS modelling.
Clearly, the hypotheses formulated in this paper are to be understood as a starting point for the development and preparation of a broader measurement model of subjective quality and its implications (CS and CL), above all in the sphere of consumer goods, which as mentioned previously, are not currently measured by the ECSI index.
BIBLIOGRAPHY
ANDERSON E.W., FORNELL C. (2000), Foundation of the American Customer Satisfaction Index,
Total Quality Management, 11, 869-882.
BAYOL, M.P., DE LA FOYE A., TELLIER C., TENENHAUS, M., (2000) “Use of PLS path modeling to estimate the European consumer satisfaction index (ECSI) model”, Statist. Appl. Italian Journal. 12 (3), 361–375.
BOARI G., CANTALUPPI G. (2004), Selection of Structural Equation Models with PLS-VB Programme, in Vichi M., Monari P., Mignani S., Montanari A., New Developments in
Classification and data analysis, Springer, 105-112.
BOCH R.D., (1960) Methods and Applications of optimal scaling, Psychometric Laboratory Report
25, University of North Carolina.
BOLLEN K.A. (1989), Structural Equations with Latent Variables, Wiley, New York.
BRASINI S., CAGNONE S., TASSINARI G., LOMBARDO A., MOLTENI L. (2002), Valutazioni e modelli statistici di customer satisfaction e fedeltà del cliente: linee guida d’insieme, in AA.VV., Il nuovo controllo statistico della qualità, CLEUP, Padua, 2002, pp. 27-47. BRASINI S.,TASSINARI G. (2004), Dalla Customer Satisfaction alla Customer Loyalty, Atti della
giornata studio: Metodi e modelli statistici per la valutazione della qualità e della customer satisfaction, Istituto di statistica, Università Cattolica di Milano.
CHIN, W.W. (2001), PLS-Graph User’s Guide. C.T. Bauer College of Business, University of Houston, USA.
CHIRICO P. (2005), Un metodo di scaling comune per modelli multivariati di valutazione della
customer satisfaction, Working Paper, Dipartimento di Statistica e Matematica applicata alle
COSTABILE M. (1996), La misurazione della customer satisfaction: nuove ipotesi sul paradigma
della conferma riconferma, working paper n. 10, Osservatorio di Marketing, SDA Bocconi
Milano.
CRONIN J.J., TAYLOR S.A., (1992), “Measuring Service Quality: A Re-examination and Extension”,
Journal of Marketing, 56, 55
CRONIN J.J., TAYLOR S.A., (1994), “SERVPERF versus SERVQUAL: Reconciling Performance-based and Perceptions-Minus-Expectations Measurement of Service Quality, Journal of
Marketing, 58, 125.
FORNELL C. (1992) A national customer satisfaction barometer: the Swedish experience. Journal
of Marketing 56, 6–21.
FORNELL, C., CHA, J. (1994) Partial least squares. in Bagozzi, R.P. (Ed.), Advanced Methods of
Marketing, Research. Basil Blackwell, Cambridge, MA, pp. 52–78
FRANCESCHINI F., VICARIO G., BRONDINO G., GALETTO M. (2004), Mappe sintetiche per variabili ordinali multivariate, Atti della giornata studio: Metodi e modelli statistici per la
valutazione della qualità e della customer satisfaction, Istituto di statistica, Università
Cattolica di Milano.
GORI E., VITTADINI G. (a cura di) (1999), Qualità e valutazione nei servizi di pubblica utilità, Etas. JÖRESKOG K.G., SÖRBOM D. (1996), LISREL 8: User’s Reference Guide, Scientific Software
International.
KANJI G. K., WALLACE W. (2000). Business excellence through customer satisfaction, Total
Quality Management, 11(7), 979 - 998.
KRUSKAL J.B. (1965), “Analysis of Factorial experiments by estimating monotone transformations of the data”, Journal of Royal Statistical Society, Series B, 27
LAURO C.N., BALBI S., SCEPI G. (1997), “L’analisi multidimensionale dei dati per la misurazione della Customer satisfaction”, Atti del convegno SIS ”La statistica per le imprese”, Tirrenia Stampatori, vol 1.
LOHMÖLLER, J.B. (1989), Latent Variables Path Modeling with Partial Least Squares. Physica-Verlag, Heildelberg.
MAGAGNOLI U. (1997), “Indicatori di prestazione complessiva e della customer Satisfaction”, Atti
del convegno SIS: La Statistica per le Imprese.
MARBACH G. (1974), “Sulla presunta equidistanza degli intervalli nelle scale di valutazione”,
Metron, Vol. XXXII, n. 1-4.
MICELI G., MOLTENI L., COSTABILE M. (2004), Lo stato degli studi sulla customer satisfaction: alcune evidenze empiriche a supporto di un processo contingente, Atti della giornata studio:
Metodi e modelli statistici per la valutazione della qualità e della customer satisfaction, Istituto
di statistica, Università Cattolica di Milano.
MITTAL V., KUMAR P., TSIROS M. (1999), “Attribute-Level Performance, Satisfaction and Behavioural Intention over Time: A Consumption-System Approach”, Journal of Marketing, 63, 88-101
MITTAL V., KAMAKURA W. A. (2001), “Satisfaction Repurchase Intent and Repurchase Behaviour: Investigating the Moderating Effect of Customer Characteristics”, Journal of Marketing
Research, 38 February, 131-142
MOLTENI L., COSTABILE M. (2000), Verso una tipologia di processi valutativi: differenti
approcci alla misurazione della customer satisfaction, working paper, Osservatorio di
MONTINARO M. (2002), La Customer Satisfaction: analisi storica e validazione campionaria, in AA.VV. Studi in onore di Angelo Zanella, Vita e Pensiero, Milano
PARASURAMAN A., ZEITHAML V.A., BERRY L.L. (1988), “SERVQUAL: a Multiple-Item Scale for Measuring Customer Perceptions of Service Quality”, Journal of Retailing, 64. TENENHAUS M., VINZI V.E., CHATELIN Y.M., LAURO C. (2005), “PLS Path Modeling“,
Computational Statistics & Data Analysis 48 159 – 205
THURTSTONE L. L. (1925), “A method of scaling psychological and educational tests”, Journal of Education and Psychology, 16, 443-451
WOLD H. (1973). “Non-linear iterative partial least squares (NIPALS) modelling. Some current developments” in: Krishnaiah, Multivariate Analysis, Vol. III. Academic Press, 383–407. WOLD H. (1985), “Partial Least Squares” in Encyclopedia of Statistical Science, Wiley, vol. 6, 581. YOUNG F. W., DE LEEUW J., TAKANE Y. (1976), “Regression with qualitative and quantitative
variables: an alternating least squares method”, Psychometrika, vol. 41,4
YOUNG F. W. (1981), “Quantitative Analysis of Qualitative Data”, Psychometrika, vol. 46, 4. VEDALDI R. (1997), “Modelli interpretativi per la Valutazione della Cutomer Satisfaction:
l’impie-go degli strumenti statistici”, Atti del convegno SIS: La Statistica per le Imprese.
WIRTZ J., BATESON J. E. G. (1999) “Consumer Satisfaction with Service: Integrating the Environment Perspective in Service Marketing into the Traditional Disconfirmation Paradigm”,
Journal of Businness Research, vol. 44, 55-66.
ZANELLA A., CERRI M. (1999), “La misura della customer satisfaction: qualche riflessione sulla scelta delle scale di punteggio”, Atti della giornata Studio: Valutazione della Qualità e
Customer Satisfaction, Vita e Pensiero Università Cattolica, 217
ZANELLA A. (2001), “Valutazione e Modelli Interpretativi di Customer Satisfaction: Ricerca di un Quadro Complessivo”, Atti del convegno SIS “Processi e Metodi Statistici di valutazione”, vol. 1, 113.
ZANELLA A., CANTALUPPI G. (2004), Simultaneous Transformation into Interval Scales for a set of categorical variables, Statistica, vol. LXIV, n. 2, pp. 401-428.
PROCEDURE DI MISURAZIONE DELLA CUSTOMER SATISFACTION: IMPOSTAZIONI UNIDIMENSIONALE E MULTIDIMENSIONALE
Riassunto
Scopo di questo lavoro è presentare una panoramica, allo stato attuale, sui principali metodi di misurazione della Customer Satisfaction (CS), evidenziando vantaggi e limiti di ognuno. La presentazione segue una duplice impostazione: prima unidimensionale, ovvero la misurazione di un’unica variabile di sintesi della CS, che si identifica generalmente con la soddisfazione complessiva del bene prodotto o del servizio progettato; in questa parte l’attenzione è focalizzata sulle scale di misura. Successivamente si passa alla misurazione multidimensionale, che tiene conto di tutte le variabili che caratterizzano la complessità del concetto di CS; in questa seconda parte si analizzano modelli quali il SERVQUAL e i cosiddetti PLS-Path Models. Nell’ultimo paragrafo si è cercato di proporre alcune linee guida per ulteriori sviluppi della disciplina.