doi: 10.3389/fpsyg.2018.02345
Edited by: Elisa Pedroli, Istituto Auxologico Italiano (IRCCS), Italy Reviewed by: Melissa Ree, The Marian Centre, Australia María C. Fuentes, University of Valencia, Spain *Correspondence: Leonardo Carlucci [email protected]
Specialty section: This article was submitted to Quantitative Psychology and Measurement, a section of the journal Frontiers in Psychology Received: 27 April 2018 Accepted: 08 November 2018 Published: 27 November 2018 Citation: Carlucci L, Watkins MW, Sergi MR, Cataldi F, Saggino A and Balsamo M (2018) Dimensions of Anxiety, Age, and Gender: Assessing Dimensionality and Measurement Invariance of the State-Trait for Cognitive and Somatic Anxiety (STICSA) in an Italian Sample. Front. Psychol. 9:2345. doi: 10.3389/fpsyg.2018.02345
Dimensions of Anxiety, Age, and
Gender: Assessing Dimensionality
and Measurement Invariance of the
State-Trait for Cognitive and Somatic
Anxiety (STICSA) in an Italian Sample
Leonardo Carlucci1* , Marley W. Watkins2, Maria Rita Sergi1, Fedele Cataldi1,Aristide Saggino1and Michela Balsamo1
1School of Medicine and Health Sciences, G. d’Annunzio University of Chieti–Pescara, Chieti, Italy,2Department of Educational Psychology, Baylor University, Waco, TX, United States
The State–Trait Inventory for Cognitive and Somatic Anxiety (STICSA) is a widely used measure of state and trait anxiety that permits a specific assessment of cognitive and somatic anxiety. Previous research provided inconsistent findings about its factor structure in non-clinical samples (e.g., hierarchical or bi-factor structure). To date, no psychometric validation of the Italian version of the STICSA has been conducted. Our study aimed to determine the psychometric functioning of the Italian version of the STICSA, including its dimensionality, gender and age measurement equivalence, and convergent/divergent validity in a large sample of community-dwelling participants (N = 2,938; 55.9% female). Through confirmatory factor analysis, the multidimensional structure of both State and Trait STICSA scales, with each including Cognitive and Somatic dimensions, was supported. Factor structure invariance was tested and established at configural, metric, and scalar levels for males and females. Additionally, full factorial measurement invariance was supported for the State scale across young, middle age, and old adult groups whereas the Trait scale was partially invariant across age groups. The STICSA also showed good convergent validity with concurrent anxiety measures (State-Trait Anxiety Inventory and Beck Anxiety Inventory), and satisfactory internal discriminant validity with two depression measures (Teate Depression Inventory and Beck Depression Inventory-II). Results provided support for the multidimensionality of the STICSA, as well as the generalizability of the State and Trait scales as independent measures of Cognitive and Somatic symptomatology across gender in the general population. Implications for research and personality and clinical assessment are discussed.
Keywords: anxiety, depression, trait, state, invariance, multigroup confirmatory factor analysis
INTRODUCTION
Anxiety is an emotional state defined by cognitive as well as somatic symptomatology such as feelings of tension, worried thoughts, increased blood pressure, sweating, derealization, and
the anticipation of a future danger or threat (American Psychiatric Association, 2013). Anxiety
in their lives (Bandelow and Michaelis, 2015). In Italy, the
prevalence in life of anxiety disorders is close to 11% (de
Girolamo et al., 2006;Kessler et al., 2007).
The most widely documented results from psychiatric epidemiology are that anxiety symptoms develop from childhood
and persist into adulthood if not detected and treated (Regier
et al., 1990; Wittchen and Jacobi, 2005; Kessler et al., 2012;
Bandelow and Michaelis, 2015), and that females are significantly more likely than males to develop anxiety disorders throughout
the lifespan (ratio 1:2) (McLean and Anderson, 2009;McLean
et al., 2011).
Historically, there has been considerable debate regarding the dimensionality of anxiety: it was considered unidimensional by Freud (1920) but characterized with both trait and state
dimensions by contemporary researchers (Spielberger, 1985;
Endler, 1997). The modern differentiation between trait and
state anxiety has a long and controversial history (Allport and
Odbert, 1936; Carr and Kingsbury, 1938; Zuckerman, 1960, 1983; Fridhandler, 1986; Endler and Kocovski, 2001; Heeren et al., 2018). A notable amount of research differentiates, for anxiety as well as other psychological states, between transitory emotion that varies in duration and is characterized by observable symptoms (i.e., state anxiety), and an individual’s unobservable disposition to experience elevated anxiety in response to threat
(i.e., trait anxiety) (Spielberger, 1983, 1985;Endler and Kocovski,
2001;Pacheco-Unguetti et al., 2010;Heeren et al., 2018). Trait anxiety has been extensively conceptualized as a
fundamental dimension along which people differ (Allport and
Odbert, 1936;Cattell, 1946;Eysenck, 1953). According to several personality trait taxonomies, trait anxiety has been variously
theorized as negative emotionality (Tellegen, 1985), neuroticism
(Costa and MacCrae, 1992;Ashton et al., 2004), low emotional
stability (Goldberg, 1992), a risk factor for the development of
anxious symptomatology (Weems et al., 2007), and comparable
to anxiety sensitivity (Lilienfeld et al., 1993). On the other hand,
state anxiety has been viewed as an emotional state that varies in duration depending of the presence of the provocative stimulus. According to this distinction, individuals high on trait anxiety are more likely to experience episodes of state anxiety (in terms of intensity, frequency, duration) than those low on trait anxiety (Heeren et al., 2018).
Nevertheless, the state-trait distinction has been labeled as arbitrary and based on weak assumptions, such as the minor difference in instructions included in anxiety measures divided into state and trait scales (e.g., “last week” versus “generally”)
by several authors (Allen and Potkay, 1981; Zuckerman, 1983;
Luthans et al., 2007). Therefore, state and trait anxiety could be considered as only interchangeable labels, representing two interconnected components. Ultimately, a trait index can be
inferred from a state measurement (Allen and Potkay, 1981).
More recently, the distinction between cognitive and somatic
anxiety symptoms has been explored (Steptoe and Kearsley,
1990; Ree et al., 2008; Waechter and Stolz, 2015). Clinical investigators have long considered the symptoms of anxiety to be phenomenologically heterogeneous and involving a wide
array of physical, emotional, and cognitive components (Buss,
1962; Schalling et al., 1975; Steptoe and Kearsley, 1990).
For example, anxiety was seen to involve somatic symptoms such as hyperventilation, sweating, and trembling as well as cognitive symptoms such as worry, intrusive thoughts, and
lack of concentration (Ree et al., 2008). This cognitive/somatic
distinction might better encompass all aspects included in the construct of anxiety and might allow treatment to be tailored for the predominant modality of anxiety experienced (e.g., cognitively orientated meditation versus self-instructional
training with physiologically orientated relaxation) (Steptoe and
Kearsley, 1990). Another controversial issue regarding anxiety
is the overlap between anxiety and depression (Flint, 2005;
Wetherell and Gatz, 2005;Bryant et al., 2008).
A considerable amount of research has emphasized that anxiety and depression share a common component of general distress in addition to components specific to each disorder (Clark and Watson, 1991; Watson et al., 1995a,b; Smoller and Tsuang, 1998; Costello et al., 2003; Hasler et al., 2004;
Godfrey et al., 2005; Shafer, 2006; Ree et al., 2008). This finding was not surprising given the high comorbidity between
anxiety and depression mood disorders (Watson et al., 1995a,b;
Costello et al., 2003; Godfrey et al., 2005). In line with the
tripartite model (Clark and Watson, 1991), aversive emotional
states (fear, anger, guilt) are associated with both anxiety and depression; the lack of positive affect (feeling tired) is associated with depression whereas physiological hyperarousal (trembling,
dizziness, shaking) with anxiety (Beck et al., 1988; Clark and
Watson, 1991;Watson et al., 1995a,b).
Assessment of Anxiety
Given the hypothetical multidimensional nature of anxiety and its manifold symptomatic manifestations, the assessment of anxiety represents a challenge for clinicians and researchers.
STAI
The most widely used self-rating measure for measuring anxiety
in its trait and state components isSpielberger (1983)State-Trait
Anxiety Inventory (STAI), but recent studies have raised doubts
about the anxiety construct as measured by the STAI (Bieling
et al., 1998;Caci et al., 2003;Bados et al., 2010;Balsamo et al., 2013c;Hill et al., 2013). According to these authors, the STAI can best be conceptualized as assessing negative affect, rather than a pure measure of anxiety. Indeed, the STAI has exhibited poor
discriminatory power between anxiety and depression (Kabacoff
et al., 1997; Bieling et al., 1998;Kennedy et al., 2001; Balsamo et al., 2013c; Bergua et al., 2016) and its scores have been more strongly correlated with a measure of depression than
a measure of anxiety (Grös et al., 2007). In addition, its use
appears to be particularly problematic among older adults, due
to its length and format (McDonald and Spielberger, 1983;
Dennis et al., 2007;Therrien and Hunsley, 2012;Balsamo et al., 2018).
STICSA
To overcome some of the issues associated with the use
of the STAI, Ree et al. (2008) developed a new measure
based on Spielberger’s (1966) conceptualization of state and
and Somatic Anxiety (STICSA). The STICSA also contains subscales measuring somatic and cognitive symptom clusters. For example, the cognitive cluster aims to capture aspects of anxiety related to thoughts (e.g., difficulty concentrating, worry, intrusive thoughts), whereas the somatic cluster aims to capture features that directly relate to physical experiences (e.g., sweating, muscle tension, palpitations). Additionally, the use of balanced scales composed by separate groupings of cognitive and somatic anxiety items potentially facilitates the differentiation of anxiety from anxiety-like symptoms (i.e., symptoms caused by a medical condition). Therefore, the STICSA differs from most extant measures of anxiety which contain an overrepresentation of cognitive (like the State-Trait Anxiety Inventory) or somatic symptoms (like the Beck Anxiety Inventory), which makes it difficult to distinguish between anxiety, mood, and medical
symptoms (Ree et al., 2008; Elwood et al., 2012; Deacy
et al., 2016). The inclusion of both trait-state and somatic-cognitive clusters might allow the STICSA to better capture the heterogeneity of symptoms associated with anxiety disorders (Watson et al., 2005).
Previous research has demonstrated that the STICSA exhibited strong psychometric properties in both clinical and
non-clinical samples of adults (Grös et al., 2007, 2010;Ree et al.,
2008;Van Dam et al., 2013;Balsamo et al., 2015b;Roberts et al.,
2016) and children (Deacy et al., 2016), as well as across African
and European American samples (Lancaster et al., 2015).
Specifically, the STICSA has demonstrated sufficient to excellent values of internal consistency for both the State
(α = 0.74–0.95) and Trait (α = 0.75–0.95) scales and test–retest
reliability for the Trait scale (r = 0.60–0.66) among young and
older adults, students, and clinical groups (Grös et al., 2007,
2010; Ree et al., 2008; Van Dam et al., 2013; Balsamo et al., 2015b; Deacy et al., 2016; Roberts et al., 2016). Concerning convergent and divergent validity, several studies revealed that STICSA, both at scale and dimension level, correlated at medium to high levels with other anxiety measures (i.e., Mood and Anxiety Symptom Questionnaire, Cognitive−Somatic Anxiety Questionnaire, avoidance measure, worry, and social anxiety) and at medium levels with depression self-report measures (i.e., Depression Anxiety Stress Scales, Beck Depression Inventory-II) (Grös et al., 2007;Ree et al., 2008). These studies highlighted the discriminant power of the STICSA, which allowed differentiation of anxiety from depression better than other anxiety measures, avoiding misdiagnosis, a fairly frequent problem in clinical
practice (Therrien and Hunsley, 2012).
The STICSA was designed to tap two correlated subscales (State and Trait), each composed of two interrelated dimensions (Cognitive and Somatic). Accordingly, it produces four scores: State Cognitive, State Somatic, Trait Cognitive, and Trait Somatic. Additionally, all four scores might be combined to produce a total anxiety score, the two state scores could be combined to produce a state anxiety score, the two trait scores could be combined to produce a trait anxiety score, the two cognitive scores could be combined to produce a cognitive anxiety score, and the two somatic scores could be combined to produce a somatic anxiety score.
Given these possible scoring schemes, the structure of the STICSA can be conceptualized in several different ways. Not all of these conceptualizations have been considered in extant research.
Ree et al. (2008)performed confirmatory factor analyses (CFA) on the trait and state scales separately among Australian students and adults, finding two correlated factors within each scale (i.e.,
cognitive and somatic). Grös et al. (2010) only examined the
trait scale among American students and also found correlated
cognitive and somatic factors. Grös et al. (2007)included both
state and trait STICA items in their analysis of responses from Canadian psychiatric patients and U.S. college students. Given that trait and state items are identical (response instructions differentiate trait items as experienced “in general” and state
items as experienced “right now”), Grös et al. (2007) allowed
item error terms to correlate and found that four correlated factors [Somatic State (SS), Somatic Trait (ST), Cognitive State (CS), and Cognitive Trait (CT)] best fit their data. However,
neither higher-order nor bifactor models were tested. Balsamo
et al. (2015b)found a similar oblique four-factor structure among older Italian adults but did not allow correlated item errors and
did not include higher-order or bifactor models.Roberts et al.
(2016)also analyzed both trait and state STICSA items (among Canadian college students) and found support for a correlated four-factor model as well as a higher-order model with a global anxiety factor and four first-order factors. However, their models did not include correlated error terms across the state-trait items
and they did not consider bifactor models. In contrast,Lancaster
et al. (2015)did not find support for the oblique four-factor model among African American and European American university
students. Unfortunately,Lancaster et al. (2015)failed to test other
potential structural models.
Given the lack of clarity about the factor structure of the STICSA, the current study aimed to address evidence for the dimensionality of the STICSA on a large cross-age sample. Through a confirmatory methodology, we tested all the STICSA factor structure models found in the literature (hierarchical, bifactor, four-factor, and two factors models), to evaluate which model best represent the anxiety construct as conceptualized by this instrument.
Another unaddressed issue associated with the psychometric functioning of the STICSA is its measurement invariance across gender and age. Although studies of gender differences in anxiety have provided support for the higher prevalence rates of anxiety symptomatology and disorders among females across the life
span, in both community and clinical samples (Lewinsohn et al.,
1998;Egger et al., 2003;Bruce et al., 2005;McLean and Anderson, 2009; McLean et al., 2011), no studies have investigated the impact of gender differences on the measurement of anxiety with the STICSA. Additionally, studies on age differences in anxiety have provided support for quantitative and qualitative differences of presentation of anxiety symptomatology in younger and older
adults (Blazer et al., 1991; Christensen et al., 1999; Balsamo
et al., 2018), but no studies had investigated the impact of age differences on the measurement of anxiety by the STICSA. Accordingly, the second aim of this study was to provide evidence of measurement invariance of the STICSA across age and gender. Lastly, convergent and divergent validity of the STICSA was
addressed to provide further evidence for the ability of STICSA scores to differentiate anxious from depressive symptoms.
MATERIALS AND METHODS
Participants
Participants were 2,983 Italian adults, including 1,667 females (55.9%) and 1,316 males (44.1%), of whom 1,780 (59.7%) were undergraduate students. The sample’s mean age was 36.26 years (SD = 20.25 years). The mean age for men was 37.94 years (SD = 20.55 years), and 34.94 years (SD = 19.93 years) for women. The mean level of education was 11.87 (SD = 3.67) years. In order to address measurement invariance across age of the STICSA State and Trait scales, the sample was split into three
age groups: 18–25 (Ntotal = 1,556;Nmale = 624,Nfemale = 932),
26–50 (Ntotal = 675; Nmale = 319, Nfemale = 356), and 51–99
(Ntota l = 743;Nmale = 366,Nfemale= 377) years. A statistically
significant association between Gender and Age groups was
found [χ(2) = 20.84, p < 0.001], suggesting how differences
between groups potentially could be influenced by the proportion of males and females across the age groups, rather than chance.
Procedure
The sample was recruited through advertisements (flyers, newspapers, and online ads) posted for established community groups (e.g., youth centers, church groups, university student associations) in Italian cities located in northern, central, and southern sections of the country. Part of the sample used here, took part in a study of anxiety, co-rumination, shame, young schema theory, personality, and eating disorders, described elsewhere (Saggino et al., 2017a;Picconi et al., 2018).
A battery of tests, randomly sequenced, was administered by a team of psychologists and researchers. Socio-demographic variables including age, gender, and education were also collected in the present study to provide a comprehensive framework of the participants’ characteristics. Given the high prevalence of individual differences in anxiety disorders, we considered
gender and age variables in the following analyses (e.g.,McLean
et al., 2011). Participants who did not complete any of the STICSA items were excluded a-priori from all analyses. Inclusion criteria were: ages from 18 to 99 years and the ability to complete self-administered questionnaires. Exclusion criteria included marked cognitive impairment, a drug abuse disorder, diagnoses of psychotic disorders, and major disorders of the central nervous system (e.g., Alzheimer’s disease, Parkinson’s disease, epilepsy). For invariance analyses, pairwise deletion was used to deal with the missing data in the age or gender variables. For all other analyses, only complete questionnaire data were used.
Study participants contributed voluntarily and anonymously, and no honorarium was given for completing the assessments. Written informed consent was obtained from all participants before starting the administration, according to the Declaration of Helsinki. The ethics committee of the Department of Psychological Sciences, Health and Territory, University of Chieti, Italy, approved the study.
Measures
State–Trait Inventory for Cognitive and Somatic Anxiety (STICSA)
The STICSA (Ree et al., 2008; for the Italian version seeBalsamo
et al., 2015b, 2016b) is a 21-item measure designed to assess cognitive (e.g., “I feel agonized over my problems,” “I think that others won’t approve of me”) and somatic (e.g., “My heart beats fast,” “My muscles are tense”) symptoms, both on Trait and State variations. In the Trait Anxiety subscale, the individual rates how often a statement is true in general (on a four-point Likert-type
scale from 1 =almost never at all to 4 = almost always), whereas in
the State Anxiety subscale, the examinee rates how she or he feels at the moment of assessment (on a four-point Likert-type scale
from 1 =not at all to 4 = very much). In total, the overall scale
is made up of four subscales: State–Somatic (SS), Trait–Somatic (TS), State–Cognitive (SC), and Trait–Cognitive (TC).
State-Trait Anxiety Inventory-Form Y (STAI-Y)
The STAI-Y (Spielberger and Gorsuch, 1983) is a self-report
anxiety behavioral instrument composed of two separate 20-item subscales that measure trait (baseline) and state (situational) anxiety, resulting from a revision of the original Form X (Spielberger et al., 1970). The STAI trait subscale measures relatively stable individual differences in anxiety proneness; i.e., differences in the tendency to experience anxiety; and the STAI state subscale measures the transitory anxiety state; i.e., subjective feelings of apprehension, tension, and worry that vary in intensity and fluctuate based on the situation. Respondents are asked to rate each item on a 4-point Likert-type scale, ranging
from 1 = almost never to 4 = almost always. The total score
ranges from 20 to 80, with higher scores indicating greater anxiety. Internal consistencies of scores on the STAI-Y ranged from good to excellent in non-clinical and clinical samples (Stanley et al., 1996;Roberts et al., 2016;Balsamo et al., 2018).
Adequate test-retest reliabilities (Stanley et al., 1996; Dennis
et al., 2007), and construct validity have emerged in several studies in older adult outpatients with a variety of psychiatric
disorders (Kabacoff et al., 1997; Dennis et al., 2007). In this
study, coefficient alphas were 0.94 (95% CI 0.932–0.948) and 0.91 (95% CI 0.896–0.921), respectively for the State and Trait subscales.
Beck Anxiety Inventory (BAI)
The BAI (Beck et al., 1988) is a self-report inventory of 21 items
with a focus on somatic symptoms of anxiety (i.e., nervousness, inability to relax) that was developed as a measure adept at discriminating between anxiety and depression. Respondents are asked to assess the degree of distress caused by these symptoms over the previous 7 days on a 4-point Likert-type scale, ranging
from 0 = not at all to 3 = severely. The total score ranges
from 0 to 63, with higher scores indicating greater anxiety. The BAI showed good internal and test–retest reliability as well as acceptable discriminative validity in samples of anxiety
patients and non-clinical older adults (Beck et al., 1988; de
Beurs et al., 1997; Diefenbach et al., 2009; Balsamo et al.,
2018). Coefficient alpha for this study was 0.95 (95% CI 0.952–
Teate Depression Inventory (TDI)
The TDI is a 21-item self-report instrument designed to assess
depressive symptoms (Balsamo and Saggino, 2013, 2014;Balsamo
et al., 2014), as specified for major depressive disorder by the latest editions of the Diagnostic and Statistical Manual of Mental Disorders (DSM-IV-TR, DSM-5; American Psychiatric Association). It was developed via Rasch logistic analysis of responses in order to overcome inherent psychometric
weaknesses of existing measures of depression (Balsamo and
Saggino, 2007). Each item is rated on a five-point
Likert-type scale, ranging from 0 = always to 4 = never. The
TDI has exhibited strong psychometric properties in both
clinical and non-clinical samples (Balsamo et al., 2013a,c, 2014,
2015a,c, 2016a; Innamorati et al., 2013; Saggino et al., 2017b, 2018; Carlucci et al., 2018; Contardi et al., 2018). In the present sample, Cronbach’s alpha was 0.91 (95% CI 0.907– 0.917).
Beck Depression Inventory–II (BDI–II)
The BDI–II is a 21-item self-report inventory designed to assess the presence and severity of depressive symptoms,
according to DSM-IV criteria (Beck et al., 1996). Each item
is rated on a 4-point Likert-type scale ranging from 0 to 3, based on the severity of depressive symptoms over the last 2 weeks. Each item is a list of four statements arranged in increasing severity about a particular symptom of depression. The total score ranges from 0 to 63, with higher scores indicating more severe depressive symptoms. Several studies revealed high overall internal and test-retest reliability and validity for the BDI-II in undergraduates, psychiatric, and
normal older adults (Gallagher et al., 1983; Beck et al., 1996;
Dozois et al., 1998; Sprinkle et al., 2002; Titov et al., 2011). Coefficient alpha for this study was 0.83 (95% CI 0.817– 0.873).
Data Analysis
We conducted CFAs in our sample to test the eight structural models underlying items of the STICSA that have been employed
in prior studies (see Models 1–8 in Supplementary Materials)1.
Model 1 – a one-factor model, in which all items were forced
to load on a single higher order factor (Grös et al., 2007);
Model 2 – a two factor oblique model (CS-SS), in which items in the State scale loaded on either Cognitive and Somatic factors (Ree et al., 2008);
Model 3 – a two factor oblique model (CT-ST), in which items in the Trait scale loaded on either Cognitive and Somatic factors (Ree et al., 2008);
Model 4 – a two factor oblique model (S-T), in which items
loaded on either State or Trait factors (Grös et al., 2007);
Model 5 – a two factor oblique model (C-S), in which items
loaded on Cognitive or Somatic factors (Grös et al., 2007);
1A series of additional models were also tested (i.e., Orthogonal two factor: State-Trait model; higher-order and bi-factor versions of the two-factor models). These additional models were under-identified or did not reached convergence. Therefore, they were considered unreliable and not informative, so they were not included in the present study.
Model 6 – a four factor oblique model, in which the CT, ST,
CS, SS subscales were directly modeled (Grös et al., 2007;
Roberts et al., 2016);
Model 7 – a bifactor model, in which all STICSA items were forced to load both on a global anxiety factor and on 4 specific factors (CT, ST, CS, SS), corresponding to the
STICSA subscales (Roberts et al., 2016);
Model 8 – a hierarchical model, with one higher order factor and four first-order factors, the CT, ST, CS, SS.
The robust weighted least squares (WLSMV) method using a diagonal weight matrix and robust standard errors and a
mean- and variance adjusted χ2 test statistic (Muthén, 1998;
Muthén and Asparouhov, 2002; Muthén and Muthén, 2012b) was used to estimate parameters. The WLSMV is a robust estimator which does not assume normally distributed data (Brown, 2014) and seems to work well under a variety of
conditions if sample size is 200 or better (Flora and Curran, 2004;
Rhemtulla et al., 2012). FollowingGrös et al. (2007), in models 1 and 5, the error terms associated with corresponding items in the STICSA State and Trait were correlated. In these measurement models, the correlated error terms reflected a method effect (e.g., reversed/similarly worded items, acquiescence, or social
desirability) (Marsh, 1996;Brown, 2014).
Model fit was assessed with the: (a) robust WLSMV
chi-square (χ2) statistic and its degrees of freedom; (b) Tucker Lewis
Index (TLI); (c) comparative fit index (CFI); and (d) root mean square error of approximation (RMSEA) and its 90% confidence interval (90% CI). Due to the large sample size, interpretation of the robust WLSMV chi-square square as a measure of fit was eschewed. An adequate fit between the target model and the observed data would produce TLI and CFI values of 0.90 and above, while values of 0.95 and above were considered to indicate excellent fit. RMSEA values of 0.08 or less were considered to reflect an adequate fit, while values of 0.05 or less were considered
to reflect good fit (Schermelleh-Engel et al., 2003;Brown, 2014).
To examine factor structure invariance (measurement invariance) across gender and age, multigroup CFAs were
performed according to Muthén and Muthén (2012b), using
the WLSMV method and theta parameterization. Configural invariance is established when factor loadings and thresholds are free across groups, residual variances fixed at one in all groups, and factor means fixed at zero in all groups. In the metric invariance model, factor loadings are constrained to be equal across groups, residual variances fixed at one in one group and free in the other groups, and factor means fixed at zero in one group and free in the other groups. Scalar invariance models had factor loadings and thresholds constrained to be equal across groups, residual variances fixed at one in one group and free in the other groups, and factor means fixed at one in one group and free in the other groups. Given the large sample size, chi-square difference tests would be overly sensitive to even trivial differences (Little et al., 2007). Therefore,
evaluation of invariance was based on the difference (1) of CFI
and RMSEA indexes (Chen, 2007). A change of CFI ≥ -0.010
between consecutive models and a change of RMSEA ≥ 0.015
concurrent validity of test score interpretations, Pearson correlations were calculated between scores on the STICSA and scores on the STAI-Y, BAI (for the convergent validity), TDI, and BDI-II (for the discriminant validity). We also compared the STICSA and STAI pairs of correlation coefficients in the
analysis of discriminant validity following Meng et al. (1992).
This procedure involves performing a Fisher Z transformation on the correlation coefficients so that they can be compared via a t-test.
MPLUS v7 (Muthén and Muthén, 2012a) was used for the
confirmatory factor analyses, SPSS V.22 (Corp, 2013) was used
for all descriptives, correlations, and alpha reliability coefficients.
Also, R Statistic for hierarchical McDonald omega (hω) was
used to estimate the reliability of the state and trait STICSA scales, since it is more accurate than coefficient alpha in
multidimensional measures (Zinbarg et al., 2006; McDonald,
2013).
RESULTS
Confirmatory Factor Analysis
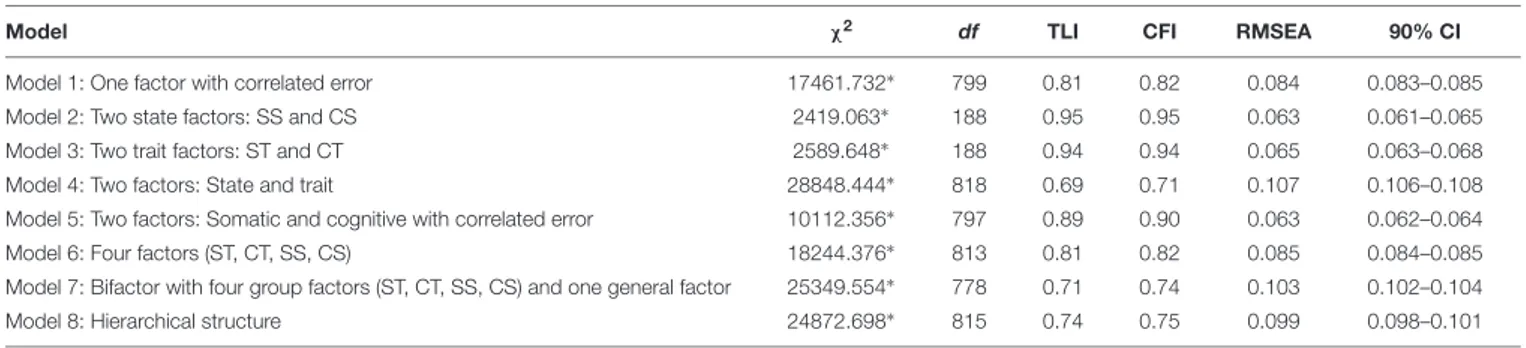
As expected, due to the large sample size, the chi-squared index was found to be significant for all models. However, only models 2 and 3 exhibited acceptable fit to the data, suggesting that the State and Trait scale of the STICSA, with each including Cognitive and Somatic dimensions well represented our STICSA Italian adaptation structure (see Table 1). The degree of relationship
(standardized λ weights) for each item with its correspondent
first-order factors were all significant (p< 0.001) in these two
models (see Supplementary Table 1).
In Model 2, the STICSA State scale item loadings on the SS-CS factors ranged from 0.55 to 0.88, with an average standardized factor loading of 0.73. Squared multiple correlations ranged from 0.30 to 0.78, with an average SMC of 0.54 indicating that, on average, 29% of the variance in observed variables was accounted for by latent factors. The latent factor correlations were high (0.73). In Model 3, the standardized factor loadings of the STICSA Trait items ranged from 0.49 to 0.79 for the CT-ST factors, with an average standardized factor loading of 0.67. Squared multiple correlations ranged from 0.25 to 0.64, with
an average SMC of 0.46 indicating that, on average, 21% of the variance in observed variables was accounted for by latent factors. The latent factor correlations were high (75). In terms of local misfit, a careful inspection of the modification index did not suggested a respecification of either Model 2 or Model 3.
Multigroup CFA
Tests of measurement invariance across gender and age were examined through a multiple-group confirmatory factor analysis. Based on the previous findings, Models 2 and 3 were used as baseline models and tested for the data fit across: (a) male versus female groups for the first comparison and (b) age groups (18– 25; 26–50; 51–99 years) for the second comparison. Following
the (Muthén and Muthén, 2012b, p. 545) sequential procedures
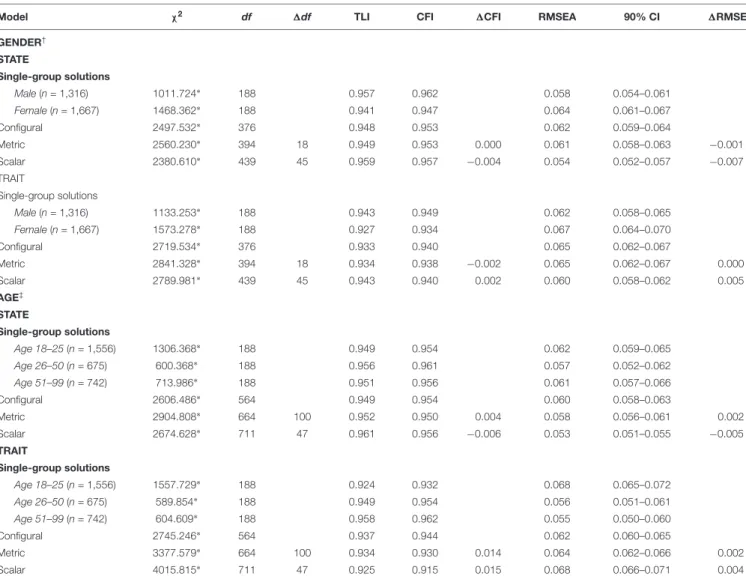
in each comparison, the fit of Models 2 and 3 were first tested separately in groups. Then, restrictive models were used to test for equal form (configural invariance), equal factor loadings (metric invariance), and equal indicator thresholds and residual variances (scalar invariance). Results of these measurement invariance analyses are presented in Table 2.
Configural, metric, and scalar invariance was demonstrated
across male and female groups. As seen in Table 2, the1CFI
were lower than |0.010| and RMSEA were lower than |0.015| for all the comparisons, therefore the assumption of equal factor loadings and indicator thresholds in males and females group
were confirmed for Models 2 and 3. However, theχ2difference
between all models tested was found to be significant (p< 0.001),
both at State (Model 2) and at Trait (Model 3) scale of STICSA. For age groups, measurement invariance was found for Models 2 and 3 in each of the three groups, separately. Subsequently, the adequacy of the same models was examined through the amount of configural, metric, and scalar invariance simultaneously in the three age groups (18–25; 26–50; 51– 99 years old). Fit indices in general supported an adequate model fit for configural, metric, and scalar invariance across age for Model 2 (State scale of STICSA, with Cognitive and Somatic subscales). Configural invariance was also established for Model 3 across the three age groups. Fit indices showed that significant differences across the age groups were found on factor loadings, item thresholds, and residual levels for
Model 3. All 1CFI were greater than |0.01| cut-off criteria;
TABLE 1 | Fit indices for the structural models tested (N = 2,983).
Model χ2 df TLI CFI RMSEA 90% CI
Model 1: One factor with correlated error 17461.732∗
799 0.81 0.82 0.084 0.083–0.085
Model 2: Two state factors: SS and CS 2419.063∗
188 0.95 0.95 0.063 0.061–0.065
Model 3: Two trait factors: ST and CT 2589.648∗
188 0.94 0.94 0.065 0.063–0.068
Model 4: Two factors: State and trait 28848.444∗
818 0.69 0.71 0.107 0.106–0.108
Model 5: Two factors: Somatic and cognitive with correlated error 10112.356∗
797 0.89 0.90 0.063 0.062–0.064
Model 6: Four factors (ST, CT, SS, CS) 18244.376∗
813 0.81 0.82 0.085 0.084–0.085
Model 7: Bifactor with four group factors (ST, CT, SS, CS) and one general factor 25349.554∗
778 0.71 0.74 0.103 0.102–0.104
Model 8: Hierarchical structure 24872.698∗
815 0.74 0.75 0.099 0.098–0.101
∗
p< 0.001. Model 7-8: (Roberts et al., 2016); Model 2-3: (Ree et al., 2008); Model 4-5-1: (Grös et al., 2007).
ST, STICSA somatic trait; CT, STICSA cognitive trait; SS, STICSA somatic state; CS, STICSA cognitive state; df, degrees of freedom; TLI, tucker lewis index; CFI, comparative fit index; RMSEA, root-mean-square error of approximation; 90% CI, 90% confidence interval of RMSEA.
TABLE 2 | Tests of measurement invariance across gender and age.
Model χ2 df 1df TLI CFI 1CFI RMSEA 90% CI 1RMSEA
GENDER† STATE Single-group solutions Male (n = 1,316) 1011.724∗ 188 0.957 0.962 0.058 0.054–0.061 Female (n = 1,667) 1468.362∗ 188 0.941 0.947 0.064 0.061–0.067 Configural 2497.532∗ 376 0.948 0.953 0.062 0.059–0.064 Metric 2560.230∗ 394 18 0.949 0.953 0.000 0.061 0.058–0.063 −0.001 Scalar 2380.610∗ 439 45 0.959 0.957 −0.004 0.054 0.052–0.057 −0.007 TRAIT Single-group solutions Male (n = 1,316) 1133.253∗ 188 0.943 0.949 0.062 0.058–0.065 Female (n = 1,667) 1573.278∗ 188 0.927 0.934 0.067 0.064–0.070 Configural 2719.534∗ 376 0.933 0.940 0.065 0.062–0.067 Metric 2841.328∗ 394 18 0.934 0.938 −0.002 0.065 0.062–0.067 0.000 Scalar 2789.981∗ 439 45 0.943 0.940 0.002 0.060 0.058–0.062 0.005 AGE‡ STATE Single-group solutions Age 18–25 (n = 1,556) 1306.368∗ 188 0.949 0.954 0.062 0.059–0.065 Age 26–50 (n = 675) 600.368∗ 188 0.956 0.961 0.057 0.052–0.062 Age 51–99 (n = 742) 713.986∗ 188 0.951 0.956 0.061 0.057–0.066 Configural 2606.486∗ 564 0.949 0.954 0.060 0.058–0.063 Metric 2904.808∗ 664 100 0.952 0.950 0.004 0.058 0.056–0.061 0.002 Scalar 2674.628∗ 711 47 0.961 0.956 −0.006 0.053 0.051–0.055 −0.005 TRAIT Single-group solutions Age 18–25 (n = 1,556) 1557.729∗ 188 0.924 0.932 0.068 0.065–0.072 Age 26–50 (n = 675) 589.854∗ 188 0.949 0.954 0.056 0.051–0.061 Age 51–99 (n = 742) 604.609∗ 188 0.958 0.962 0.055 0.050–0.060 Configural 2745.246∗ 564 0.937 0.944 0.062 0.060–0.065 Metric 3377.579∗ 664 100 0.934 0.930 0.014 0.064 0.062–0.066 0.002 Scalar 4015.815∗ 711 47 0.925 0.915 0.015 0.068 0.066–0.071 0.004
df, degrees of freedom; TLI, tucker lewis index; CFI, comparative fit index; RMSEA, root-mean-square error of approximation; 90% CI = 90% confidence interval of RMSEA.
∗ p< 0.001. †N = 2,983.
‡N = 2,974, from the total sample we excluded nine cases with missing values in age variable.
therefore, metric and scalar invariance between the age groups was not confirmed for model 3. A careful inspection of modification index (MI) revealed that the factor loadings of items 10–11 and 20, respectively, for the first (18–25 years) and third age group (51–99 years), differed significantly between groups.
Descriptives and Concurrent Validity
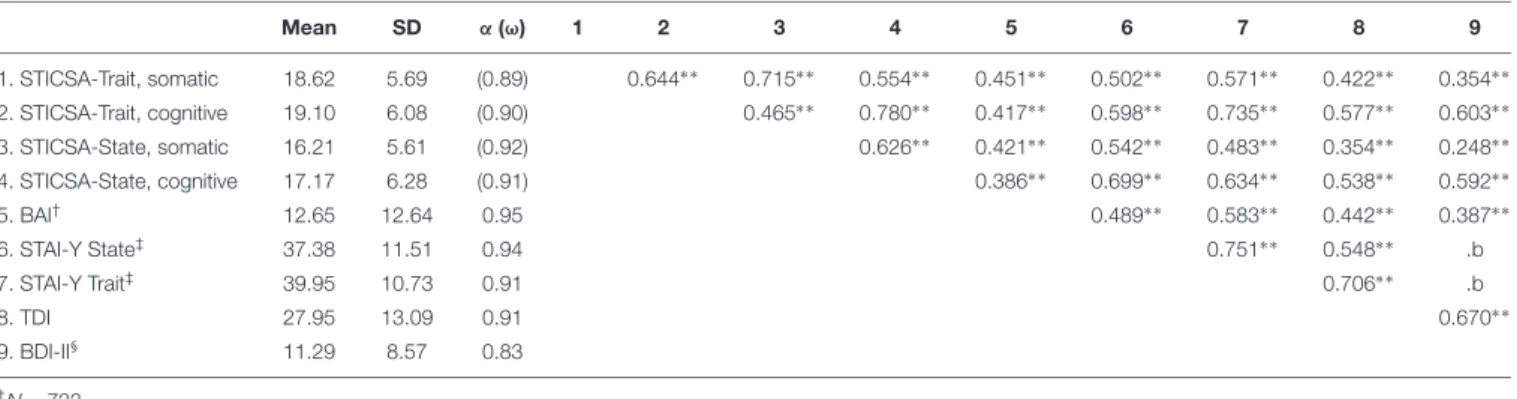
Means, standard deviations, correlations, and internal
consistency are reported in Table 3. The reliability estimates
for the STICSA subscale were high, withω coefficients of 0.96
and 0.94, respectively, for State and Trait total scores. In order to investigate the concurrent and discriminant validity of the STICSA, one-tailed correlations among the STICSA dimensions with other measure of anxiety and measures of depression were computed (Table 3).
Convergent Validity
As expected, all the STICSA scales were highly inter-correlated
(ranged from r = 0.916 to r = 0.465, p < 0.001, respectively,
for STICSA Trait Somatic and STICSA Trait Cognitive). Additionally, STICSA Trait and State scale dimensions were medium to highly correlated with the STAI-Y scales (from
r = 0.502 to r = 0.699, p< 0.001, and from r = 0.483 to r = 0.735,
p < 0.001, respectively, for STAI-State and STAI-Trait), but
moderately correlated with BAI total scores (from r = 0.386, to
r = 0.417, p< 0.001, respectively, for STICSA State Cognitive and
STICSA Trait Cognitive).
Discriminant Validity
All anxiety dimensions used in this study correlated moderately with depression measures. Notably, the Somatic subscale of the Trait STICSA was correlated with depression measures
TABLE 3 | Descriptives, correlations and reliabilities. Mean SD α (ω) 1 2 3 4 5 6 7 8 9 1. STICSA-Trait, somatic 18.62 5.69 (0.89) 0.644∗ ∗ 0.715∗ ∗ 0.554∗ ∗ 0.451∗ ∗ 0.502∗ ∗ 0.571∗ ∗ 0.422∗ ∗ 0.354∗ ∗ 2. STICSA-Trait, cognitive 19.10 6.08 (0.90) 0.465∗ ∗ 0.780∗ ∗ 0.417∗ ∗ 0.598∗ ∗ 0.735∗ ∗ 0.577∗ ∗ 0.603∗ ∗ 3. STICSA-State, somatic 16.21 5.61 (0.92) 0.626∗ ∗ 0.421∗ ∗ 0.542∗ ∗ 0.483∗ ∗ 0.354∗ ∗ 0.248∗ ∗ 4. STICSA-State, cognitive 17.17 6.28 (0.91) 0.386∗ ∗ 0.699∗ ∗ 0.634∗ ∗ 0.538∗ ∗ 0.592∗ ∗ 5. BAI† 12.65 12.64 0.95 0.489∗ ∗ 0.583∗ ∗ 0.442∗ ∗ 0.387∗ ∗ 6. STAI-Y State‡ 37.38 11.51 0.94 0.751∗ ∗ 0.548∗ ∗ .b 7. STAI-Y Trait‡ 39.95 10.73 0.91 0.706∗ ∗ .b 8. TDI 27.95 13.09 0.91 0.670∗ ∗ 9. BDI-II§ 11.29 8.57 0.83 †N = 722. ‡N = 444. §N = 278.
.b Cannot be computed because there are not enough subjects who completed the BDI-II scale. ∗ ∗
p< 0.001 (one-tailed).
STICSA, state-trait inventory for cognitive and somatic anxiety; BAI, beck anxiety inventory; STAI-Y, state-trait anxiety inventory – form Y; TDI, teate depression inventory; BDI-II, beck depression inventory-II.
(rTDI = 0.422, rBDI−II = 0.354; p < 0.001); as well as the
Somatic subscale of the State scale (rTDI= 0.354,rBDI−II= 0.248;
p< 0.001). No correlations were computed between the
STAI-Y and the BDI-II, given the low number of participants who completed the BDI-II.
Subsequently, correlation coefficients between the STICSA State and Trait dimensions and STAI Trait and State anxiety
and the TDI depression were statistically compared (Meng et al.,
1992). Comparisons revealed that the STAI Trait correlated more
highly with TDI scores than with STICSA Trait somatic, and cognitive subscales [t(441)= 9.09,p< 0.01, Z = 8.38; t(441)= 5.29,
p< 0.01, Z = 5.12, respectively]. Similarly, the STAI State scale
correlated more highly with TDI scores than with STICSA-State
somatic subscale scores [t(441)= 5.10, p< 0.01, Z = 4.93]. No
differences were found between the STAI State and STICSA
State cognitive with the TDI [t(441)= 0.33, p =0 .37, Z = 0.33,
respectively]. These results, in line with previous research (Grös
et al., 2007), indicated that the STICSA State somatic, Trait scale, and cognitive and somatic subscales were better measures of anxiety than depression.
DISCUSSION
The STICSA was developed to overcome the psychometric weakness of existing instruments of anxiety based on the distinction between trait and state anxiety (i.e., the STAI), such as
their extensive overlap with depression (Caci et al., 2003;Balsamo
et al., 2013c; Roberts et al., 2016). Even though the STICSA State and Trait scale and subscales have exhibited high internal consistency reliability, as well as construct consistent correlations
in patients, controls, and community groups (Grös et al., 2007;
Ree et al., 2008;Van Dam et al., 2013), no consensus was found in
the literature about the factor structure of the STICSA (Ree et al.,
2008;Lancaster et al., 2015;Roberts et al., 2016).
The present study, firstly, provided further evidence that scores from the Italian adaptation of the STICSA were reliable and valid measures of multidimensional (cognitive and somatic)
anxiety in a non-clinical population. Consistent with some previous research, the confirmatory factor analysis confirmed the STICSA factor structure of the Trait and State scales as separate
measures of anxiety (Ree et al., 2000, 2008;Deacy et al., 2016).
Each of the State and Trait forms was composed of two latent and correlated factors, thereby lending support to the distinction between cognitive and somatic aspects of anxiety. No support was found for the hierarchical and bifactor model of the STICSA scores with a global anxiety factor and four specific factors corresponding to the four subscales of the STICSA (trait/state;
cognitive/somatic) (Roberts et al., 2016), nor for an oblique
four-factor model of STICSA scores with factors corresponding to the somatic and cognitive subscales of the state and trait versions of the STICSA previously found in an elderly population (Balsamo et al., 2015b). This result was not in accordance with the increasing number of studies which have supported a bifactor
structure for psychopathological scales (Al-Turkait and Ohaeri,
2010; Kriston et al., 2012; Saggino et al., 2018; Wang et al., 2018).
The second aim of the study was to assess the measurement equivalence of the STICSA scores across males and females, and across young, middle age, and older adult samples in order to determine whether scores between these groups could be interpreted with confidence. For gender comparisons, results indicated that the STICSA State and Trait scale items showed the same consistency in factor structure across male and female respondents. Given the empirical evidence that females have demonstrated greater negative affectivity (such as trait anxiety) and higher rates of anxiety disorders and
symptomatology (Kessler et al., 1994;Breslau et al., 2000) than
men across the life span (Lewinsohn et al., 1998; McLean
et al., 2011), this finding appears to be interesting since the STICSA factor structure it was found invariant across gender in this study. Full measurement invariance across gender suggested that the proposed factor structure, pattern of factor loadings, and thresholds of STICSA State and Trait scales were similar for males and female respondents in this study. Therefore, STICSA State and Trait scores appear
to reflect true gender differences in anxiety constructs and can be
used interchangeably in males and females (Brown, 2014).
Concerning age, only the STICSA State scale was found to be invariant at the configural, metric, and scalar levels. Metric and scalar measurement equivalence was not found across age groups for the STICSA Trait scale. There is a general consensus in the literature on the impact of age in
developing anxious symptomatology (Christensen et al., 1999;
Balsamo et al., 2018). The nature of the anxiety experienced by older individuals may differ qualitatively from younger ones. For instance, older people reported greater ability to
control their emotions (Lawton et al., 1993) and greater level of
worry about health; whereas younger adults experienced worry about finances and family and tended to report more negative affect.
In our sample, younger, middle-aged, and older adult groups interpreted and responded to the Trait scale of the STICSA with significant variability between them. They differed significantly about how much of the latent trait was required to endorse an item. Great age-variability was found across items that assess somatic conditions (“Butterflies in the stomach”), and cognitive process (“Can’t get thoughts out of mind” and “Trouble remembering things”). Given these age differences, clinicians might misrepresent cognitive and somatic symptomatology or over/underestimate the magnitude of state anxiety reactions
under stressful circumstances across gender groups (Ree et al.,
2008). Therefore, future research should examine in detail
the capacity of these items in discriminating trait anxiety across age.
In line with previous research, all the STICSA Trait and State scores of the Cognitive and Somatic scales were
highly inter-correlated (Ree et al., 2000, 2008; Grös et al.,
2007; Balsamo et al., 2015b; Roberts et al., 2016). The STICSA showed good convergent validity with the STAI, moderate convergent validity with the BAI, and satisfactory discriminant validity with the TDI and the BDI-II. In line
with the Clark and Watson (1991) tripartite model, our
results suggested that anxiety and depression shared a non-specific component of generalized distress (negative affect). In addition, STICSA State and Trait measures of Cognitive and Somatic symptoms were more specific to anxiety (i.e., physiological hyperarousal) than depression compared to the STAI. Similarly, the moderate to strong correlations between STICSA (and its subscale) scores and concurrent measures of anxiety in this study provided further evidence of STICSA
scales as a pure measure of anxiety (Innamorati et al.,
2013).
Limitations of the present study included the characteristics of our sample and the specific measures selected for the
validity analyses. The use of a convenience sample, composed of non-clinical participants (mostly undergraduate students),
potentially limits the generalizability of this study (Peterson
and Merunka, 2014). Additionally, the inclusion of student data in research might have introduced uncontrolled systematic
variance components (Balsamo, 2010, 2013; Balsamo et al.,
2013b; Innamorati et al., 2014). As the specific measures selected for the validity analyses the STICSA was investigated exclusively in relation to a measure of general anxiety (i.e., BAI), neglecting measures of specific anxiety disorder (i.e., Panic Attack and Anticipatory Anxiety Scale; the Anxiety Sensitivity Index). Another limitation was reliance on unbalance samples to perform the correlation analyses between the measures. This is, partially, due to the sample recruitment strategy. Further studies could address the issue of comorbidity in clinical samples, controlling the STICSA State and Trait scale scores for depression (i.e., MIMIC models) or including depression as a covariate in regression models.
Regardless of these limitations, the current study
demonstrated that STICSA scores are psychometrically reliable and valid measures that discriminated anxiety from depression in a non-clinical Italian population. The ability of STICSA to distinguish State and Trait dimensions of Cognitive and Somatic anxiety could provide a helpful opportunity for clinicians to: (a) perform an accurate differential diagnosis (e.g., discriminating anxiety from somatic symptomatology in oncology and geriatrics as well as in medical conditions); (b) promote recognition and effective treatment of anxiety disorders and comorbid disorders; (c) prove the efficacy of certain treatments in reducing specific anxiety symptoms. Future research should examine this discriminant power in association with specific symptoms of anxiety.
AUTHOR CONTRIBUTIONS
LC and MB designed the study and conducted the statistical analyses. LC, MW, AS, and MB interpreted the data. LC, MB, and MW drafted the manuscript. MS and FC recruited the sample and collaborated in editing the final manuscript. All authors contributed toward data analysis, drafting and revising the paper, and agreed to be accountable for all aspects of the work.
SUPPLEMENTARY MATERIAL
The Supplementary Material for this article can be found
online at: https://www.frontiersin.org/articles/10.3389/fpsyg.
2018.02345/full#supplementary-material
REFERENCES
Allen, B. P., and Potkay, C. R. (1981). On the arbitrary distinction between states and traits.J. Pers. Soc. Psychol. 41, 916–928. doi: 10.1037/0022-3514.41.5.916 Allport, G. W., and Odbert, H. S. (1936). Trait-names: a psycho-lexical study.
Psychol. Monogr. 47:i-171. doi: 10.1037/h0093360
Al-Turkait, F. A., and Ohaeri, J. U. (2010). Dimensional and hierarchical models of depression using the Beck Depression Inventory-II in an Arab college student sample.BMC Psychiatry 10:60. doi: 10.1186/1471-244X-10-60
American Psychiatric Association (2013).Diagnostic and Statistical Manual of Mental Disorders (DSM-5). Washington, DC: American Psychiatric Pub. doi: 10.1176/appi.books.9780890425596
Ashton, M. C., Lee, K., Perugini, M., Szarota, P., De Vries, R. E., Di Blas, L., et al. (2004). A six-factor structure of personality-descriptive adjectives: solutions from psycholexical studies in seven languages.J. Pers. Soc. Psychol. 86, 356–366. doi: 10.1037/0022-3514.86.2.356
Bados, A., Gómez-Benito, J., and Balaguer, G. (2010). The state-trait anxiety inventory, trait version: does it really measure anxiety? J. Pers. Assess. 92, 560–567. doi: 10.1080/00223891.2010.513295
Balsamo, M. (2010). Anger and depression: evidence of a possible mediating role for rumination.Psychol. Rep. 106, 3–12. doi: 10.2466/PR0.106.1.3-12 Balsamo, M. (2013). Personality and depression: evidence of a possible mediating
role for anger trait in the relationship between cooperativeness and depression. Compr. Psychiatry 54, 46–52. doi: 10.1016/j.comppsych.2012.05.007
Balsamo, M., Carlucci, L., Sergi, M., and Saggino, A. (2016a). Validazione della versione italiana del Co-Rumination Questionnaire [Validation of the Italian version of the Co-Rumination Questionnaire].Psicoter. Cognit. Comport. Ital. J. Cogn. Behav. Psychot. 22, 13–34.
Balsamo, M., Carlucci, L., Sergi, M. R., Romanelli, R., D’Ambrosio, I., Fairfield, B., et al. (2016b). A new measure for trait and state anxiety: the state trait inventory of cognitive and somatic anxiety (STICSA). standardization in an Italian population.Psicot. Cognit. Comport. Ital. J. Cogn. Behav. Psychot. 22, 229–232.
Balsamo, M., Carlucci, L., Sergi, M. R., Murdock, K. K., and Saggino, A. (2015a). The mediating role of early maladaptive schemas in the relation between co-rumination and depression in young adults.PLoS One 10:e0140177. doi: 10. 1371/journal.pone.0140177
Balsamo, M., Innamorati, M., Van Dam, N. T., Carlucci, L., and Saggino, A. (2015b). Measuring anxiety in the elderly: psychometric properties of the state trait inventory of cognitive and somatic anxiety (STICSA) in an elderly Italian sample. Int. Psychogeriatr. 27, 999–1008. doi: 10.1017/S1041610214 002634
Balsamo, M., Macchia, A., Carlucci, L., Picconi, L., Tommasi, M., Gilbert, P., et al. (2015c). Measurement of external shame: an inside view.J. Pers. Assess. 97, 81–89. doi: 10.1080/00223891.2014.947650
Balsamo, M., Cataldi, F., Carlucci, L., and Fairfield, B. (2018). Assessment of anxiety in older adults: a review of self-report measures.Clin. Interv. Aging 2018, 573–593. doi: 10.2147/CIA.S114100
Balsamo, M., Giampaglia, G., and Saggino, A. (2014). Building a new rasch-based self-report inventory of depression.Neuropsychiatr. Dis. Treat. 10, 153–165. doi: 10.2147/NDT.S53425
Balsamo, M., Imperatori, C., Sergi, M. R., Belvederi Murri, M., Continisio, M., Tamburello, A., et al. (2013a). Cognitive vulnerabilities and depression in young adults: an ROC curves analysis.Depress Res. Treat. 2013, 1–8. doi: 10.1155/2013/ 407602
Balsamo, M., Lauriola, M., and Saggino, A. (2013b). Work values and college major choice.Learn. Individ. Differ. 24, 110–116. doi: 10.1016/j.lindif.2012. 12.022
Balsamo, M., Romanelli, R., Innamorati, M., Ciccarese, G., Carlucci, L., and Saggino, A. (2013c). The state-trait anxiety inventory: shadows and lights on its construct validity.J. Psychopat. Behav. 35, 475–486. doi: 10.1007/s10862-013-9354-5
Balsamo, M., and Saggino, A. (2007). Test per l’assessment della depressione nel contesto italiano: un’analisi critica.Psicoter. Cognit. Comport. Ital. J. Cogn. Behav. Psychot. 13, 167–199.
Balsamo, M., and Saggino, A. (2013). Teate Depression Inventory: Manuale. Göttingen: Hogrefe.
Balsamo, M., and Saggino, A. (2014). Determining a diagnostic cut-off on the teate depression inventory.Neuropsychiatr. Dis. Treat. 10, 987–995. doi: 10.2147/ NDT.S55706
Bandelow, B., and Michaelis, S. (2015). Epidemiology of anxiety disorders in the 21st century.Dialog. Clin. Neurosci. 17, 327–335.
Beck, A., Steer, R., and Brown, G. (1996).Beck Depression Inventory-II (BDI-II). San Antonio, TX: Psychological Corporation.
Beck, A. T., Epstein, N., Brown, G., and Steer, R. A. (1988). An inventory for measuring clinical anxiety: psychometric properties.J. Consult. Clin. Psychol. 56, 893–897. doi: 10.1037/0022-006X.56.6.893
Bergua, V., Meillon, C., Potvin, O., Ritchie, K., Tzourio, C., Bouisson, J., et al. (2016). Short stai-y anxiety scales: validation and normative data for elderly subjects.Aging Ment. Health 20, 987–995. doi: 10.1080/13607863.2015.1051511
Bieling, P. J., Antony, M. M., and Swinson, R. P. (1998). The state-trait anxiety inventory, trait version: structure and content re-examined.Behav. Res. Ther. 36, 777–788. doi: 10.1016/S0005-7967(98)00023-0
Blazer, D., George, L.K., and Hughes, D. (1991). “The epidemiology of anxiety disorders: an age comparison,” in Anxiety in the Elderly: Treatment and Research, eds C. Salzman and B. D. Lebowitz (New York, NY: Pringer Publishing Co.), 17–30.
Breslau, N., Chilcoat, H. D., Peterson, E. L., and Schultz, L. R. (2000). “Gender differences in major depression,” inGender and Its Effects on Psychopathology, ed. E. Frank (Washington, DC: American Psychiatric Pub).
Brown, T. A. (2014).Confirmatory Factor Analysis for Applied Research. New York, NY: Guilford Publications.
Bruce, S. E., Yonkers, K. A., Otto, M. W., Eisen, J. L., Weisberg, R. B., Pagano, M., et al. (2005). Influence of psychiatric comorbidity on recovery and recurrence in generalized anxiety disorder, social phobia, and panic disorder: a 12-year prospective study.Am. J. Psychiatry 162, 1179–1187. doi: 10.1176/appi.ajp.162. 6.1179
Bryant, C., Jackson, H., and Ames, D. (2008). The prevalence of anxiety in older adults: methodological issues and a review of the literature.J. Affect. Disord. 109, 233–250. doi: 10.1016/j.jad.2007.11.008
Buss, A. H. (1962). Two anxiety factors in psychiatric patients.J. Abnorm. Soc. Psychol. 65, 426–427. doi: 10.1037/h0040152
Caci, H., Baylé, F. J., Dossios, C., Robert, P., and Boyer, P. (2003). The Spielberger trait anxiety inventory measures more than anxiety. Eur. Psychiatry 18, 394–400. doi: 10.1016/j.eurpsy.2003.05.003
Carlucci, L., D’Ambrosio, I., Innamorati, M., Saggino, A., and Balsamo, M. (2018). Co-rumination, anxiety, and maladaptive cognitive schemas: when friendship can hurt.Psychol. Res. Behav. Manage. 2018, 133–144. doi: 10.2147/PRBM. S144907
Carr, H., and Kingsbury, F. (1938). The concept of traits.Psychol. Rev. 45, 497–524. doi: 10.1037/h0063048
Cattell, R. B. (1946).Description and Measurement of Personality. Oxford: World Book.
Chen, F. F. (2007). Sensitivity of goodness of fit indexes to lack of measurement invariance. Struct. Equat. Model. 14, 464–504. doi: 10.1080/107055107013 01834
Christensen, H., Jorm, A., Mackinnon, A., Korten, A., Jacomb, P., Henderson, A., et al. (1999). Age differences in depression and anxiety symptoms: a structural equation modelling analysis of data from a general population sample.Psychol. Med. 29, 325–339. doi: 10.1017/S0033291798008150
Clark, L. A., and Watson, D. (1991). Tripartite model of anxiety and depression: psychometric evidence and taxonomic implications.J. Abnorm. Psychol. 100, 316–336. doi: 10.1037/0021-843X.100.3.316
Contardi, A., Imperatori, C., Amati, I., Balsamo, M., and Innamorati, M. (2018). Assessment of affect lability: psychometric properties of the ALS-18.Front. Psychol. 9:427. doi: 10.3389/fpsyg.2018.00427
Corp, I. (2013).IBM SPSS Statistics for Windows, Version 22.0. Armonk, NY: IBM Corp.
Costa, P. T., and MacCrae, R. R. (1992).Revised NEO Personality Inventory (NEO PI-R) and NEO Five-Factor Inventory (NEO-FFI): Professional Manual. Psychological Assessment Resources, Incorporated. Odessa, FL: Psychological Assessment Resources.
Costello, E. J., Mustillo, S., Erkanli, A., Keeler, G., and Angold, A. (2003). Prevalence and development of psychiatric disorders in childhood and adolescence.AMA Arch. Gen. Psychiatry 60, 837–844. doi: 10.1001/archpsyc. 60.8.837
de Beurs, E., Wilson, K. A., Chambless, D. L., Goldstein, A. J., and Feske, U. (1997). Convergent and divergent validity of the Beck Anxiety Inventory for patients with panic disorder and agoraphobia.Depress. Anxiety 6, 140–146. doi: 10.1002/(SICI)1520-6394(1997)6:4<140::AID-DA2>3.0.CO;2-G de Girolamo, G., Polidori, G., Morosini, P., Scarpino, V., Reda, V., Serra, G.,
et al. (2006). Prevalence of common mental disorders in Italy. Soc. Psychiatry Psychiatry Epidemiol. 41, 853–861. doi: 10.1007/s00127-006-0097-4
Deacy, A. D., Gayes, L. A., De Lurgio, S., and Wallace, D. P. (2016). Adaptation of the state-trait inventory for cognitive and somatic anxiety for use in children: a preliminary analysis.J. Pediatr. Psychol. 41, 1033–1043. doi: 10.1093/jpepsy/ jsw030
Dennis, R., Boddington, S., and Funnell, N. (2007). Self-report measures of anxiety: are they suitable for older adults?Aging Ment Health 11, 668–677. doi: 10.1080/ 13607860701529916
Diefenbach, G. J., Tolin, D. F., Meunier, S. A., and Gilliam, C. M. (2009). Assessment of anxiety in older home care recipients.Gerontologist 49, 141–153. doi: 10.1093/geront/gnp019
Dozois, D. J., Dobson, K. S., and Ahnberg, J. L. (1998). A psychometric evaluation of the beck depression inventory–II.Psychol. Assess. 10, 83–89. doi: 10.1037/ 1040-3590.10.2.83
Egger, H. L., Costello, J. E., and Angold, A. (2003). School refusal and psychiatric disorders: a community study. J. Am. Acad. Child Adolesc. Psychiatry 42, 797–807. doi: 10.1097/01.CHI.0000046865.56865.79
Elwood, L. S., Wolitzky-Taylor, K., and Olatunji, B. O. (2012). Measurement of anxious traits: a contemporary review and synthesis.Anxiety Stress Copin 25, 647–666. doi: 10.1080/10615806.2011.582949
Endler, N. S. (1997). Stress, Anxiety and coping: the multidimensional interaction model.Can. Psychol. 38, 136–153. doi: 10.1037/0708-5591.38.3.136
Endler, N. S., and Kocovski, N. L. (2001). State and trait anxiety revisited.J. Anxiety Disord. 15, 231–245. doi: 10.1016/S0887-6185(01)00060-3
Eysenck, H. (1953). The scientific study of personality.Br. J. Math. Stat. Psychol. 6, 44–52. doi: 10.1111/j.2044-8317.1953.tb00132.x
Flint, A. J. (2005). Anxiety and its disorders in late life: moving the field forward. Am. J. Geriatr. Psychiatry 13, 3–6. doi: 10.1097/00019442-200501000-00002 Flora, D. B., and Curran, P. J. (2004). An empirical evaluation of alternative
methods of estimation for confirmatory factor analysis with ordinal data. Psychol. Methods 9, 466–491. doi: 10.1037/1082-989X.9.4.466
Freud, S. (1920).A General Introduction to Psychoanalysis. New York, NY: Boni and Liveright. doi: 10.1037/10667-000
Fridhandler, B. M. (1986). Conceptual note on state, trait, and the state–trait distinction.J. Pers. Soc. Psychol. 50, 169–174. doi: 10.1037/0022-3514.50.1.169 Gallagher, D., Breckenridge, J., Steinmetz, J., and Thompson, L. (1983). The beck
depression inventory and research diagnostic criteria: congruence in an older population. J. Consult. Clin. Psychol. 51, 945–946. doi: 10.1037/0022-006X. 51.6.945
Godfrey, K., Yung, A., Killackey, E., Cosgrave, E., Pan Yuen, H., Stanford, C., et al. (2005). Patterns of current comorbidity in young help-seekers: implications for service planning and delivery.Australas Psychiatry 13, 379–383. doi: 10.1080/j. 1440-1665.2005.02217.x
Goldberg, L. R. (1992). The development of markers for the big-five factor structure.Psychol. Assess. 4, 26–42. doi: 10.1037/1040-3590.4.1.26
Grös, D. F., Antony, M. M., Simms, L. J., and McCabe, R. E. (2007). Psychometric properties of the state-trait inventory for cognitive and somatic anxiety (STICSA): comparison to the state-trait anxiety inventory (STAI). Psychol. Assess. 19, 369–381. doi: 10.1037/1040-3590.19.4.369
Grös, D. F., Simms, L. J., and Antony, M. M. (2010). Psychometric properties of the state-trait inventory for cognitive and somatic anxiety (STICSA) in friendship dyads.Behav. Ther. 41, 277–284. doi: 10.1016/j.beth.2009.07.001
Hasler, G., Drevets, W. C., Manji, H. K., and Charney, D. S. (2004). Discovering endophenotypes for major depression. Neuropsychopharmacoloy 29, 1765–1781. doi: 10.1038/sj.npp.1300506
Heeren, A., Bernstein, E. E., and McNally, R. J. (2018). Deconstructing trait anxiety: a network perspective.Anxiety Stress Copin 31, 262–276. doi: 10.1080/10615806. 2018.1439263
Hill, B. D., Musso, M., Jones, G. N., Pella, R. D., and Gouvier, W. D. (2013). A psychometric evaluation of the STAI-Y, BDI-II, and PAI using single and multifactorial models in young adults seeking psychoeducational evaluation. J. Psychoeduc. Assess. 31, 300–312. doi: 10.1177/0734282912462670
Innamorati, M., Lester, D., Balsamo, M., Erbuto, D., Ricci, F., Amore, M., et al. (2014). Factor validity of the beck hopelessness scale in Italian medical patients. J. Psychopat. Behav. 36, 300–307. doi: 10.1007/s10862-013-9380-3
Innamorati, M., Tamburello, S., Contardi, A., Imperatori, C., Tamburello, A., Saggino, A., et al. (2013). Psychometric properties of the attitudes toward self-revised in Italian young adults.Depress Res. Treat. 2013, 1–6. doi: 10.1155/2013/ 209216
Kabacoff, R. I., Segal, D. L., Hersen, M., and Van Hasselt, V. B. (1997). Psychometric properties and diagnostic utility of the beck anxiety inventory and the state-trait anxiety inventory with older adult psychiatric outpatients.J. Anxiety Disord. 11, 33–47. doi: 10.1016/S0887-6185(96)00033-3
Kennedy, B. L., Schwab, J. J., Morris, R. L., and Beldia, G. (2001). Assessment of state and trait anxiety in subjects with anxiety and depressive disorders. Psychiatry Q. 72, 263–276. doi: 10.1023/A:1010305200087
Kessler, R. C., Angermeyer, M., Anthony, J. C., De Graaf, R., Demyttenaere, K., Gasquet, I., et al. (2007). Lifetime prevalence and age-of-onset distributions of mental disorders in the World Health Organization’s World Mental Health Survey Initiative.World Psychiatry 6, 168–176.
Kessler, R. C., McGonagle, K. A., Zhao, S., Nelson, C. B., Hughes, M., Eshleman, S., et al. (1994). Lifetime and 12-month prevalence of DSM-III-R psychiatric disorders in the United States: results from the national comorbidity survey.Arch. Gen. Psychiatry 51, 8–19. doi: 10.1001/archpsyc.1994.039500100 08002
Kessler, R. C., Petukhova, M., Sampson, N. A., Zaslavsky, A. M., and Wittchen, H. U. (2012). Twelve-month and lifetime prevalence and lifetime morbid risk of anxiety and mood disorders in the United States.Int. J. Methods Psychiatr. Res. 21, 169–184. doi: 10.1002/mpr.1359
Kriston, L., Schäfer, J., von Wolff, A., Härter, M., and Hölzel, L. P. (2012). The latent factor structure of Young’s early maladaptive schemas: are schemas organized into domains? J. Clin. Psychol. 68, 684–698. doi: 10.1002/jclp. 21846
Lancaster, S. L., Melka, S. E., Klein, K. P., and Rodriguez, B. F. (2015). Ethnicity and anxiety: a psychometric evaluation of the STICSA.Measur. Eval. Counsel. Dev. 48, 163–176. doi: 10.1177/0748175615578757
Lawton, M. P., Kleban, M. H., and Dean, J. (1993). Affect and age: cross-sectional comparisons of structure and prevalence.Psychol. Aging 8, 165–175. doi: 10. 1037/0882-7974.8.2.165
Lewinsohn, P. M., Gotlib, I. H., Lewinsohn, M., Seeley, J. R., and Allen, N. B. (1998). Gender differences in anxiety disorders and anxiety symptoms in adolescents. J. Abnorm. Psychol. 107, 109–117. doi: 10.1037/0021-843X.107.1.109 Lilienfeld, S. O., Turner, S. M., and Jacob, R. G. (1993). Anxiety sensitivity: an
examination of theoretical and methodological issues.Adv. Behav. Res. Ther. 15, 147–183. doi: 10.1016/0146-6402(93)90019-X
Little, T. D., Card, N. A., Slegers, D. W., and Ledford, E. C. (2007). “Representing contextual effects in multiple-group MACS models,” inModeling Contextual Effects in Longitudinal Studies, eds T. D. Little, J. A. Bovaird, and N. A. Card (Mahwah, NJ, US: Lawrence Erlbaum Associates Publishers), 121–147. Luthans, F., Avolio, B. J., Avey, J. B., and Norman, S. M. (2007). Positive
psychological capital: measurement and relationship with performance and satisfaction.Pers. Psychol. 60, 541–572. doi: 10.1111/j.1744-6570.2007.00083.x Marsh, H. W. (1996). Positive and negative global self-esteem: a substantively
meaningful distinction or artifactors? J. Pers. Soc. Psychol. 70, 810–819. doi: 10.1037/0022-3514.70.4.810
McDonald, R. J., and Spielberger, C. D. (1983). Measuring anxiety in hospitalized geriatric patients.Ser. Clin. Commun. Psychol. Stress Anxiety 2, 135–143. McDonald, R. P. (2013).Test Theory: A Unified Treatment. London: Psychology
Press. doi: 10.4324/9781410601087
McLean, C. P., and Anderson, E. R. (2009). Brave men and timid women? A review of the gender differences in fear and anxiety.Clin. Psychol. Rev. 29, 496–505. doi: 10.1016/j.cpr.2009.05.003
McLean, C. P., Asnaani, A., Litz, B. T., and Hofmann, S. G. (2011). Gender differences in anxiety disorders: prevalence, course of illness, comorbidity and burden of illness.J. Psychiatr. Res. 45, 1027–1035. doi: 10.1016/j.jpsychires.2011. 03.006
Meng, X.-L., Rosenthal, R., and Rubin, D. B. (1992). Comparing correlated correlation coefficients.Psychol. Bull. 111, 172–175. doi: 10.1037/0033-2909. 111.1.172
Muthén, B., and Asparouhov, T. (2002). Latent variable analysis with categorical outcomes: Multiple-group and growth modeling in Mplus.Mplus Web Notes 4, 1–22.
Muthén, B. O. (1998).Mplus Technical Appendices. Los Angeles, CA: Muthén & Muthén 2004.
Muthén, L., and Muthén, B. (2012a).Mplus Statistical Modeling Software (Version 7). Los Angeles, CA: Muthén & Muthén.
Muthén, L. K., and Muthén, B. O. (2012b).Mplus Version 7 User’s Guide. Los Angeles, CA: Muthén & Muthén.
Pacheco-Unguetti, A. P., Acosta, A., Callejas, A., and Lupiáñez, J. (2010). Attention and anxiety: different attentional functioning under state and trait anxiety. Psychol. Sci. 21, 298–304. doi: 10.1177/0956797609359624