NOMENCLATURE Ta = Air temperature, °C
va = Air speed, m/s
φa = Air relative humidity, dimensionless Top = Operating temperature, °C Tmr = Mean radiant temperature, °C Tmrl = Local mean radiant temperature, °C Tj = Temperature of the j-th wall, °C
Fi,j = Factor of view of a j-th subject set at the i-the location of the environment, dimensionless
Sj = j-th wall surface, m2
fapi = Factor of projected area of the subject compared to the surfaces, dimensionless
Iclo = Clothing thermal resistance, clo Met = Metabolic activity, Met
PMV = Predicted Mean Vote, dimensionless PPD = Percentage of dissatisfied, dimensionless PMVm = Average Predicted Mean Vote, dimensionless a = Glass walls absorption coefficient, dimensionless I = Solar radiation incident on the glass surface, W/m2 di = distance of the point of the environment, compared to the
i-th wall, m
1. Introduction
From the beginning, man has always tried to create a thermal environment comfortable for his daily life, an environment able to guarantee him protection against the dangers represented by natural elements (wind, rain, humidity, cold or hot) as much as possible. At the beginning of the century, the idea of building air conditioning was still unknown; the only need was protecting themselves from the wind
http://dx.doi.org/10.6493/SmartSci.2015.331
Smart Control of Air Climatization System in Function on the
Values of Mean Local Radiant Temperature
Giuseppe Cannistraro
1,*,Mauro Cannistraro
2 andRoberta Restivo
11D.I.C.I.E.A.M.A – Department of Civil Engineering, Computer Science, Construction, Environmental and Applied Mathematics, University of Messina, Messina, Italy 2D.I.I.E.C.I. – Department of Electronic Engineering, Chemistry and Industrial Engineering, University of Messina, Messina, Italy * Corresponding Author / E-mail: [email protected], TEL: +39-90-397-7308, FAX: +39-90-397-7450
KEYWORDS : Air conditioning, Thermo-hygrometric comfort, Radiative exchanges, Local mean radiant temperature, Tmrl, Predicted mean vote, PMV, Percentage of dissatisfied, PPD
The hygrothermal comfort indoor conditions are defined as: those environmental conditions in which an individual exposed, expresses a state of satisfaction. These conditions cannot always be achieved anywhere in an optimal way and economically; in some cases they can be obtained only in work environments specific areas. This could be explained because of air conditioning systems designing is generally performed both on the basis of the fundamental parameters’ average values, such as temperature, velocity and relative humidity (Ta, va e φa) and derived parameters such as operating temperature and mean radiant one (Top eTmr). However, in some specific cases - large open-spaces or in case of radiating surfaces - the descriptors defining indoor comfort conditions, based on average values, do not provide the optimum values required during the air conditioning systems design phase. This is largely due to the variability of real environmental parameters values compared to the average ones taken as input in the calculation. The results obtained in previous scientific papers on the thermal comfort have been the driving element of this work. It offers a simple, original and clever way of thinking about the new domotic systems for air conditioning, based on the “local mean radiant temperature.” This is a very important parameter when one wants to analyze comfort in environments characterized by the presence of radiating surfaces, as will be seen hereinafter. In order to take into account the effects of radiative exchanges in the open-space workplace, where any occupant may find themselves in different temperature and humidity conditions, this paper proposes an action on the domotic climate control, with ducts and vents air distribution placed in different zones.
Comparisons were performed between the parameters values representing the punctual thermal comfort, with the Predicted Mean Vote PMV, in an environment marked by radiating surfaces (i.e continuous glass) and calculated with the local radiant temperature suggested in previous works, with the corresponding values obtained always varying the air speed or the air temperature inflated from the air vents, in order to achieve the optimal comfort conditions.
and cold during the harsh winter seasons together with ventilating and humidify their house during summer months.
At the beginning of the last century there was the need of conditioning living and working environments through the use of installations capable of providing an heating thermal flow during the winter, and removing the amount of surplus heat during the summer period, with a system able only to heat or cool the air without guarantee the relative humidity control, in any way.
Only at the beginning of the ‘60 new air conditioning techniques developed in the US and later in Europe. They were obtained through the temperature and relative humidity control of air inside of living and working environments. From the 60’s to the present many technologies to air conditioning in buildings have been developed. These are able to manage and monitor a wide range of meaningful thermal comfort parameters [1-16]. These technologies are now obtained with more sophisticated systems, in compliance with new regulations enacted (ISO7726 and ISO7730).
The condition of thermo-hygrometric comfort or well-being can be defined, from the psychological point of view, as the psychophysical state in which the subject expresses satisfaction with the thermal environment, or, from the thermo-sensory viewpoint, such as the condition in which the subject does not feel sensation nor of hot or cold (that is a neutral thermo-hygrometric condition), may having positive influence on our work efficiency.
In order to take into account the radiative exchanges effects in open-space workplace, where any occupant may be in different temperature and humidity conditions, this study proposes domotic intervention on the climate control system, using air ductings and air distribution vents within the various zones.
The type of installation proposed enables a locally action on the average parameters of the project -such as speed and air temperature- in order to allow individual occupants, exposed to radiative fluxes coming from the radiating surfaces, to obtain optimal comfort conditions locally, as it happens for example with air conditioning system for zones in cars.
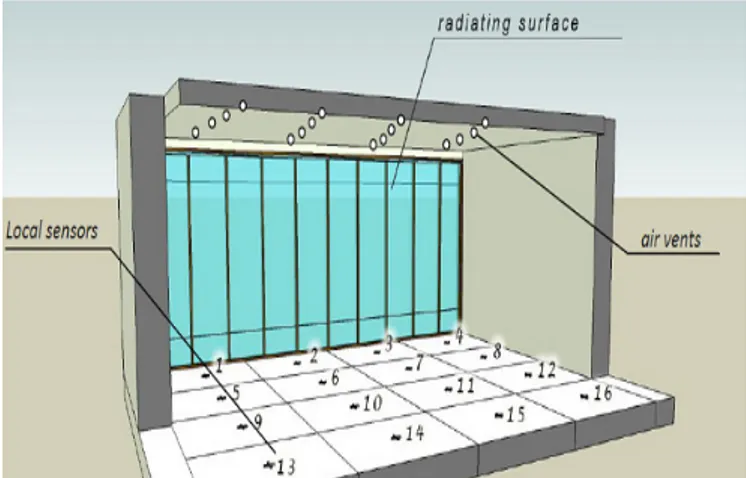
Fig. 1 Representation of the work open-space
The present study has been developed considering an open-space workplace (see Fig.1) marked by the presence of a continuous glass wall facing west, conditioned with an air system sent through air vents located at i points of the environment.
2. Calculation methodology
It known that the thermal comfort conditions inside an environment, depend on the values the basic parameters assume point by point. When you assume the average values of these parameters as inputs, you risk wrong interpretation of the local thermal situations [1-23].
In accordance with other articles on thermal comfort in open-space with large radiating surfaces [24-26], you can ensure that the radiant temperature in each point of the environment assumes different values in relation to the distance of the point from the radiating surface; consequently the average values used in the calculation programs produce Predicted Mean Vote, PMV values quite different from the average value calculated for the whole environment.
In this works, it became necessary suggesting a formula to calculate the local mean radiant temperature valid for the assessment of comfort based on the values of Predicted Mean Vote, PMV calculated in each point of the work environment.
This formula is as follows:
T
4 mrl=
∑
𝟔𝟔 𝐣𝐣=𝟏𝟏F
i,j·T
4j· S
j/d
i ________________________________________________________________∑
𝟔𝟔 𝐣𝐣=𝟏𝟏F
i,j· S
j/d
i (1) with:Tj = temperature of the j-th wall, ° C Sj = Surface j-th wall, m2
Fi,j = Factor of view of a the subject located at the point I of the environment, in relation of the j-th wall, dimensionless
di = Distance of the point of the environment, compared to the i-th wall, m
The values of the view factors Fi,j can be calculated with the equation proposed by the same author [8-9] and adopted by ISO7726, [16].
3. Analysis of the results and considerations
In the simulations obtained during summer period for the study case, it has been assumed an open-space vented with air speed va=0.15 m/sec, occupied by persons performing activity of 1 Met in standing position, with clothing thermal resistance of 0.75 clo.
For the glass wall temperatures, it has been hypothesized temperatures Tp=54, 60, 66, 70 °C, typical of summer months in the Italian places.
The local mean radiant temperature values Tmrl, Predicted Mean Vote PMV and Percentage of dissatisfied, PPD have been calculated for each point of the open-space environment. Tables 1/a and 2/a show for the working environment i-th points the values of the average temperatures radiant local, Tmrl calculated with 1) and the corresponding values of the PMV and PPD associated with them for the respective cases already said.
Tables 1/b and 2/b show Predicted Mean Vote PMV and Percentage of dissatisfied PPD values obtained by keeping the same parameters of tables 1/a and 2/a, but varying only the air velocity value from the value va=0,15 to the one va=0,25 m/s.
Graphs of Fig. 2/a and 2/b have been constructed with the values reported in Tables 2/a and 2/b showing the PMV and PPD values as function of radiant temperatures for the two local air velocity assumed as va= 0.15 m/s and va= 0.25 m/s.
Average Predicted Mean, PMVm and Average Percentage of dissatisfied, PPDm values derived from project data are shown in the graphs below. and d), are shown in Figs. 2, 3, and 4.
Fig. 2/a and 2/b show that for air speed va =0.15 m/s measured in those points with local mean radiant temperatures (Tmrl) higher than 30°C, the PMV values are higher than PMVm ones, while if the air speed is va= 0.25 m/s, the values of the PMV are halved and they assume values very close to the optimal ones. higher than PMVm ones, while if the air speed is va= 0.25 m/s, the values of the PMV are halved and they assume values very close to the optimal ones.
The Fig.3 shows that the dashed curves represent the PMV values related to the two the air speeds. That confirms that small increasing of ventilation (passing from 0,15 m/s to the values 0,25 m/s) conditions improve significantly.
The same consideration can be deduced by observing the graph of Fig.3/b, where the percentage of dissatisfied PPD, between the two curves (va=0,15 m/s end va=0,25 m/s) decreased on average from 30% to about 10%, as we you move towards the most distant points from the radiating surface.
Fig. 2/a PMV of Table 2/a and 2/b in function of Tmrl, for va=0.15 and 0.25 m/s
Fig. 2/b PPD of Table 2/a and 2/b in function of Tmrl, for va=0.15 and 0.25 m/s
Fig. 3/a PMV of Table 2/a-b in function of radiating surface distance
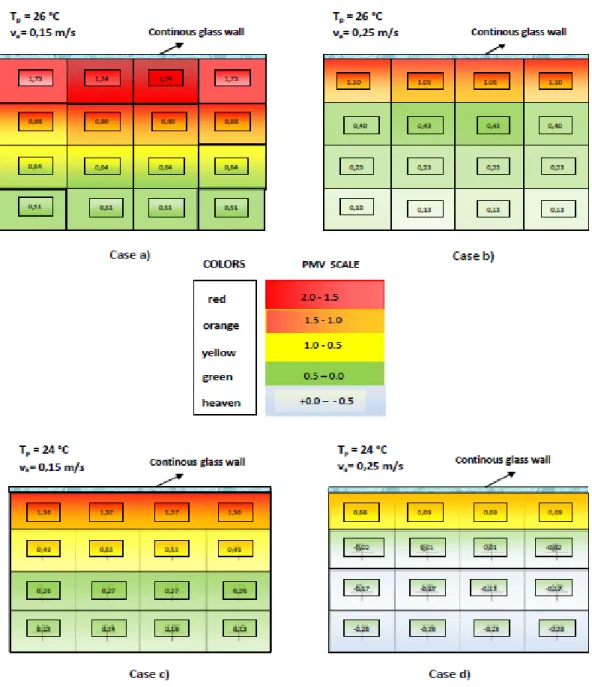
Fig. 3/b PPD of Table 2/a-b in function of radiating surface distance Fig. 4 shows the color of Predicted Mean Vote PMV values deduced in the open space environment considered, obtained with the four possible settings:
a) Air speed va = 0,15 m/s e Ta=26 °C b) Air speed va = 0,25 m/s e Ta = 26 °C
c) Air flow temperature Ta = 24 °C e va = 0,15 m/s d) Air flow temperature Ta = 24 °C e va = 0,25 m/s
The assessments performed through the four cases a), b), c) and d), ar e shown in Figs. 2, 3, and 4.
Table 1/a Air temperature values ta, mean radiant temperature tmr, PMV and PPD, standing persons M=1.0 Met, Iclo=0,75 clo, va=0.15 m/s, radiant surface Tp=54-60-66°C
i- points 1 and 4 2 and 3 5 and 8 6 and 7 9 and 12 10 and 11 13 and 16 14 and 15
ta 26,0 26,0 26,0 26,0 26,0 26,0 26,0 26,0 tmr Tp = 54 Tp = 60 Tp = 66 35,5 37.2 38.8 35.1 37.2 38.8 29.8 30.5 31.5 30.1 30.8 31.5 28,3 28.7 29.1 28,3 28.7 29.1 27,4 27.6 27.9 27,4 27.7 27.9 PMV Tp = 54 Tp = 60 Tp = 66 1,73 1,99 2,24 1,74 1.99 2,24 0,86 0,96 1,11 0,90 1,01 1,11 0,64 0,70 0,76 0,64 0,70 0,76 0,51 0,54 0,58 0,51 0,55 0,58 PPD Tp = 54 Tp = 60 Tp = 66 63 76 86 64 76 86 23 25 31 22 26 31 14 15 17 14 15 17 10 11 12 10 11 12 Table 1/b Air temperature values ta, mean radiant temperature tmr, PMV and PPD, standing persons M=1.0 Met, Iclo=0,75 clo, va=0.25 m/s,
radiant surface Tp=54- 60 -66°C
i- points 1 and 4 2 and 3 5 and 8 6 and 7 9 and 12 10 and 11 13 and 16 14 and 15
ta 26,0 26,0 26,0 26,0 26,0 26,0 26,0 26,0 tmr Tp = 54 Tp = 60 Tp = 66 35,5 37.2 38.8 35.1 37.2 38.8 29.8 30.5 31.5 30.1 30.8 31.5 28,3 28.7 29.1 28,3 28.7 29.1 27,4 27.6 27.9 27,4 27.7 27.9 PMV Tp = 54 Tp = 60 Tp = 66 1,10 1.33 1.54 1.05 1.33 1.54 0,40 0,48 0.60 0,43 0.52 0.60 0,23 0,27 0,32 0,23 0,27 0,32 0,13 0,15 0,18 0,13 0,15 0,18 PPD Tp = 54 Tp = 60 Tp = 66 31 42 53 28 42 53 8 10 13 9 11 13 6 7 7 6 7 7 5 5 6 5 5 6 Table 2/a Air temperature values ta, mean radiant temperature tmr, PMV and PPD, standing persons M=1.0 Met, Iclo=0,75 clo, va=0.15 m/s,
a=0,6 and I=400, 500 and 600 W/mq
i- points 1 and 4 2 and 3 5 and 8 6 and 7 9 and 12 10 and 11 13 and 16 14 and 15
ta 26,0 26,0 26,0 26,0 26,0 26,0 26,0 26,0 tmr I = 400 I = 500 I = 600 33,7 35.5 37.5 33.8 35.6 37.5 29,1 29.8 30.6 29,3 30,1 30.9 27.8 28,3 28.8 27,8 28,3 28.8 27,1 27,4 27.7 27,1 27,4 27.7 PMV I = 400 I = 500 I = 600 1,45 1,73 2,03 1,45 1,74 2,04 0,75 0,86 0.98 0,78 0,90 1,02 0,57 0,64 0,71 0,58 0,64 0,71 0,47 0,51 0,55 0,47 0,51 0,55 PPD I = 400 I = 500 I = 600 48 63 78 48 64 79 21 23 25 18 22 27 12 14 16 12 14 16 10 10 11 10 10 11 Table 2/b Air temperature values ta, mean radiant temperature tmr, PMV and PPD, standing persons M=1.0 Met, Iclo=0,75 clo, va=0.25 m/s,
a=0,6 and I=400, 500 and 600 W/mq
i- points 1 and 4 2 and 3 5 and 8 6 and 7 9 and 12 10 and 11 13 and 16 14 and 15
ta 26,0 26,0 26,0 26,0 26,0 26,0 26,0 26,0 tmr I = 400 I = 500 I = 600 33,7 35.5 37.5 33.8 35.6 37.5 29,1 29.8 30.6 29,3 30,1 30.9 27.8 28,3 28.8 27,8 28,3 28.8 27,1 27,4 27.7 27,1 27,4 27.7 PMV I = 400 I = 500 I = 600 0.87 1,10 1.37 0.89 1,12 1.37 0,32 0,40 0.49 0,34 0,43 0.59 0,17 0,23 0,28 0,17 0,23 0,28 0,10 0,13 0,16 0,10 0,13 0,16 PPD I = 400 I = 500 I = 600 21 31 44 22 31 44 7 8 10 7 9 11 6 6 7 6 6 7 5 5 6 5 5 6
Fig. 4 Representation of the chromatic values of Predicted Mean Vote, PMV, within the work
4. Conclusion
In presence of radiation sources of great size or intensity, radiative exchanges greatly influence the local comfort conditions; therefore the average values are not representative of the real conditions of that specific point.
The domotic climate control intervention proposed in this paper is equipped with local radiant temperature wi-fi sensors, regulating the speed of the air vents along with a system that checks the flow temperature.
The proposed installation allows to obtain in every point of the open-space object of the study the best conditions required. The
evaluations carried out through the cases a) and b) and reported in Figs. 2, 3 and 4, show that a simple intervention on the speed of the air vents, allows you to get an intelligent control system, making it economical and versatile to the dynamic needs of the environment.
In those cases when the air velocity request exceeds the regulatory restrictions, it is recommended acting on the air flow temperature, adjusting this to some degree in order to obtain optimal local conditions.
(see tab.1/a and Tab.2/a, I = 500 W/m2) (see tab.1/b and Tab.2/b, I = 500/m2)
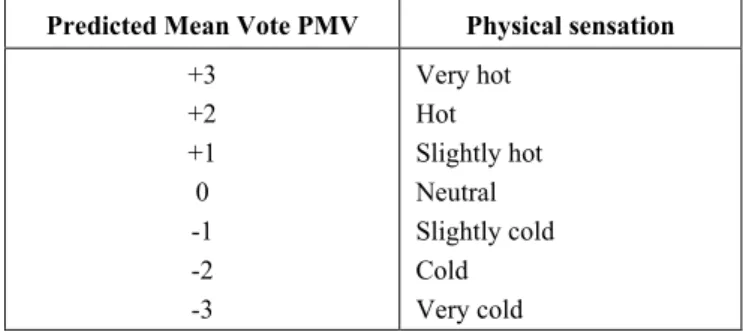
Table 3 Scale of the values of the Predictor Mean Vote, PMV and Physical sensation
Predicted Mean Vote PMV Physical sensation
+3 +2 +1 0 -1 -2 -3 Very hot Hot Slightly hot Neutral Slightly cold Cold Very cold
The adjustment of air outlet temperature from the vents is
much more complicated than the single global speed one. In
those cases illustrated in c) and d) - it could be more
appropriate decreasing the air outlet temperature (from 26°C
to 24°C) for a better management of the airflow system. If
necessary, the air velocity from the vent can be changed from
va = 0.15 m/s (case c) to va = 0.25 m/s (case d).
From visual observation of the four cases related to the
possible adjustments of the system, you can notice that in case
d) every point of the open-space environment shows optimal
comfort conditions.
REFERENCES
[1] P. O. Fanger, Thermal comfort (McGraw-Hill, New York, 1972) [2] R. Siegel and J. R. Howell, Thermal radiation heat transfer,
(McGraw-Hill, New York, 1972)
[3] B. W. Olesen, Local thermal discomfort, in Bruel & Kjaer (Technical Review, Copenhagen, 1985)
[4] F. Bonavita, P. Brunello, and R. Zecchin, “Method of calculation of form factors between the human body and the interior surfaces of an environment” Air Conditioning, 2, 217 (1989)
[5] B. W. Olesen, J. Rosendahl, L. N. Kalisperis, L. H. Summers, and M. Steinman, “Method for measuring and evaluating the thermal radiation in a room” ASHRAE transactions, 95, 1028-1044 (1989)
[6] L. N. Kalisperis, M. Steinman, and L. H. Summers, “Angle Factor graphs for a person to inclinated surfaces” ASHRAE
Transactions, 97, 809-839 (1991)
[7] L. N. Kalisperis, M. Steinman, and L. H. Summers, “Expanded research on human shape factors for inclined surfaces” Energy and Buildings, 17, 283-295 (1991) DOI: 10.1016/0378-7788(91)90011-Q
[8] G. Rizzo, G. Franzitta, and G. Cannistraro, “Algorithms for the calculation of the mean projected area factors of seated and standing persons” Energy and Buildings, 17, 221-230 (1991) DOI: 10.1016/0378-7788(91)90109-G
[9] G. Cannistraro, G. Franzitta, C. Giaconia, and G. Rizzo, “Algorithms for the calculation of the view factors between
human body and rectangular surfaces in parallelepiped environments” Energy and Buildings, 19, 51-60 (1992) DOI: 10.1016/0378-7788(92)90035-F
[10] ISO 7730, Moderate thermal environments - Determination of the PMV and PPD indices and specification of the conditions for thermal comfort (Geneva, International Organization for Standardization, 1994)
[11] G. T. Johnson, Comments on “Algorithms for the calculation of the view factors between human body and rectangular surfaces in parallelepiped environments” Energy and Buildings,
21, 79-80 (1994) DOI: 10.1016/0378-7788(94)90018-3
[12] G. Alfano, G. Rizzo, G. Cannistraro, and F. R. d'Ambrosio, “Evaluation of indoor thermal comfort conditions: Architects facing international standards,” Proc. 3rd International conference, Healthy buildings ‘94, Technical University of Budapest, pp. 305-310, August (1994)
[13] G. Alfano, G. Cannistraro, F. R. d'Ambrosio, and G. Rizzoa, “Notes on the use of the tables of standard ISO 7730 for the evaluation of the PMV index” Indoor and Built Environment, 5, 355-357 (1996) DOI: 10.1177/1420326X9600500608
[14] V. Corrado, M. Pretti, and A. Sacchi, “Routine for the calculation of angle factors between human body and car driver’s cabin,” Proc. 3rd International Conference on Vehicle Comfort and Ergonomics, ATA, pp. 421-429, March (1995) [15] V. Corrado and A. Astolfi, 52 Congresso nazionale A. T. I., Sul
calcolo puntuale della temperatura media radiante in ambienti di forma irregolare (SGE Ditoriali, 1997), pp. 111-127. [16] ISO 7726, Ergonomics of the thermal environment -
Instruments for measuring physical quantities (Geneva, International Organization for Standardization, 1998) [17] B. W. Olesen and K. C. Parsons, “Introduction to thermal
comfort standards and to the proposed new version of EN ISO 7730” Energy and Buildings, 34, 537-548 (2002) DOI: 10.1016/S0378-7788(02)00004-X
[18] F. R. d’Ambrosio Alfano, B. I. Palella, and G. Riccio, “Thermal environment assessment reliability using temperature-humidity indices” Industrial Health, 49, 95-106 (2011) DOI: 10.2486/indhealth.MS1097
[19] M. Dell’Isola, A. Frattolillo, B. I. Palella, and G. Riccio, “Influence of measurement uncertainties on the thermal environment assessment” International Journal of Thermophysics, 33, 1616-1632 (2012) DOI: 10.1007/s10765-012-1228-7
[20] E. Halawa and J. van Hoof, “The adaptive approach to thermal comfort: A criticalover view” Energy and Buildings, 51, 101-110 (2012) DOI: 10.1016/j.enbuild.2012.04.011
[21] ISO 28802, Ergonomics of the physical environment - Assessment of environments by means of an environmental survey involving physical measurements of the environment and subjective responses of people (Geneva, International Organization for Standardization, 2012)
[22] R. J. de Dear, T. Akimoto, E. A. Arens, G. Brager, C. Candido, K. W. D. Cheong, B. Li, N. Nishihara, S. C. Sekhar, S. Tanabe,
J. Toftum, H. Zhang, and Y. Zhu, “Progress in thermal comfort research over the last twenty years” Indoor Air, 23, 442-461 (2013) DOI: 10.1111/ina.12046
[23] F. R. d’Ambrosio Alfano, E. Ianniello, and B. I. Palella, “PMV-PPD and acceptability innaturally ventilated schools”
Building and Environment, 67, 129-137 (2013) DOI:
10.1016/j.buildenv.2013.05.013
[24] F. R. d’Ambrosio Alfano, B. W. Olesen, B. I. Palella, and G. Riccio, “Thermal comfort: Design and assessment for energy saving” Energy and Buildings, 81, 326-336 (2014) DOI: 10.1016/j.enbuild.2014.06.033
[25] G. Cannistraro, M. Cannistraro, R. Restivo, “Some observations on the radiative exchanges influence on thermal comfort in rectangular open-space environments” International Journal of
Heat & Tecnology, 33, 79-84 (2015) DOI: 10.18280/ijht.330213 [26] G. Cannistraro, M. Cannistraro, and R. Restivo, “The local
media radiant temperature for the calculation of comfort in areas characterized by radiant surfaces” International
Journal of Heat & Tecnology, 33, 115-122 (2015) DOI:
10.18280/ijht.330116
[27]
G. Cannistraro, M. Cannistraro, R. Restivo, and A. Cannistraro,“The role of the mean radiant temperature in the local intelligent control of heating and cooling air,” Proc. 15th National Congress CIRIAF - Environmental Footprint and Sustainable Development, April (2015),unpublished.