www.nature.com/scientificreports
SiO
2
nanoparticles modulate the
electrical activity of neuroendocrine
cells without exerting genomic
effects
C. Distasi
1, F. A. Ruffinatti
1,6,7, M. Dionisi
1, S. Antoniotti
2,6, A. Gilardino
2,6, G. Croci
2, B. Riva
1,
E. Bassino
2, G. Alberto
3,6, E. Castroflorio
4, D. Incarnato
2,5, E. Morandi
2,5, G. Martra
3,6,
S. Oliviero
2,5, L. Munaron
2,6& D. Lovisolo
2Engineered silica nanoparticles (NPs) have attracted increasing interest in several applications, and particularly in the field of nanomedicine, thanks to the high biocompatibility of this material. For their optimal and controlled use, the understanding of the mechanisms elicited by their interaction with the biological target is a prerequisite, especially when dealing with cells particularly vulnerable to environmental stimuli like neurons. Here we have combined different electrophysiological approaches (both at the single cell and at the population level) with a genomic screening in order to analyze, in GT1-7 neuroendocrine cells, the impact of SiO2 NPs (50 ± 3 nm in diameter) on electrical activity and
gene expression, providing a detailed analysis of the impact of a nanoparticle on neuronal excitability. We find that 20 µg mL−1 NPs induce depolarization of the membrane potential, with a modulation
of the firing of action potentials. Recordings of electrical activity with multielectrode arrays provide further evidence that the NPs evoke a temporary increase in firing frequency, without affecting the functional behavior on a time scale of hours. Finally, NPs incubation up to 24 hours does not induce any change in gene expression.
The fast development of nanoparticles (NPs) designed and engineered to be employed as tools for targeting to spe-cific cells and tissues and for drug delivery has opened an entire new field in both basic science and medical appli-cations. A preliminary, albeit essential, phase was devoted at addressing the concerns about their potential toxicity
in vitro and, more relevantly, in vivo. A huge amount of papers1–3 has evidenced the parameters (size, concentration,
surface properties, etc.) that can determine the presence or absence of toxic effects, thus providing the rational background for designing safe and biocompatible nanotools. The next step is to switch the focus on the more subtle effects that can arise from a prolonged presence of NPs in contact with cells, and to understand the mechanisms that underlie the interaction between objects at the nanoscale and their cellular and molecular targets. This task is particularly relevant when the target is represented by single nerve cells or by complex neuronal networks.
Engineered silica NPs have encountered a rapid diffusion in several applications in the last decade4,
specifi-cally in nanomedicine, thanks to the high biocompatibility of this material5. We have reported that amorphous
50 nm SiO2 NPs can be made fluorescent by hybridization with cyanine dyes and can be safely incorporated into
neurons6 and other cell types7. In a previous paper, we have shown that 50 nm SiO
2 NPs, at non-toxic doses, elicit
increases in the intracellular calcium concentration, [Ca2+]
i, in a neuroendocrine cell line, GT1-7 cells8. These
signals are fully dependent on calcium influx, carried through different types of calcium permeable channels, and are completely reversible even in the continuous presence of NPs. A few other papers3,9–11 have reported that
NPs of different composition can elicit changes in neuronal [Ca2+]
i. This is a relevant topic, since perturbations of 1Department of Pharmaceutical Sciences, University of Piemonte Orientale “A. Avogadro”, Novara, Italy. 2Department of Life Sciences and Systems Biology, University of Torino, Torino, Italy. 3Department of Chemistry, University of Torino, Torino, Italy. 4Center for Synaptic Neuroscience, Istituto Italiano di Tecnologia, Genova, Italy. 5Human Genetics Foundation, Torino, Italy. 6NIS Interdepartmental Center, University of Torino, Torino, Italy. 7Present address: Department of Neurosciences, University of Torino, Torino, Italy. C. Distasi and F.A. Ruffinatti contributed equally to this work. Correspondence and requests for materials should be addressed to C.D. (email: [email protected])
Received: 19 June 2017 Accepted: 15 January 2018 Published: xx xx xxxx
www.nature.com/scientificreports/
intracellular calcium homeostasis, even if reversible, can significantly affect neuronal excitability. Electrical activ-ity is the most distinctive functional feature of neuronal cells, and the issue of the potential effects of NPs on the electrical behaviour of neurons and on the ionic channels that underlie it, while still only partially investigated, has attracted increasing interest in recent years, particularly in the light of their value as tools for nanoneuromed-icine. Most of these studies deal with the effects of NPs on the properties of a specific channel (see e.g. refs12,13).
Recently, a few excellent reviews, focused on the potential medical applications of NPs14–16, have provided a
com-prehensive picture of the available knowledge about NPs and neuronal ionic channels; some of them also report the effects on action potential firing. Interestingly, both excitatory17 and inhibitory18,19 effects have been observed.
A further level of complexity that needs to be addressed stems from the finding that changes in the pattern of neuronal electrical activity may have effects on the expression of relevant genes, particularly when calcium influx is involved20,21. In the perspective of using SiO
2 NPs, both in vitro and in vivo, for applications such as drug
delivery22 or cell tracking23 in neuronal cells and tissues, it is of the outmost importance to analyze at the cellular
level the functional changes induced by the interaction with the NPs, and to investigate whether these changes have stable and long-lasting outcomes on the neuronal phenotype. We have addressed this issue by means of an integrated approach, combining patch-clamp recordings from single neuroendocrine cells and sensory neurons in culture with population recordings by means of multielectrode arrays (MEAs), spanning a time scale from early responses (min) after acute NPs application to hours. In addition, by means of a genomic approach, we have investigated the potential effects of the changes in neuronal activity on gene expression.
Results
SiO
2NPs interact with the cell membrane and are incorporated in endocytic compartments.
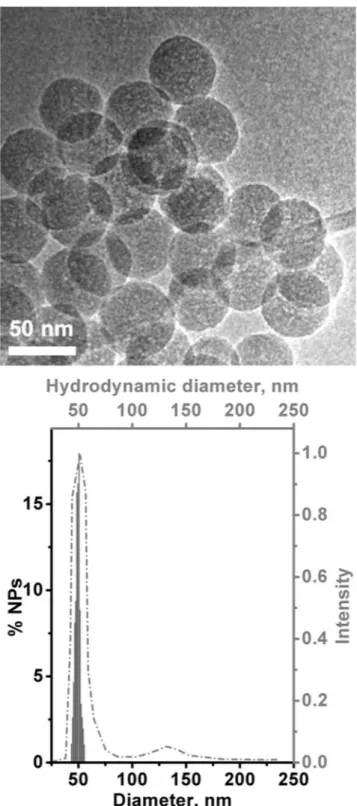
In agreement with previous studies5,6 TEM and DLS analysis (Fig. 1) indicated that the lab made SiO
2 were in the
form of nanospheres with a narrow size distribution (mean diameter 50 ± 3 nm). When suspended in water they mainly exhibited a hydrodynamic diameter similar to what observed in TEM images, indicating that they suffered a very limited aggregation.
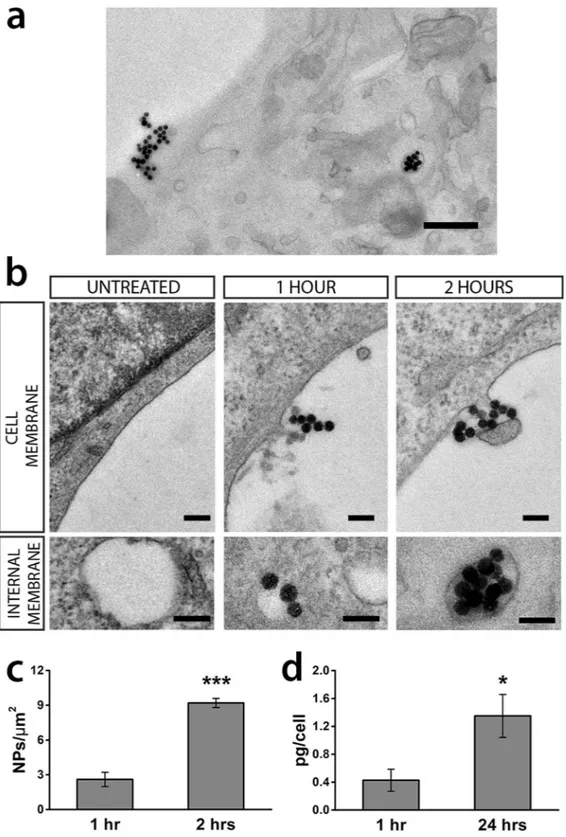
In order to analyze the distribution of nanoparticles on the cell membrane, we imaged by electron micros-copy GT1-7 cells exposed for 1 or 2 hours to 20 µg mL−1 NPs. Ultrastructural analysis (Fig. 2a,b) reveals that the
NPs were present on the plasma membrane (NP density for 1 hour treated cells: 2.60 ± 0.61 NPs µm−2; 2 hours
treated cells: 9.20 ± 0.39 NPs µm−2; Fig. 2c) suggesting that they can interact with membrane channels at times
shorter than 1 hour. Following the interaction with the plasma membrane, nanoparticles could be internalized inside the cell. Intriguingly, free nanoparticles were never imaged either in the cytoplasm of the GT1-7 cells or inside mitochondria, Golgi apparatus, endoplasmic reticulum or nucleus, but always inside membranous endocytic-like structures, indicating a possible induction of endocytosis after the interaction with the plasma membrane. A quantitative assessment of NPs incorporation in GT1-7 cells was performed by means of the ICP-MS technique (Fig. 2d). It can be seen that at 1 hour of incubation, a detectable amount of NPs could be measured (0.43 ± 0.16 pg/cell), that was significantly increased at 24 hours (1.35 ± 0.31 pg/cell).
SiO
2NPs elicit depolarizing responses in GT1-7 cells and adult mouse sensory neurons.
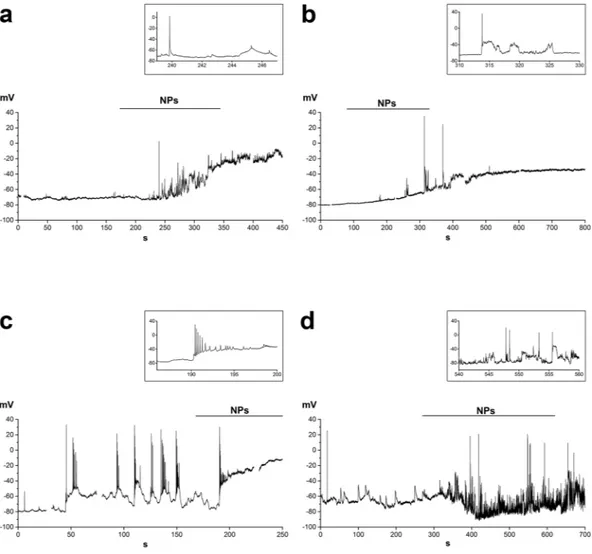
Whenbathed in physiological Tyrode solution, GT1-7 cells showed different patterns of electrical activity as recorded in patch clamp experiments, in current clamp mode. Out of 32 cells, 19 had a stable resting potential (Fig. 3a,b), 10 cells showed small oscillations (Fig. 3d); in three cells firing of full-sized action potential was detected (Fig. 3c). Average Vm was −69.7 ± 2.2 mV.
The 50 nm SiO2 NPs were used at the concentration of 20 µg mL−1, that in previous experiments had been
shown to be non-toxic6 and to elicit strong and long-lasting but reversible [Ca2+]
i oscillations7. When NPs were
added to the extracellular Tyrode solution, they elicited a depolarizing response (average ∆V = 40.1 ± 3.1 mV) in 28 out of 32 cells. In most cells, after transient firing of one or few full action potentials, the membrane potential either showed oscillatory activity with small spikes (Fig. 3a) or was stabilized at the depolarized value (Fig. 3b,c), without showing further oscillations and/or spikes, probably because of a strong inactivation of voltage depend-ent Na+ and Ca2+ channels. In two cells firing activity was markedly increased for longer times (Fig. 3d).
The depolarizing response was in general irreversible, at least for the duration of the recordings (up to 20 min). The functional state of the cells, checked by transiently switching to the voltage clamp mode and record-ing responses to voltage stimulation protocols appeared to be preserved (an example, related to the response of Fig. 3b, is shown in Supplementary Fig. S1).
In two experiments, cells were first challenged with a lower dose (0.5 µg mL−1) and subsequently with
20 µg mL−1. Supplementary Fig. S2 shows that the lower dose induced a small and reversible depolarization, while
the response to the higher one was stronger and oscillatory.
These findings were confirmed by recordings from another neuronal model, primary cultures of dorsal root gan-glion (DRG) sensory neurons from adult mice. DRG neurons had a stable resting potential of −60.7 ± 1.5 mV (n = 20), ranging from −72.0 mV to −47.0 mV. Only 30% of neurons generated sporadic spontaneous activity. In all cells chal-lenged with 20 µg mL−1 50 nm SiO
2 NPs (n = 8), we recorded a depolarizing response (average ∆V = 37.8 ± 3.0 mV,
ranging from 27.5 to 53.8 mV). In most cells, the membrane potential shifted to a depolarized value without firing any action potential, as shown in Fig. 4a. The remaining two neurons, prior to the Vm stabilization at the depolarized value,
fired one or a few action potentials in response to fast and transient Vm changes above threshold (Fig. 4b).
SiO
2NPs transiently increase the electrical activity of GT1-7 cells in long lasting recordings.
Toprovide further information on the electrical activity elicited by the NPs on a longer time scale, comparable to the duration (several hours) of the calcium imaging experiments reported in a previous paper7 and at a population
www.nature.com/scientificreports/
Full recordings sampled at 25 kHz (Fig. 5a) were filtered using a voltage threshold (see Methods) in order to extract extracellular action potential (EAP) waveforms from raw data (Fig. 5b), and build raster plots (Fig. 5c, lower) and rate histograms (Fig. 5c, upper). Rate histograms represent the time course of the firing rate and they can be used to highlight how the electrical activity clusters in time. In our experiments, both under control con-dition and in presence of NPs, GT1-7 cells exhibited a characteristic firing pattern, in which active and resting phases alternated with an irregular period ranging from 5 to 15 min (Fig. 5c). This is in good agreement with the reported behavior of GT1-7 cells described in literature24.
Figure 1. Characterization of the lab-made silica NPs. Upper: representative TEM image (original
magnification: X50k). Lower: related particle size distribution by TEM data (histogram; values on the left Y and bottom X axes) and hydrodynamic diameters by DLS in water (dashed-dotted line; values on the right Y and top X axes).
www.nature.com/scientificreports/
Over 24 different MEAs, just 7 (about 30% of the total) showed a sustained electrical activity in at least one MEA electrode. For each of these experiments, an average of 3 out of 59 electrodes (5%) recorded non-sporadic activity, resulting in a total of 21 independent long duration recordings. Half of them were silent channels under
Figure 2. Interaction with the plasmamembrane of GT1-7 cells and internalization of 50 nm SiO2 NPs. (a)
Low magnification TEM image of a GT1-7 cell with NPs on the plasmamembrane and in a vescicle (2 hours incubation). Scale bar: 500 nm. (b) After either 1 or 2 hours of incubation, small agglomerates of NPs could be observed in association with the plasmamembrane; some of them were already incorporated into endocytic vesicles. Scale bars: 100 nm. (c) NPs density obtained by TEM images at 1 and 2 hrs of incubation. Mann-Whitney U test; ***p < 0.0001 two-tailed, n = 3. (d) Quantitative assessment of internalization at 1 and 24 hours of incubation by means of ICP-MS. t-test, *p = 0.037 two-tailed, n = 4.
www.nature.com/scientificreports/
control conditions (standard physiological solution) that started to show electrical activity only after 20 µg mL−1
NPs administration (Fig. 5e, e.g. Exp7, Ch71+). Conversely, the other half presented some degree of spontaneous activity already under control conditions and the effect of NPs on these channels apparently consisted in a modu-lation of the number of EAPs recorded (Fig. 5e, e.g. Exp4, Ch82–), confirming the heterogeneity already observed in current clamp experiments.
In order to quantify the overall effects of NPs on GT1-7 firing rate, distinguishing between early and long lasting effects, we firstly decided to measure the average number of EAPs within two temporal windows of equal length (200 s), placed just before (Δtpre) and immediately after (Δtpost, Fig. 5e) NPs administration. Within these
temporal borders, active channels changed their firing rate according to Fig. 5d.
Overall, the average firing rate under control conditions (average spontaneous activity) was <fpre> = 0.014 ± 0.011 Hz, that increased to <fpost> = 0.095 ± 0.038 Hz after NPs addition. The maximum value
for GT1-7 firing rate we recorded (using a 1 min binning) was fmax = 1.02 Hz, but both fmax and <fpost> are
possi-bly underestimated because of the blind spot (about 15 seconds) in MEA recording due to medium substitution. To compare the differences in firing rate in the two conditions, a paired-samples sign test was used. The sign test is a non-parametric alternative to the paired-samples t-test and Wilcoxon signed-rank test, being our distribution of differences Δf = fpost − fpre neither normal nor symmetrical. NPs elicited a statistically significant median increase
in firing rate compared to the spontaneous electrical activity (p = 4.883·10−4 two-tailed, n = 21). Different choices
for window length (e.g. Δt = 400 s, Δt = 500 s) led to the same conclusions, even though p-values showed a clear increasing trend as window length increased (p = 0.002 for Δt = 400 s; p = 0.013 for Δt = 500 s), thus confirming the transient nature of the effect on the firing rate elicited by NPs. In particular, after about 10 min from NPs administration, this effect on GT1-7 firing rate was no more detectable in any of the channels taken into account, even if nearly half of them still showed some kind of electrical activity after 1 hour or more. The late firing rate of this portion of channels, such as their percentage respect to the total of the active channels used for the analysis, were comparable to the ones measured under control condition. A global firing rate histogram (Fig. 5f) was drawn by averaging the full rate histograms from all the 21 active channels. It shows that, after the short and early
Figure 3. Four examples of the changes in electrical activity recorded from single cells in response to
20 µg mL−1 SiO
2 NPs. Insets show expanded segments at the times indicated. Traces were blanked in
www.nature.com/scientificreports/
phase already discussed, electrical activity indeed recovered to control levels and was preserved in time, thus providing evidence that 50 nm SiO2 NPs, at the concentration of 20 µg mL−1, do not exert long lasting effects on
neuronal function. Figure 5g shows an image of the GT1-7 cells plated onto the MEAs.
Incubation with NPs up to 24 hours does not affect gene expression.
To further characterize the effect of SiO2 NPs treatment, and evaluate whether it could induce a transcriptional response, we performedRNA-Seq in GT1-7 cells at various time points following treatment with 20 µg mL−1 NPs. RNA-Seq analysis of
the samples at 30 min, 1, 6 and 24 hrs showed very high correlation (R > 0.99, Pearson Correlation Coefficient) between treated and untreated cells for the entire timescale of the analysis (Fig. 6), revealing that the SiO2 NPs do
not induce a detectable transcriptional response.
Since these experiments were performed in the absence of FBS, and since the lack of toxicity of the concen-tration of 20 µg mL−1 has been tested in a previous paper6 in the presence of 0.5% FBS, we repeated the survival
assay at 24 hours on cells cultured in DMEM without FBS. Supplementary Fig. S3 shows that also under these conditions the NPs did not affect cell survival.
Discussion
The data presented in this paper show that our nanoparticle model, 50 nm SiO2 NPs, non-toxic at the size and
concentration employed, induces fast changes in membrane potential and modulates the electrical activity of GT1-7 cells. MEAs recordings provide evidence for a transient increase in the firing rate of action potentials, without inducing long lasting alterations on the time scale of a few hrs. This is in agreement with previous obser-vations8 that the increases in [Ca2+]
i induced by the presence of these NPs were transient and reversible. These
findings are not limited to a specific experimental model. We have observed similar responses to 50 nm SiO2 NPs
with single cell recordings from primary adult neurons that have electrical properties quite different from GT1-7 cells: the latter, in varying percentages according to culture conditions, are able to generate spontaneous electrical activity, either sporadic or in bursts25; DRG neurons, on the other hand, even if representing an heterogeneous
population of different sensory cells, have a very limited and sporadic spontaneous electrical activity26. Figure 4. Current clamp recordings from mouse DRG neurons. (a,b) Two examples of changes in Vm induced
by 20 µg mL−1 SiO
www.nature.com/scientificreports/
Interestingly, ultrastructural and ICP-MS data provide evidence for an interaction with the plasma membrane followed by the activation of an endocytic process. It is of relevance that in the culture medium, NPs form very small agglomerates, as reported by dynamic light scattering (DLS) data in a previous paper8.
A very recent paper27, combining a complex set of experimental approaches with numerical simulations, has
reported that different kinds of nanoobjects (Quantum Dots, Quantum Rods, Fe2O3 NPs of different shape) elicit
an increase in electrical activity in cultured rat hippocampal neurons. The most relevant and novel findings are: i) the responses are size-and shape independent; ii) electrical charge is the crucial parameter: negative NPs adhere to the neuronal plasmamembrane, cause a depolarization and increase firing, neutral and positive ones do not; iii) NPs interact only with active neurons. While in the present paper we did not characterize the dependency of the responses from these parameters, in a previous paper we have shown that SiO2 NPs with a negative
ζ poten-tial elicited increases in [Ca2+]
i, while positively charged (aminated) ones had no effect. In the above paper, we Figure 5. MEA recordings. (a) A representative raw signal featuring many EAPs, as displayed by the acquisition
software MC_Rack (sampling frequency: 25 kHz). (b) 7 superimposed waveforms consisting of upward EAPs extracted from raw data. Each cutout extends from 1 ms before to 2 ms after the point where the signal crosses the threshold (horizontal dashed line) with a negative slope. Threshold was fixed at ± 6 standard deviations from the baseline noise. (c) A representative raster plot (lower trace) and the corresponding rate histogram (upper trace) of an active channel (the same shown in (e): Exp6, Ch43+). Bin size: 60 s. 10 spikes/bin ≈ 0.17 Hz. Dashed line is the time of NPs administration. (d) Schematic overview of the early changes induced by 20 µg mL−1 SiO
2 NPs in GT1-7 EAP rate. Table refers only to the short temporal window (Δtpre + Δtpost)
as shown in (e). (e) 8 complete raster plots (representative of 21) from the 7 experiments featuring the active channels used for the analysis. On the left side of each raster are the experiment number and the channel reference. Symbols + and − represent the direction (upward or downward respectively) of the EAPs detected. Dashed line is the time of medium change. (f) Global rate histogram resulting from the average of the rate histograms of all the 21 active units. Here, too, the dashed line is the time of medium change and NPs administration. (g) Low magnification image of GT1-7 cells pated on MEAs.
www.nature.com/scientificreports/
reported a size dependency; however the size range (50–200 nm) was broader than the range (5–75 nm) tested in ref.25. While the issue of dependency of interaction with the plasmamembrane from the negative surface charge of
NPs finds support in the data from several other laboratories (see e.g. refs28,29), the independency from size needs
further investigation. Finally our experiments show that, in both GT1–7 and DRG neurons, the firing activity is not a requisite for SiO2 NPs-neuronal membrane interaction.
The fact that electrical activity in neurons may have effects on gene transcription (the “excitation-transcription” paradigm14,15), mainly because of its link to changes in [Ca2+]
i, were the rational for carrying out the analysis of
the whole transcriptome. Interestingly, we found that the treatment with SiO2 NPs does not induce a detectable
transcriptional response at all time points analyzed, and this deserves further comments.
The issue of the effects of NPs on the target cell genome has attracted increasing interest in the last decade, the main focus being on potential genotoxic effects. Several comprehensive reviews are available30–32; in general,
evi-dence for DNA damage induced by SiO2 NPs is limited, and confined to relatively high doses (in most cases over
100 µg mL−1). Most of the reported effects are cell- and nanoparticle size specific (the smaller being in general
more genotoxic), thus requiring great caution when trying to derive general conclusions. Data based on neuronal models are more scarce, and limited to the pheochromocytoma cell line, PC12 cells. Here the reports are con-flicting: it has been found33 that 20 nm SiO
2 NPs at the concentration of 500 µg mL−1 did not alter chemokine and
NF-ĸB levels in microglial cell, but only induce a small increase in the secretion of inflammatory chemokines; the supernatant from these cells, when applied to PC12 cells, did not induce cytotoxicity nor changes in a few marker genes. On the other hand, with 50 µg mL−1 of 25 nm NPs, other Authors34 found activation of reactive oxygen
spe-cies (ROS) and aggregation of α–synuclein, a potential early Parkinsons’ Disease marker. Finally another group35,
using 20 and 50 nm NPs, report that they affect viability in a time dependent way at concentrations starting from 50 µg mL−1 for the former and from 100 µg mL−1 for the latter; both induced significant increases of ROS starting Figure 6. Lack of detectable transcriptional responses to incubation with SiO2 NPs. Scatter plot with heat
density of pairwise expression level comparison between treated and untreated (20 µg mL−1 of 50 nm SiO 2
NPs) cells at 30 minutes, 1, 6 and 24 hrs post-treatment. Gene expression values (per kb per million total reads, RPKM) in log scale. Dots indicate each gene expressed in the two samples.
www.nature.com/scientificreports/
from 25 µg mL−1. A likely explanation for these discrepancies can be based on the different sizes employed, and,
more relevantly, from the different experimental protocols: in the first two cases the NPs were administered to PC12 cells in the presence of 10% FBS, while in the latter stimulation was performed on cells in 0.1% FCS. This comparison points to another key issue in analyzing toxicity and genotoxicity induced by NPs: it has been reported that the toxic doses can change even of a few orders of magnitude when evaluated in the presence or in the absence of serum36. The finding that in our experimental conditions, the lack of genomic effects is paralleled
by a lack in reduction of cell survival, even in the absence of FBS, strengthens the conclusion that the use of these particles is particularly safe and opens to the possibility of employing them as markers for cell tracking and/ or carriers for drug delivery. This is, to our knowledge, the first detailed description of the changes in electrical activity of neurons following exposure to a nanoparticle, and of its evolution in time. The transient nature of these effects can explain the absence of long term outcomes on cell fate.
Materials and Methods
Materials.
Unless otherwise specified, materials were obtained from Sigma Aldrich.Synthesis of silica NPs.
Synthesis and characterization of the SiO2 nanoparticles have been described inprevious papers6,8. Briefly, bare silica nanoparticles were synthesized by the reverse microemulsion technique;
in particular, a reverse microemulsion was prepared by mixing 75.0 mL of cyclohexane, 18.85 g of Triton X-100, 18.0 mL of n-hexanol and 5.4 mL of deionized H2O in a round bottom flask. After 30 min of equilibration at room
temperature and continuous gentle magnetic stirring, 1.0 mL of tetraethylorthosilicate (TEOS) was added; after further 10 min of equilibration, reaction was started by the addition of 0.7 mL of NH3 (28–30%) and continued
overnight at room temperature under magnetic stirring. After 16 hrs, reaction was interrupted by the addition of acetone; then particles were extracted by centrifugation at 10,000 rpm for 20 min and finally washed twice with ethanol and several times with deionized water until complete removal of surfactant. The nanoparticles were stored in water suspension (1 mg mL−1) at room temperature.
High resolution transmission electron microscopy (HRTEM).
Micrographs of nanoparticles were acquired using a 3010 Jeol instrument operated at 300 kV. Samples were prepared by spreading a droplet of the corresponding suspensions in MilliQ H2O (1.0 mg mL−1) on a copper grid coated with a lacey carbon film andthen letting water to slowly evaporate to limit particle agglomeration. The mean particle diameter was calculated as dm = Σdini/Σni (ni = number of particles of diameter di) by measuring the size of ca. 300 particles.
Dynamic Light Scattering (DLS).
DLS measurements were performed in a 90Plus Particle Size Analyzer (Brookhaven Instruments) at a laser wavelength of 660 nm, a detection angle of 90°, and 293 K. Samples were prepared by suspending NPs in Milli-Q water (pH 5.5, concentration: 0.1 mg mL−1). DLS plots are reported innumber distribution.
GT1-7 cell cultures.
GT1-7 cells, an immortalized line derived from highly differentiated mouse gonadotropin-hormone releasing hormone (GnRH) neurons (generously donated by Prof. P.L. Mellon), were maintained in Dulbecco’s Modified Eagle’s medium (DMEM) supplemented with 10% fetal bovine serum (FBS, Lonza), gentamycin (50 µg mL−1), and glutamine (2 mM) at 310 K, in a humidified atmosphere of 5% CO2 in
air. For patch-clamp experiments, cells were plated at the density of 9,000 cells cm−2 on uncoated plastic dishes
(Corning). After 24 hrs, medium was changed to 0.5% FBS supplemented with 1/50 of B27 (Invitrogen) to improve survival and differentiation, then switched to 0.5% FBS alone for 4–6 days for patch-clamp experiments (a protocol similar to that described in ref.25) or 8–15 days for multielectrode arrays (MEAs) experiments. Plating
density was increased to 20,000–30,000 cells/cm2 both for genomic experiments, in order to have a sufficient
amount of cells for RNA extraction, and for recordings on MEAs, to reach a higher surface of microelectrodes covered by cells.
Isolation and Primary Cell Culture of Mouse Dorsal Root Ganglion Neurons.
Mice were purchased from Charles River (Segrate, Italy). The care and husbandry of mice were in conformity with the institutional guidelines in compliance with national (D. L.vo 26/2014, Gazzetta Ufficiale della Repubblica Italiana, n.61, March 14th 2014) and international laws and policies (European Union directive 2010/63/UE; Guide for the Care and Use of Laboratory Animals, U.S. National Research Council, 1996). Adult Balb-C mice (5/10-wk-old) were euth-anized under deep isoflurane-induced anaesthesia. The procedures were approved by the local animal-health and ethical committee (Università del Piemonte Orientale) and were authorized by the national authority (Istituto Superiore di Sanità; authorization number N. 22/2013).DRG were aseptically removed and collected in a dish containing cold F12 (Nutrient Mixture F12 Ham) medium. Working under a dissecting microscope and using fine forceps, the surrounding membrane was gen-tly teased away from each DRG; nerves and sheath were cut. All desheathed DRG were then transferred into a sterile 35 mm dish containing collagenase from clostridium hystoliticum 0.125% and DNase in F12 medium and incubated at 310 K for 1 hour. After incubation, DRG were triturated using a tip p1000. Myelin and nerve debris were eliminated by centrifugation trough a bovine serum albumin (BSA) cushion. Cell pellet was re-suspended in Bottenstein and Sato medium (BS) (30% F12, 40% DMEM (Dulbecco’s Modified Eagle’s medium, 30% Neurobasal A medium (Life Technologies, Italy), 100 x N2 supplement (Life Technologies, Italy), penicillin 10 U/mL and streptomycin 100 mg/mL, supplemented with Recombinant Human β-NGF, Recombinant Murine GDNF and Recombinant Human NT3 (Peprotech, USA) and plated onto 35 mm Petri dish pre-coated with laminin. Two days after, electrophysiological patch clamp measurements were performed on DRG neurons of all soma sizes.
www.nature.com/scientificreports/
Exposure to NPs.
Prior to the experiments, cells were switched to the appropriate extracellular medium (either DMEM or standard physiological solution, both serum-free). NPs, stored in a stock solution (1 mg mL−1in water) were sonicated for 20 min before final dilution. For all protocols except patch-clamp, the NPs were administered by substituting the extracellular solution with an identical one containing a stable suspension of NPs at the final desired concentration.
Incorporation of nanoparticles.
For conventional transmission electron microscopy (TEM), GT1-7 cells were treated for 1 and 2 hours with NPs and then fixed with 1.2% glutaraldehyde in 66 mM sodium cacodylate buffer, post-fixed in 1% OsO4, 1.5% K4Fe(CN)6, 0.1 M sodium cacodylate, en bloc stained with 1% uranyl acetate,dehydrated, and flat embedded in epoxy resin (Epon 812, TAAB). After baking for 48 hrs, the glass coverslip was removed from the Epon block by thermal shock. Cells were identified by means of a stereomicroscope, excised from the block and mounted on a cured Epon block for sectioning using an EM UC6 ultramicrotome (Leica Microsystem, Vienna). Ultrathin sections (70–90 nm thick) were collected on copper mesh grids and observed with a JEM-1011 microscope (Jeol, Tokyo, Japan) operating at 100 kV and equipped with an ORIUS SC1000 CCD camera (Gatan, Pleasanton, CA). For each experimental condition, at least 100 images were acquired at 10,000 to 15,000x magnification and analyzed using the ImageJ software37.
Si2+ uptake was quantified by using inductively coupled plasma mass spectrometry (ICP-MS; element-2;
Thermo-Finnigan, Rodano (MI), Italy). GT1-7 cells were seeded at the initial density of 20.000 cells cm−2 in
DMEM 10% FCS. The following day, the medium was changed with DMEM 0.5% FCS supplemented with B27 to improve survival and differentiation. Afterward, cells were incubated with SiO2 NPs (20 µg mL−1) added to
DMEM 0.5% FCS for 1 and 24 hrs. After the treatments cells were washed for three times with PBS solution, detached with Trypsin, recounted and collected into an appropriate conical tube and centrifuged (5 minutes at 1000 rpm). The supernatant was discarded and the pellet was analyzed with ICP-MS. Sample digestion was performed with concentrated HNO3 (70%, 1 mL) under microwave heating at 433 K for 20 minutes (Milestone
MicroSYNTH Microwave labstation). Control measurements were performed as above but omitting nanoparti-cles; values were below the sensitivity of the instrument.
Electrophysiology - Patch-clamp.
Conventional whole cell patch-clamp recordings were performed in the current clamp mode at 295–298 K. Cells were continuously superfused with a standard physiological solution of the following composition (in mM): NaCl, 154; KCl, 4; CaCl2, 2; MgCl2, 1; 4-(2-hydroxyethyl)-1-piperazineethane sulfonic acid (HEPES), 5; glucose, 5.5; and NaOH (pH 7.35). Composition of the pipette solution was (in mM): KCl, 15; CaCl2, 3; MgCl2, 3; Hepes, 5; KAsp, 118; EGTA, 5; Na2ATP, 5; pH to 7.3 with KOH. Pipettes
had a resistance of 2–5 MΩ. NPs were dispersed in the solutions at the required concentration. Solutions were applied by means of a microperfusion system connected to a set of five syringes containing the control and test solutions; the perfusion pipette was located at several tens of microns away from the cell to be recorded, in order to minimize mechanical perturbations. Correction for junction potential was performed analogically. Data were collected with an Axopatch 200B amplifier (Molecular Devices, USA) using Clampex 10.2 and Axoscope 10.2 software. Step protocols, in the voltage clamp mode, were applied to check cell functionality. In the presence of NPs, whole cell recordings lasted from 5 to 30 min, durations comparable to those obtained in control experi-ments in the absence of NPs.
Electrophysiology - Multielectrode Arrays (MEAs).
Extracellular GT1-7 action potentials were recorded by means of a commercial 60-channel multi-electrode array (MEA) setup. A description of the exper-imental apparatus is provided in Supplementary Methods online. An external T-control unit (TC02) kept the temperature of the socket surface at 310 K. The digitalized output-data coming from the USB-ME64 unit were acquired, monitored and recorded on a PC through MC_Rack software (Version 4.6.2, Multi Channel Systems MCS GmbH). To reduce the data file size, only upward (positive) and downward (negative) spike cutouts from each of the available recording electrodes were stored. These waveforms consisted of 1 ms pre-spike and 2 ms post-spike fragments respect to the point of threshold crossing. Threshold was fixed at ± 6 standard deviations from baseline noise (typically around 15 µV peak-to-peak). A channel was considered active if it recorded at least 30 spikes in 5 hrs. In general, according to the technical specifications of the device, one electrode does not cor-respond to a single cell. Rather, each electrode can detect all the electrical signals originating in the spatial region surrounding it, within a radius of tens of micrometers. Waveforms drawn from each active channel were finally transformed into time stamps using NeuroExplorer (Nex Technologies, USA). The same software was used also to make raster plots and rate histograms.Survival assay.
Cytotoxicity was evaluated by counting cells with a Burker chamber at 24 hours after incuba-tion in DMEM medium supplemented with B27 without FBS either in the presence or in the absence of the NPs. Data are expressed as number of cells/cm2.RNA-Seq analysis.
GT1-7 cells, plated in 10 cm Petri dishes and kept in 0.5% FBS for 4 days, were shifted to DMEM without FBS to prevent adsorption of serum proteins to NPs and either treated or not (control cells) with 20 µg L−1 NPs for 30 min, 1, 6 and 24 hrs. Cells were then washed with ice cold PBS and lysed with TriReagent(Sigma), 1 mL per dish, harvested with a scraper and stored at 193 K until RNA extraction. RNA was purified as previously described38. RNA integrity measurements were performed using Fragment Analyzer
™
(AdvancedAnalytical). All samples had RNA Quality Number (RQN) greater than 9.8. RT-qPCR was performed using the SuperScript III Platinum One-Step Quantitative RT-PCR System (Invitrogen) following the manufacturer’s instructions. Library preparation was performed using Illumina TruSeq RNA prep-kit following manufacturer’s instructions. Reads were mapped using TopHat239 and RPKM were calculated using cuffdiff tool from Cufflinks
www.nature.com/scientificreports/
software package40. Data analysis and plotting was performed using custom R scripts41. RNA-seq data has been
deposited on Gene Expression Omnibus database under the accession GSE98032.
Statistical analysis.
Particle size evaluated by TEM is given as mean ± SD. Unless otherwise specified, all other data are expressed as means ± SEM. For analysis of NP-cell internalization, differences were assessed by a Mann-Whitney U test; for ICP-MS measurements and cell survival assays, differences were checked by a t-test (after normality had been verified through a Shapiro-Wilk test); in the analysis of MEAs recordings, to compare the differences in firing rate, a paired-samples sign test was used.Data availability.
The RNA-seq data has been deposited on Gene Expression Omnibus database under the accession GSE98032. All other datasets generated and analysed during the current study are available from the corresponding author on reasonable request.References
1. Napierska, D. et al. Size-dependent cytotoxicity of monodisperse silica nanoparticles in human endothelial cells. Small 5, 846–53 (2009).
2. Park, M. V. et al. In vitro developmental toxicity test detects inhibition of stem cell differentiation by silica nanoparticles. Toxicol.
Appl. Pharmacol. 240, 108–116 (2009).
3. Ariano, P. et al. Interaction of spherical silica nanoparticles with neuronal cells: Size-dependent toxicity and perturbation of calcium homeostasis. Small 7, 766–774 (2011).
4. van Schooneveld, M. M. et al. Transcript assembly and quantification by RNA-Seq reveals unannotated transcripts and isoform switching during cell differentiation. Nano Lett. 8, 2517–2525 (2008).
5. Izak-Nau, E. et al. Interaction of differently functionalized fluorescent silica nanoparticles with neural stem- and tissue-type cells.
Nanotoxicology 8, 138–148 (2014).
6. Miletto, I. et al. Highly bright and photostable cyanine dye-doped silica nanoparticles for optical imaging: photophysical characterization and cell tests. Dyes Pigments 84, 121–127 (2010).
7. Accomasso, L. et al. Fluorescent silica nanoparticles improve optical imaging of stem cells allowing direct discrimination between live and early-stage apoptotic cells. Small 8, 3192–3200 (2012).
8. Gilardino, A. et al. Interaction of SiO2 nanoparticles with neuronal cells: Ionic mechanisms involved in the perturbation of calcium homeostasis. Int. J. Biochem. Cell. Biol. 66, 101–111 (2015).
9. Haase, A. et al. Effects of silver nanoparticles on primary mixed neural cell cultures: Uptake, oxidative stress and acute calcium responses. Toxicol. Sci. 126, 457–468 (2012).
10. Nyitrai, G. et al. Polyamidoamine dendrimer impairs mitochondrial oxidation in brain tissue. J. Nanobiotechnology 11, 9 (2013). 11. Lovisolo, D., Gilardino, A. & Ruffinatti, F. A. When neurons encounter nanoobjects: spotlight on calcium signaling. Int. J. Environ.
Res. Public Health 11, 9621–9637 (2014).
12. Liu, Z., Liu, S., Ren, G., Zhang, T. & Yang, Z. Nano-CuO inhibited voltage-gated sodium current of hippocampal CA1 neurons via reactive oxygen species but independent from G-proteins pathway. J. Appl. Toxicol. 31, 439–445 (2011).
13. Shan, D., Xie, Y., Ren, G. & Yang, Z. Inhibitory effect of tungsten carbide nanoparticles on voltage-gated potassium currents of hippocampal CA1 neurons. Toxicol. Lett. 209, 129–135 (2012).
14. Polak, P. & Shefi, O. Nanometric agents in the service of neuroscience: Manipulation of neuronal growth and activity using nanoparticles. Nanomedicine 11, 1467–1479 (2015).
15. Colombo, E., Feyen, P., Antognazza, M. R., Lanzani, G. & Benfenati, F. Nanoparticles: A Challenging Vehicle for Neural Stimulation.
Front Neurosci. 10, 105 (2016).
16. Kang, Y. et al. Potential Links between Cytoskeletal Disturbances and Electroneurophysiological Dysfunctions Induced in the Central Nervous System by Inorganic Nanoparticles. Cell Physiol Biochem. 40, 1487–1505 (2016).
17. Jung, S. et al. Intracellular gold nanoparticles increase neuronal excitability and aggravate seizure activity in the mouse brain. PLoS
One 9, e91360 (2014).
18. Gramowski, A. et al. Nanoparticles induce changes of the electrical activity of neuronal networks on microelectrode array neurochips. Environ Health Perspect. 118, 1363–1369 (2010).
19. Liu, Z., Ren, G., Zhang, T. & Yang, Z. Action potential changes associated with the inhibitory effects on voltage gated sodium current of hippocampal CA1 neurons by silver nanoparticles. Toxicology 264, 179–184 (2009).
20. Dolmetsch, R. Excitation-transcription coupling: signaling by ion channels to the nucleus. Sci STKE 166, PE4 (2003).
21. Ma, H., Groth, R. D., Wheeler, D. G., Barrett, C. F. & Tsien, R. W. Excitation-transcription coupling in sympathetic neurons and the molecular mechanism of its initiation. Neurosci. Res. 70, 2–8 (2011).
22. Rosenholm, J. M., Sahlgren, C. & Lindén, M. Multifunctional mesoporous silica nanoparticles for combined therapeutic, diagnostic and targeted action in cancer treatment. Curr. Drug Targets 2, 1166–1186 (2011).
23. Montalti, M., Prodi, L., Rampazzo, E. & Zaccheroni, N. Dye-doped silica nanoparticles as luminescent organized systems for nanomedicine. Chem. Soc.Rev. 43, 4243–4268 (2014).
24. Nunemaker, C. S. et al. Long-term recordings of networks of immortalized GnRH neurons reveal episodic patterns of electrical activity. J. Neurophysiol. 86, 86–93 (2001).
25. Martinez-Fuentes, A. J., Hu, L., Krsmanovic, L. Z. & Catt, K. J. Gonadotropin-releasing hormone (GnRH) receptor expression and membrane signaling in early embryonic GnRH neurons: role in pulsatile neurosecretion. Mol Endocrinol. 18, 1808–1817 (2004). 26. Newberry, K. et al. Development of a spontaneously active dorsal root ganglia assay using multiwell multielectrode arrays. J
Neurophysiol. 115, 3217–3228 (2016).
27. Dante, S. et al. Selective Targeting of Neurons with Inorganic Nanoparticles: Revealing the Crucial Role of Nanoparticle Surface Charge. ACS Nano 11, 6630–6640 (2017).
28. Bewersdorff, T., Vonnemann, J., Kanik, A., Haag, R. & Haase, A. The influence of surface charge on serum protein interaction and cellular uptake: studies with dendritic polyglycerols and dendritic polyglycerol-coated gold nanoparticles. Int J Nanomedicine 12, 2001–2019 (2017).
29. Liu, Q., Li, H., Xia, Q., Liu, Y. & Xiao, K. Role of surface charge in determining the biological effects of CdSe/ZnS quantum dots. Int
J Nanomedicine 10, 7073–7088 (2015).
30. Magdolenova, Z. et al. A review of in vitro and in vivo studies with engineered nanoparticles. Nanotoxicology 8, 233–278 (2014). 31. Kwon, J. Y. et al. Undetactable levels of genotoxicity of SiO2 nanoparticles in in vitro and in vivo tests. Int. J. Nanomedicine 9(Suppl. 2),
173–178 (2014).
32. Golbamaki, N. et al. Genotoxicity of metal oxide nanomaterials: review of recent data and discussion of possible mechanisms.
Nanoscale 7, 2154–2198 (2015).
33. Xue, Y., Wu, J. & Sun, J. Four types of inorganic nanoparticles stimulate the inflammatory reaction in brain microglia and damage neurons in vitro. Toxicol. Lett. 214, 91–98 (2012).
www.nature.com/scientificreports/
34. Xie, H. & Wu, J. Silica nanoparticles induce alpha-synuclein induction and aggregation in PC12-cells. Chem. Biol. Interact. 258, 197–204 (2016).
35. Wang, F. et al. Oxidative mechanisms contribute to nanosize silican dioxide-induced developmental neurotoxicity in PC12 cells.
Toxicol. In Vitro 25, 1548–1556 (2011).
36. Gonzalez, L. et al. Co-assessment of cell cycle and micronucleus frequencies demonstrates the influence of serum on the in vitro genotoxic response to amorphous monodisperse silica nanoparticles of varying sizes. Nanotoxicology 8, 876–884 (2014). 37. Rasband, W. S. ImageJ, U. S. National Institutes of Health, Bethesda, MD, USA http://rsb.info.nih.gov/ij/ (1997–2007).
38. Incarnato, D., Neri, F., Anselmi, F. & Oliviero, S. Genome-wide profiling of mouse RNA secondary structures reveals key features of the mammalian transcriptome. Genome Biol. 15, 491 (2014).
39. Kim, D. et al. TopHat2: accurate alignment of transcriptomes in the presence of insertions, deletions and gene fusions. Genome Biol.
14, R36 (2013).
40. Trapnell, C. et al. Transcript assembly and quantification by RNA-Seq reveals unannotated transcripts and isoform switching during cell differentiation. Nature Biotechnol. 28, 511–515 (2010).
41. R, Core Team, R: A Language and Environment for Statistical Computing. R Foundation for Statistical Computing. Vienna, Austria, url, https://www.R-project.org/ (2016).
Acknowledgements
We wish to thank Prof. Fabio Benfenati and prof. Armando Genazzani for helpful advice and comments. This work was supported by the Fondazione CRT (call “Richieste ordinarie 2014”, project n. 2014.1041) and by funds of the University of Piemonte Orientale (“Bando Ricerca Locale 2015”).
Author Contributions
C.D. and F.A.R. shared first authorship; C.D., M.D., D.L. and L.M. performed and analyzed the patch clamp experiments; S.A. and A.G. prepared the GT1-7 cultures; B.R. prepared the DRG cultures; A.G. performed the survival assays; F.A.R. and G.C. performed and analyzed the MEA experiments; G.A. and G.M. performed nanoparticle synthesis and characterization; E.C. analyzed the localization of the nanoparticles; D.I., E.M. and S.O. performed the genomic analysis; E.B. performed the ICP-MS measurements; D.L. and C.D. designed the experiments and wrote the paper. All authors reviewed and approved the manuscript.
Additional Information
Supplementary information accompanies this paper at https://doi.org/10.1038/s41598-018-21157-8.
Competing Interests: The authors declare no competing interests.
Publisher's note: Springer Nature remains neutral with regard to jurisdictional claims in published maps and
institutional affiliations.
Open Access This article is licensed under a Creative Commons Attribution 4.0 International
License, which permits use, sharing, adaptation, distribution and reproduction in any medium or format, as long as you give appropriate credit to the original author(s) and the source, provide a link to the Cre-ative Commons license, and indicate if changes were made. The images or other third party material in this article are included in the article’s Creative Commons license, unless indicated otherwise in a credit line to the material. If material is not included in the article’s Creative Commons license and your intended use is not per-mitted by statutory regulation or exceeds the perper-mitted use, you will need to obtain permission directly from the copyright holder. To view a copy of this license, visit http://creativecommons.org/licenses/by/4.0/.