UNIVERSITÀ DEGLI STUDI DELLA TUSCIA DI VITERBO
CORSO DI DOTTORATO DI RICERCA IN SCIENZE AMBIENTALI (XXIV Ciclo)
Eco-balance of 3D-shaped renewable biopolymer foam for a novel generation
of transportation packaging: a “Cradle to grave” approach using life cycle
assessment (LCA) methodology
(CHIM/06)
Coordinatore: Prof. Maurizio PETRUCCIOLI
Tutor interno: Dott.ssa Roberta BERNINI
Tutor esterno: Dott. Francesco DEGLI INNOCENTI
TABLE OF CONTENT
1 INTRODUCTION ... 2
2 LCA METHODOLOGY ... 4
3 THE LCA STUDY ... 8
3.1 GOAL AND SCOPE DEFINITION ... 8
3.2 INVENTORY ...15
3.2.1 Granule production & conditioning (Stage 1) ...15
3.2.2 Packaging production (Stage 2) ...28
3.2.3 Packaging disposal (Stage 3) ....36
4 IMPACT ASSESSMENT AND INTERPRETATION ...67
4.1 NORMALISATION ...88
4.2 ESTIMATION OF UNCERTAINTY ...89
4.2.1 Data quality check ...90
4.2.2 Monte Carlo simulation ...92
4.2.3 Sensitivity analysis ...99 4.3 CONCLUSIONS ... 110 5 FUTURE WORKS ... 114 6 REFERENCES ... 115 APPENDIX A ... 119 APPENDIX B ... 123 ACKNOWLEDGEMENTS ... 124
1 INTRODUCTION
Almost all consumer goods purchased in everyday life come with packaging. Cushioning packaging is defined as a packaging system which ensures that the product contained is not damaged in distribution and handling operations [1]. World demand for protective packaging was $15.3 billion in 2009. Focusing on European market, it accounted for about 26% of the total demand that year. Foam plastic protective packaging made of Expanded Polystyrene (EPS), Polyurethane (EPU), Polyethylene (EPE) and Polypropylene (EPP) are the most popular cushioning materials thanks to their light weight and the excellent cushioning capabilities. Recent studies have shown that the demand of this kind of packaging is expected to increase to $ 22.2 billion in 2014 [2]. Factors such as the growth in manufacturing activity and the continued proliferation of internet shopping could explain these estimations. However, despite of their functionality, the widespread use of these polymer foams of synthetic origin implies considerable environmental concerns like the use of non renewable resources (e.g. oil, natural gas) for its production and concerns regarding waste disposal associated with their short life. Recycling, which is the solely applicable solution for preventing those synthetic foams entering the waste stream, appears in fact to be not always applied due to cost-ineffectiveness. Further, primary packaging, which are normally in contact with the good, are taken home by consumers and, they are not only more dispersed into households, they are also largely mixed, contaminated and often damaged and thus pose problems in recycling or reuse of the materials [3].
With this in mind, biodegradable and compostable bio-based plastics represent an emerging highly promising solution for two main reasons:
1) the use of renewable and potentially more sustainable sources of raw materials (crops instead of crude oil), especially in the long run;
2) to facilitate integrated waste management approaches so as to reduce landfill disposal.
However, when innovative products are presented instead of the traditional fossil-based ones, several questions surface about the effective environmental sustainability of the renewable raw materials. This is not surprising, considering that not necessarily renewability and or biodegradability is a proof of a lower environmental impact. Several factors can contribute to increase a higher environmental impact: agricultural practices, extraction processes, complicated conversion processes, etc. To answer to this question and show that a shift from fossil-based products to bio-based products is meaningful and sustainable, a life cycle based approach namely Life Cycle Assessment (LCA) analysis should be applied, taking into account all the valuable phases, including the agricultural phase up to product disposal.
The EU-funded REBIOFOAM project (Seventh Framework Programme for Research - FP7) targeted the development of a biodegradable and REnewable BIO-polymer FOAM to be applied as protective packaging material through the development of a new manufacturing process where the expansion of the starch-based polymer granules was driven by microwave technology by exploiting the inner water content of the granules themselves so as to generate vapour which triggered the foaming process.
The packaging system developed within the project (i.e. from now and on prototype pck) consisted in a port-hole spacer used for protecting washing machine port-holes, however, it is important to point out that such a prototype pck represented just a possible application of the innovative foamed material.
Formulation and processing: the base materials, i.e. mainly starch and water, were processed with smaller quantities of other required bio-based additives and renewable or synthetic polymers.
Extrusion and granuleizing: the material was extruded into controlled morphology granules of well defined water content; this, combined with subsequent conditioning, allows achieving tailor made chemical and physical properties of granules as required for the expansion.
Microwave-assisted expansion and moulding: granules were transferred into a microwave transparent mould and are further processed in a microwave environment with controlled temperature and pressure conditions. Rapid dielectric heating of the granules to a temperature beyond the flash point of the blowing agent, which was the inner contained water, caused the granules to foam in the mould thus resulting in a 3D-shaped foamed product.
The present doctoral thesis provides a preliminary fact-based analysis regarding the environmental performance of the prototype pck developed within REBIOFOAM project. To this end the Life Cycle Analysis (LCA) methodology was applied covering the whole packaging’s life cycles as foreseen by the project itself (i.e. Work Package 8 or WP8). The main objectives of WP8 were:
to analyze potential changes in the management of expanded pck waste stream caused by a hypothetical introduction of the (compostable) prototype pck;
to investigate the environmental performance of the prototype pck from a life cycle perspective;
to compare the environmental performance of innovative packaging against that made of EPS1 (i.e. benchmark);
to provide recommendations so as to improve the environmental profile of the prototype pck.
A sensitivity analysis for the most important key parameters was performed so as to increase the reliability of the research outcomes. Also an estimation of the potential magnitude of the use of renewable feedstock like tapioca, potato and maize for producing an amount of prototype pck able to replace 30% of packaging products consumed in EU was carried out.
1A market study commissioned by Istituto Italiano Imballaggio (Italian Institute of Packaging) in 2004 showed that moulded EPS
is the largest material used in protective packaging sector (i.e. 35%). Though data were referring to 2004, the present situation has not significantly changed. According to PlasticsEurope , always in 2004, EPS consumption in EU by protective packaging sector was about 210 kton where the major part of EPS used was for transport and protective packaging (www.plasticseurope.org)
2 LCA METHODOLOGY
Life Cycle Assessment is a methodology useful to evaluate the environmental burdens associated with a product, process, or activity by identifying and quantifying energy and materials used and wastes released to the environment. The aim is to assess the impact of those energy and materials used and releases to the environment and to identify and evaluate opportunities to affect environmental improvements. The assessment includes the entire life cycle of the product, process or activity, encompassing, extracting and processing raw materials; manufacturing, transportation and distribution; use, re-use, maintenance; recycling, and final disposal. A LCA consists in four different steps, defined by ISO 14040 [4] and ISO 14044 [5] (Figure 1).
Figure 1 Life cycle assessment framework (adapted from ISO 14040)
1. The goal and scope definition is the preliminary step which defines the aims of the study, the F.U., the boundaries of the system being studied, the data requirements, the assumptions, the limits and the exclusion criteria.
2. The inventory analysis is the step dedicated to studying the process or activity, its main aim is to reconstruct the model which represents the flow of materials and energy in the production system of the product being studied, including all valuable processes of transformation, transport, use, and end of life. 3. The impact assessment is the step where, based on calculation methods, the inventory data of the product
is analysed in order to obtain the environmental impact. This can be identified in specific impact categories.
4. The interpretation is the conclusive step of a LCA and it has the objective of providing a preliminary evaluation of the environmental impact of the processes and materials used. These simplified LCA considerations will also help highlighting the main areas where the eco-design could be implemented.
It is important to point out that the LCA is, however, affected by some valuable issues that may heavily influence the reliability of analytical outcomes thus conclusions. Basically conducting an LCA according to somehow established rules (i.e. ISO 14040 and 14044) does not necessarily provide consistent, “descriptive” models that are useful as a decision support tool [6]. Such aspects are well known by scientific community and LCA practioners [7]. The limitations of the methodology mainly concern the aspects outlined in Table 1.
Table 1 LCA methodology hotspots overview
Hotspots Remarks
Simplified models LCAs are based on descriptive models that might not be enough consistent (i.e. scientific robustness).
Compression of time and space Potential impacts are calculated as they were generated all in the same place and at the same time.
High number of hypothesis and assumptions
Many decisions have to be made during the execution of a LCA study. Final results depend on the definition of the system boundary, data sets, approximations, data gaps as well as the allocation and recycling procedures used etc.
Inventory data collection Data quality like completeness, representativeness of inventory is a fundamental requirement quite often not easy to reach.
Inconsistency The most commonly used databases for LCA usually show more or less substantial differences in the details of inputs and outputs considered (i.e. inconsistency), even if they analyze the same products and processes and are derived from the same primary data sources. Allocation The problem of coproduct allocation is one of the most debated issue
in LCA
Impact assessment E.g. for Human and Ecotoxicity impacts no robust methods exist Approach in modelling:
attributional or consequential?
In the consequential approach the induced effects related to the introduction of products are investigated and quantified.
Uncertainty How real are the results? When A is better than B?
In reference to the second last point (Table 1) it is important to provide more details about the meaning of Attributional and Consequential approaches since they were both adopted in this analysis.
Attributional (ALCA) accounting describes the environmentally relevant physical flows to and from unit processes (i.e. sub-systems of the life cycle) that compose the supply chain without considering how other relevant environmental flows will change in response to possible decisions. By contrast a “Consequential” (CLCA) approach aims to describe the environmental consequences of an analysed decision (e.g. an alternative raw material source or the introduction of a new product in the market etc.). Such a approach is broader in scope in the sense that it should include all processes that they are expected to be affected by the decision, regardless of whether or not they are part
of the existing supply-chain (i.e. also effects that occur via market mechanisms) [8]. This includes the identification of affected processes that, due the complexity of our socio-economic systems, it is not a simple task at all. Therefore it may happen that such models provide low levels of accuracy and analysis outcomes have to be interpreted with caution. Scientific community and LCA practioners suggest to adopt the ALCA or CLCA based on the decision-context of the study and on the knowledge needs of the target audience [8], however, there are several products whose effects are intimately linked to other systems to be on the point that it is impossible to adopt an ALCA accounting if we want to get a complete and consistent environmental profile of the product itself [9]. Further the CLCA approach, beyond to ensure that mass balance and energy are maintained intact, it definitively resolves the allocation problem [10] thanks to system expansion that includes the avoided function/s. Nevertheless so as to properly define the avoided functions and related unit process or processes to be considered (i.e. credited) it is not always a simple task even if I-O databases can represent a valid support to modelling system expansion. For these reasons, a consequential approach would be always preferable compared to attributional one, however, in order to maintain as more homogeneous as possible the two systems (prototype pck and EPS one), a “hybrid” approach was here followed.
In particular, for upstream processes (e.s. intermediates and raw material production) an attributional approach was adopted, whereas for End of Life (EoL) scenarios a consequential one (i.e. system expansion). Tapioca or maize starches were examples of a joined multioutput processes where, beyond the product of our interest (starch), also other coproducts were produced (feed products). In this case a physical relationship (mass allocation) was adopted for partitioning the impacts. This choice was mainly motivated by the fact that one of the polystyrene intermediate (i.e. ethylene) is obtained in a joined multioutput process namely cracking where a mass allocation was applied [11]. Therefore so as to maintain the analyzed systems as more as possible consistent, an attributional approach was followed.
On the contrary for EoL treatments a system expansion including the avoided functions (i.e. electricity and heat produced by the incinerator or peat replaced by compost) was modelled thus the avoided impacts were credited to the corresponding pck systems. A “consequential scenario” was also investigated within the sensitivity analysis regarding GHG emissions coming from a hypothetical Land Use Change (LUC) (§ 4.2.3).
Aware of these aspects (Table 1), the analysis was performed trying to approximate as more as possible the reality, using consistent and representative data2. In addition, a particular focus was dedicated to the robustness of results. For the sake of clarity all hypothesis and assumptions made along with used inventory data were reported in this report so the reader (e.g. LCA practioner) can easily understand what has been done and identify areas of further improvements of the analysis. Just few data were not completely disclosed due to confidential reasons.
The LCA elaboration was performed by using one of the most diffused and tested LCA software (SimaPro Version 7.3.2) along with the most update and reliable databases regarding materials production, energy systems and transports (e.g. Ecoinvent 2.2). The following international standards and rules were considered:
ISO 14040:2006 Environmental management – Life cycle assessment – Principles and framework
2
Foreground inventory data (i.e. data related to the processes under operational control by the project partners) were directly collected by the REBIOFOAM partners involved in the development of the innovative process and reflected the sperimental outcomes. For EPS, average industrial data were used (EU context).
ISO 14044:2006 Environmental management – Life cycle assessment – Requirements and guidelines Product Category Rules (PCR 2010:16) “Plastic in primary forms” UN CPC CODE 347 Version 3.0 (July
29th 2010)
General Programme Instructions for Environmental Product Declaration, EPD Version 1.0 (2008-02-29) www.environdec.com
3 THE LCA STUDY
3.1 GOAL AND SCOPE DEFINITION
Functional UnitThe F.U. is defined as “quantified performance of a product system for use as a reference unit”. In this study the F.U. was defined as the “the production, use and disposal of 100 port-hole spacers”. The functionality of the prototype pck was equivalent to that of EPS pck as showed by characterization analysis and tests performed by a partner of the project within WP7.
The packaging products analysed were: Starch-based bioplastic prototype pck EPS pck (benchmark).
The main characteristics of the innovative and current one pck systems are shown in Table 2.
Table 2 Main characteristics of packaging systems analyzed (source: Novamont)
System boundaries
Since the study was designed to be a “Cradle to grave” LCA, it covered all relevant process steps from raw material sourcing to the final waste treatment of used packaging. A simplified process flow diagram of the analyzed systems is shown in Figure 2.
Characteristic Prototype packaging Current packaging
Material Starch-based bioplastic EPS
Density [kg/m3] 40 20 (range:18-25)
Volume [L] ≈0.6 ≈0.6
The modelled systems started with the extraction of raw materials from their natural sources (renewable like tapioca or non renewable like oil), followed by the polymer granules (i.e. prototype starch-based and EPS) and pck systems production, then the used phase (equal for both systems) was followed by the disposal stage which represented the last part of pck systems’ life cycle. Based on the nature of materials different End of Life (EoL) scenarios were considered. The percentage values for each waste treatment reflected the real situation since they were worked out starting from statistics data on waste management (a detailed description is provided in the inventory). Overall three main stages were identified which were in turn composed by sub-stages as shown in Table 3.
Table 3 Life cycle stages of analysed products
The washing machine production along with the pck system distribution, use, sorting and disposal stages were left out since they did not affect the comparison between the two pck systems.
Allocation rules
Allocation refers to partitioning of input or output flows of a process or a product system between the product system under study and one or more other products system [12]. In this study, when possible, allocation was avoided for example expanding the product system to include the additional functions related to co-products (e.g. electricity production coming from pck incineration, see EoL treatments). However in all cases where it was not possible to avoid allocation, a criteria based on physical properties (e.g. mass) [13] was applied. For materials production, transports etc. coming from Ecoinvent 2.2 databases the allocation rules applied were followed.
Waste management rules
According to “Supporting Annexes for Environmental Product Declaration, EPD® (Version 1.0 2008-02-29)”
document, the waste (solid and liquid) produced in all life cycle stages were considered as follows:
Hazardous waste to be disposed of: the environmental loads related to their disposal were included in the system boundaries
Non hazardous waste to be disposed of: the environmental loads related to their disposal were included in the system boundaries
Life cycle stage Sub-stages
STAGE 1
Granule production & conditioning
Extraction of non renewable resources (e.g. oil) and growing & harvesting of renewable resources (e.g. tapioca)
Intermediate product production (e.g. styrene for EPS or tapioca starch for prototype) Intermediate product transports
Polymer granulates production
STAGE 2
Packaging production Pck system production (i.e. prototype process and steam expansion for EPS)
STAGE 3
Packaging disposal
Pck disposal (average real scenarios)
Environmental credits from waste treatments (e.g. peat replacement due compost use or electricity replacement due to electricity from incineration) due to system
Waste to recycling: no environmental loads were accounted for since they have to charge in the “subsequent system” (i.e. collection and recycling of the waste).
Electricity use
Whenever possible the electricity country mix related to the place where the processes take place was used. In all remaining cases the average European electricity mix was used.
Cut-off rules
Materials that contribute less 1% on mass basis were excluded from the analysis (i.e. natural additive for prototype material)
Excluded LCA phases
Building and equipment construction and maintenance for prototype and EPS granule production and expansion processes were not accounted for in the analysis since, based on other studies, they were supposed to be negligible. Also the packaging and distribution of the pck system were not accounted since no significative differences between analysed systems were expected.
Impact categories
The environmental performance of the examined pck systems was assessed considering the following impact categories or indicators:
Global Warming Potential (GWP)
The Global warming is an average increase in the temperature of the atmosphere near the Earth's surface and in the troposphere, which can contribute to climate changes and have serious consequences for many ecosystems. Global warming can be caused by a variety of factors, both natural and human-induced. Greenhouse gases (GHG) concentration in the atmosphere increased is significantly in the last 200 years, mostly because of fossil fuels burning and deforestation. As a consequence there’s an enhanced greenhouse effect which causes Earth's temperature increase. The greenhouse effect is a global effect.
Primary energy demand (cumulative energy demand, CED or gross energy requirements, GER), measured as lower heating value (LHV) in MJ, differentiated into:
Non renewable primary energy resources (NRER)
Much of energy supply comes from fossil fuels, such as coal, oil and natural gas, which are considered non-renewable, because their deposits took millions of years to form and once removed from the ground; they cannot be replaced within human time scales. Uranium, which is used for nuclear energy, has limited supply as well. Non renewable resources are used to produce energy or materials (e.g. petrochemical sector).
Renewable primary energy resources (RER)
Energy sources (i.e. wind, hydropower, solar etc.) or other natural resources (e.g. timber, maize) that can be replaced after being used by environmental processes in a time frame meaningful to humans. Renewable resources are used to produce energy or materials for manufacturing, food and feed industry.
Acidification Potential (AP)
Several human activities and natural sources (such as volcanoes and decaying vegetation) cause acid substances to be emitted in the atmosphere, in this way its content in nitric and sulphuric acids become higher than normal amounts. It affects a variety of plants and animals. The main chemical forerunners of acidification are SOx, generated by combustion of oil and coal (which have high sulphur content), NOx, originates at high temperatures (especially in combustion engines) and NH3 which is produced mainly by agricultural activities. Gases react in the atmosphere with water, oxygen, and other chemicals to form various acidic compounds. If the acid chemicals are blown into areas where the weather is wet, they can fall to the ground in the form of acid rain, snow or fog (wet deposition). Otherwise, in dry areas, they may become incorporated into dust or smoke and fall through dry deposition, sticking to the ground, buildings and trees. Rain can wash the particles from these surfaces, leading to increased runoff. As a consequence serious damage to woodlands, lakes and rivers ecosystems occur. Acidification of the soil cause the dissolution of several chemicals, naturally present in the soil, which are toxic to plants and animals. Acidification is a typical continental problem.
Eutrophicating Potential (EP)
Eutrophication refers to an increase in the rate of supply of organic matter to an ecosystem, which most commonly is related to nutrient enrichment enhancing the primary production in the system [14]. It can occur on land or in water. Nitrogen (in the form of nitrate, nitrite or ammonium) and phosphorus (in the form of ortho-phosphate) are the main nutrients causing eutrophication. They enter the environment and stimulate plant growth but a considerable increase in nutrients supply, means for example in rivers and lakes, an increase of algae growth and decay. The consequently shortage of oxygen results in the disappearance of varieties of fish. The result in water as well as on land is that biodiversity could diminish considerably. Eutrophication is a regional problem.
Ozone Depletion Potential (ODP)
There is a natural shield located 10 to 50 km above the Earth's surface, this layer, rich in ozone, is the stratosphere and it works as protection against UV radiation and X-rays radiated from the Sun. Their amounts would be extremely dangerous but ozone uses some of the more dangerous forms of solar radiation to dissociate into oxygen atoms. The same radiation is also a constant source of ozone formation. The ozone layer is affected by halogenated substances which can reduce its thickness increasing the risk of skin cancers. Chlorine (Cl), fluorine (F), and bromine (Br) stable compounds (e.g. CFC), emitted in the troposphere, migrate to stratosphere through slow diffusion processes. Here, thanks to the Sun radiation, they release halogens radicals which react with other chemicals, and become stabile compounds. They can be decomposed only under specific circumstances, for example on the surface of ice crystals which are abundant in the polar region especially near the South Pole. Particularly during spring, thanks to solar radiation, these stable compounds release again halogen radicals which rapidly decompose the ozone. Causing a very intense depletion of the ozone layer in this region. Ozone layer depletion is typically a global problem.
Photochemical Ozone Creation Potential (POCP)
The main mechanism of tropospheric ozone production and disappearance is a natural cycle through reactions in which NOx (nitric oxide NO and nitrogen dioxide NO2) and sunlight are involved. A higher concentration in the troposphere of NOx and VOC (hydrocarbons, such as gasoline, solvents, and biogenic substances) breaks the natural equilibrium, resulting in an increasing formation of ground-level ozone, which is particularly dangerous. VOC and
particular periods of the year due to a complex reaction in which a combination of hydrocarbons (CxHy, mostly emitted by motor vehicles, vegetation, and industrial processes), nitrogen oxides (NOx, derived from motor vehicles, power plants, industrial facilities, biomass burning, and lightning), sunlight and high temperatures leads to the formation of ozone. This phenomenon is also known as ‘summer smog’. Ozone is a very corrosive substance at this level. It is a strong oxidant which is capable of damaging virtually any material and cause serious damage to human health, animals and plants (its corrosiveness can affect the lung tissue of humans and others animals). Photochemical ozone creation is a regional problem.
Abiotic Depletion Potential (ADP)
The Abiotic Depletion Potential (ADP) measures the extraction of natural resources such as iron ore, scarce minerals, and fossil fuels such as crude oil. This indicator is characterised based on ultimate reserves and extraction rates using Antimony (Sb) as a reference.
To notice that the primary energy demand (synonymously, cumulative or gross energy demand) is, strictly speaking, not an impact indicator, but a technical indictor of the total energy input to the system. From an environmental perspective, the depletion of non renewable resources is measured as Abiotic depletion (ADP).
The selection of impact calculation methods is not arbitrary because results can differ substantially. The methods here used were selected considering the following aspects:
International consensus has been reached; High degree of certainty;
Publicly availability of related documentation Representativeness of plastic materials
Table 4 Impact categories Impact categories (ABBREVIATION) Midpoint reference substance (unit)
Source/Method Characterization factors
Global Warming Potential (GWP 100)
kg CO2 eq.
Intergovernmental Panel on Climate Change (IPCC) http://www.ipcc.ch/
Climate change factors of IPCC with a time frame of 100 years. Climate Change 2007: The Physical Science Basis. IPCC fourth
assessment report http://www.ipcc.ch/ipccreports/ar4-wg1.htm Non renewable Energy Resource consumption (NRER) MJ eq. IMPACT 2002+ method or Cumulative Energy Demand (CED) method (SimaPro 7.1 software)
Calculated as Low Heat Value (LHV) of fossil energy resources Renewable Energy Resource consumption (RER) MJ eq. Cumulative Energy Demand (CED) method (SimaPro 7.1 software)
Calculated as Low Heat Value (LHV) of Renewable energy resources.
Eutrophication (EP)
kg PO4 eq.
EPD Supporting Annexes for Environmental Product Declaration, EPD® (Version 1.0 2008-02-29)
CML, 1999; Heijungs et al. 1992
Acidification
(AP) kg SO2 eq.
EPD Supporting Annexes for Environmental Product Declaration, EPD® (Version 1.0 2008-02-29)
CML, 1999; Huijbregts, 1999; average Europe total, A&B Stratospheric Ozone Depletion (OD) kg CFC-11 eq.
EPD Supporting Annexes for Environmental Product Declaration, EPD®
(Version 1.0 2008-02-29)
Solomon & Albritton, 1992, in Nordic
Guidelines on Life-Cycle Assessment, Nord 1995:20, Nordic council of Ministers, Copenhagen
Photochemical Ozone Formation (POF)
kg C2H4 eq.
EPD Supporting Annexes for Environmental Product Declaration, EPD®
(Version 1.0 2008-02-29)
References: Heijungs et al., 1992, in Nordic Guidelines on Life-Cycle Assessment, N of Ministers, Copenhagen. Andersson-Sköld et ord 1995:20, Nordic council al., 1992, in Environmental Assessment of Products, Institute for Product Development, Copenhagen, Denmark
Depletion of abiotic
resources (AD) kg Sb eq. CML 2001 (update to 2007) CML, 1999 Further, also two inventory level categories were investigated. These were:
Water consumption [m3] Land occupation [m2/y]
Water consumption is an important indicator since almost all industrial processes use water either as cooling water or process water.
land use for agriculture only. Land taken by the expansion of artificial areas and related infrastructure, industrial plants, waste management plants etc. was assumed comparable for current plastic materials and prototype one and thus not taken into account. The different types of land use (i.e. agriculture) were aggregated 1:1. It means that no weighting of different types of land use was carried out according to the CML 2001 method.
Human and Eco-toxicity impact categories were not considered due to inconsistency issues on inventory data coming from different background databases (i.e. PlasticsEurope and Ecoinvent 2.2) as observed after some consistency checks.
3.2 INVENTORY
Inventory is the second step of a LCA analysis and it consists of quantification and qualification of the main stream of materials and energy in input and output to the system.
To this study’s ends primary and/or specific data were used. In particular inventory data for the prototype granule production and granule expansion come directly from the semi-industrial trials of project partners (i.e. primary data). In reference to the tapioca starch production, average industrial data (i.e. secondary specific data) were used as well as for tapioca cultivation. For the additives secondary specific data were used. Data for EPS granule came from the Eco-profile of PlasticsEurope (2005) and they reflected the European average industrial EPS production, whereas for EPS granule expansion primary and secondary industrial data were used. Regarding the disposal of pck systems, a real disposal scenario was set both for prototype and EPS pck systems by matching washing machine market distribution information, and national statistics on Municipal Solid Waste (MSW) management. Emissions to air, water etc. coming from waste treatments were elaborated by using the tool developed by Ecoinvent 2.2 [16] [17]. The life cycle stages, and sub-stages, for both packaging systems are here described along with sources, hypothesis and assumption done.
3.2.1 Granule production & conditioning (Stage 1) Prototype granule production
Within prototype technology the base materials, i.e. mainly starch and water, were processed with smaller quantities of other required components (i.e. natural additives and natural or synthetic polymer). The granule (figure 3) production consisted of an extrusion of these base materials followed by pelletizing. The material was extruded into controlled morphology granules of well defined water content; this, combined with subsequent conditioning, allowed achieving tailor made chemical and physical properties of granules as required for the expansion. The mass balance, reflecting the best experimental results (i.e. best optimized blend), is shown in Figure 4 whereas the complete inventory data for prototype granule production and conditioning are given in Table 5 and Table 6. They reflected the real consumptions measured and/or estimated in the semi-industrial plant.
Figure 3 Prototype granule (source: Novamont)
Table 5 Inventory for prototype granule extrusion (figures related to F.U.)
Table 6 Inventory for prototype granule drying or conditioning (figure related to F.U.)
Unit Amount Product in output Conditioned granule kg 3 Input Material Granule kg 3.3 Energy
Electricity, medium voltage, at grid/IT U kWh 0.1
Natural gas, burned in industrial furnace low-NOx >100kW/RER MJ 1.6 Output
Emission to air
Water kg 0.3
The detailed electricity consumption for each component of the extruder semi-industrial line is available in the technical documentation.
Different types of starch (potato, maize and tapioca) were suitable to be used for prototype granule production. In this report tapioca starch produced in Thailand was described as:
b. Thailand is the second biggest producer of tapioca starch after Nigeria [18];
c. High quality inventory data (i.e. representativeness and completeness) for tapioca starch production were found out in literature [19].
However, also starch from maize and potato produced in Germany and Italy were analysed within the sensitivity analysis. The term other components referred to natural additives (less than 1% on mass basis) and a biodegradable polymer that can be derived from renewable or non renewable resources. The latter component, for confidential reasons, was dealt with in this study using a generic nomenclature and inventory data.
The following chapters described the processes and the related inventory data for the starch and polymer production along with hypothesis and assumption applied.
Unit Amount Product in output
Granule kg 3.3
Input
Material
Starch+ water + other components kg 3.8
Energy
Electricity, medium voltage, at grid/IT U kWh 0.7
Natural gas, burned in industrial furnace low-NOx >100kW/RER MJ 1.1 Output
Emission to air
Tapioca starch
Tapioca starch production can be divided into two main phases: tapioca cultivation and starch extraction and refining.
Tapioca cultivation
In 2008 Thailand produced about 28 million t of tapioca [18] with a share of 12% at World level and the second largest producer after Nigeria. The average crop yield in 2008 was about 24 t/ha.
Tapioca accumulates food in its roots. After growing leaves and other green parts, it starts to produce carbohydrate. The ability to produce and accumulate starch depends on the variety, the age at which it is harvested, the amount of rainfall and other factors. The typical tapioca composition is given in Table 7.
Table 7 Typical composition of tapioca [20]
Composition of tapioca root. Amount per 100 gram
Water 60.21-75.32
Peel 4.08-14.08
Flesh (Starch) 25.87-41.88
Cyanide (ppm) 2.85-39.27
As can be observed the composition of tapioca root is, apart from water, mainly starch.
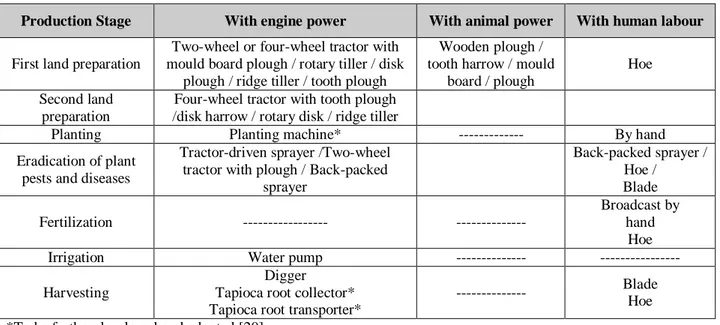
The list of farm machinery and equipment used in tapioca production is given in Table 8. It also includes those with potential to be adopted among farmers.
Table 8 List of farm machinery ad equipment for tapioca production in Thailand
Production Stage With engine power With animal power With human labour
First land preparation
Two-wheel or four-wheel tractor with mould board plough / rotary tiller / disk
plough / ridge tiller / tooth plough
Wooden plough / tooth harrow / mould
board / plough
Hoe Second land
preparation
Four-wheel tractor with tooth plough /disk harrow / rotary disk / ridge tiller
Planting Planting machine* --- By hand
Eradication of plant pests and diseases
Tractor-driven sprayer /Two-wheel tractor with plough / Back-packed
sprayer Back-packed sprayer / Hoe / Blade Fertilization --- --- Broadcast by hand Hoe
Irrigation Water pump --- ---
Harvesting
Digger Tapioca root collector* Tapioca root transporter*
--- Blade Hoe *To be further developed and adopted [20]
As can be observed from Table 8 tapioca cultivation in Thailand is currently not fully mechanized as other crops like maize, wheat etc. in USA or Europe. For example, weeding and harvesting are generally carried out by hand. Sandy soils and sandy loam are preferred for tapioca cultivation whereas clayey soils not.
Figure 5 Cross section of tapioca roots (source: Wikipedia)
No primary data were available for tapioca cultivation so literature data were used. In particular a study related to the production of bio-ethanol from cassava (tapioca) was used for modelling the tapioca cultivation.
According to the ethanol performances [21], amounts of inputs for cassava cultivation step in Thailand per one kg of fresh roots (25% starch content) are shown in Table 9:
Table 9 Inventory data for 1 kg fresh root (60% moisture, starch: 25%)
Unit Amount Note
Product in output
Fresh root kg 1 60% moisture
Input
Resources from nature
Occupation arable m2
0.42 Yield: 23.8 t/ha Energy, gross calorific value, in biomass MJ 6.55 Gross calorific value of starch
Fertilizers and pesticides
Urea, as N, at regional storehouse/RER kg 0.00221 Single superphosphate, as P2O5, at regional storehouse/RER kg 0.00208 Potassium chloride, as K2O, at regional storehouse/RER kg 0.00262 Pesticide unspecified, at regional storehouse/RER kg 7.67x10⁻⁵ Glyphosate, at regional storehouse/RER kg 9.67 x10⁻⁵
Energy
Diesel, at regional storehouse kg 0.000313 Transport of fertilizers
Diesel, at regional storehouse
kg 8.57 x10⁻⁵ Transport from distribution center to retailers Diesel, at regional storehouse
kg 8.26 x10⁻⁵ Transport from retailers to farm Output Emission to air Nox kg 1.82 x10⁻⁵ N2O kg 8.68 x10⁻⁵ Carbon dioxide kg 0.00346 Ammonia kg 0.0004 Emission to water Nitrate kg 0.00024 Phosphorus kg 2.49 x10⁻⁵ Phosphate kg 0.000144 Phosphate kg 3.06 x10⁻⁵
As no inventory data were available for emissions to air and in soil (due to fertilizers application), they were worked out using the formulas adopted by Ecoinvent 2.2 database. Fertilizers production reflected the European context.
Starch extraction and refinering
In 2005, Thailand had 92 tapioca processing plants with a total production capacity of native and modified starch at about 16910 and 4350 t/day, respectively [22]. Normally, these tapioca plants operated 24 h a day for 8–9 months, from September to May.
The production of native starch from cassava root involves seven major stages. These are: root washing, chopping and grinding, fibrous residue separation, dewatering and protein separation, dehydration, drying, and packaging. The production facilities require generally large volumes of water and energy, and the generation of high organic-loaded wastewater and solid waste, nevertheless, improvements of the process efficiency are being undertaken [19]. According to the study of Tanticharoen and Bhumiratanatries [23] the generation of wastewater at the tapioca starch plants averages 20 m3 for every t of starch being produced, whereas the characteristics of wastewater from the Vietnam tapioca starch plants with the values of 11,000–13,500 mg COD/L, 4200–7600 mg SS/L, and pH of 4.5– 5.0 [19] were reported. The approximate generations of wastewater and solid waste (fibrous residue and peel) are 12 m3 and 3 kg per t of starch, respectively.
Figure 6 reported the wet matter mass and water mass balance for tapioca starch production, whereas the complete inventory data are given in Table 10.
The total amount of water used, wastewater generated, sand and peel, and fibrous residues were averaged from the eight studied plants [19].
Table 10 Inventory data for 1 t starch from tapioca (moisture: 12%)
Unit Amount Note Product and co-product in output
Starch from tapioca (12% moisture) t 1 mass allocation:
42%
Fibrous residues t 1.4 mass allocation:
58%
Input
Resources from nature
Water , processes, unspecified natural origin m3 18
Material
Tapioca (fresh root)
t 4.21 Water content = 60% Sulphur, from crude oil, consumption mix, at refinery, elemental sulphur
EU-15 S kg 0.7
Energy
Electricity, medium voltage, production THAILAND, at grid/UCTE MJ 608 Light fuel oil, burned in industrial furnace 1MW, non-modulating/RER MJ 1303 Transport, lorry >16t, fleet average/RER
tkm 0.421
distance from farm to starch production plant (i.e. 100 km) Output Emission to air Water t 0.28 Emission to water
BOD5, Biological Oxygen Demand mg 6.11x10⁵
COD, Chemical Oxygen Demand mg 2.54 x10⁶
Solved substances mg 4.2 x10⁷
Suspended substances, unspecified mg 1.43 x10⁶
Waste
Process waste t 0.38 Sand and peel
(70%) Treatment, potato starch production effluent, to wastewater treatment,
class 2/CH L 19,000
Disposal, gypsum, 19.4% water, to inert material landfill/CH t 0.38
As the tapioca starch was sourced in Thailand the Thai electricity mix was modelled (Table 11), using statistic data of the International Energy Agency (IEA) [24] since no data were available in the Ecoinvent 2.2 database.
Table 11 Electricity mix in Thailand (2007) – EIA statistics
Electricity Percentage share
Unit: GWh Production from: - coal 30.681 21.4% - oil 3.848 2.7% - gas 96.542 67.3% - biomass 4.190 2.9% - waste 0 - - nuclear 0 - - hydro 8.114 5.7% - geothermal 3 Negligible - other sources 0 - Total Production 143.378 100% Imports 4.491 3% Exports -926 0.6%
Imports (i.e. 3%) were not accounted in the mix since no data about the used technologies were available. The technology of the different electricity power plants reflected the European context since all the datasets used for modelling Thai electricity mix came from Ecoinvent 2.2. Also transformation from high voltage to medium voltage and distribution losses were those representative for EU. To notice (Table 11) how the Thai mix is heavily based on fossil resources (>90%).
Other component – polymer
In addition to starch and natural additives, the prototype granule preferably contains another polymer of synthetic or natural origin but always biodegradable. In the case of natural polymers these are preferably selected from cellulose, lignin and other many sources. As far as synthetic polymers are concerned, these may also be obtained from fermentation and are advantageously selected from several polymer families like polyesters and co-polyesters, vinyl polymers, synthetic rubber etc.
In Table 12 the inventory data related to a synthetic polymer manufacturing belonging to a one of the polymer family suitable for such purposes are shown. For confidentiality reasons the intermediates, the polymer and co-products were reported in the inventory as generic names. Energy inputs considered for the polymer production were average industrial data of the organic chemical sector [25]. The polymer was sourced in Italy.
Table 12 Inventory data for polymer production
Unit Amount Note
Product and co-product in output
Polymer kg 0.511 Allocation mass: 37.3%
Chemical (co-product) kg 0.859 Allocation mass: 62.7%
Input
Material
Raw material A, at plant/RER kg 0.999
Raw material B, at plant/GLO U kg 0.372
Energy
Electricity, medium voltage, at grid/IT MJ 0.6
Heat, heavy fuel oil, at industrial furnace 1MW/RER U MJ 0.15 Steam, for chemical processes, at plant/RER U kg 2.33
Raw material transports
The prototype raw materials transports from the place where they are produced to Italy (Terni) were included in the analysis. The details are shown in Table 13. Among them, tapioca starch has the highest relevant transport phase since it was sourced in Thailand.
Table 13 Inventory data for prototype raw materials transports
Raw material Type Distance (km) Transport characteristics
Tapioca starch Sea 12873 Transoceanic freight ship
Road 200 Lorry 32 t
Other components –
polymer Road 392 Lorry 32 t
EPS granule
Polystyrene belongs to Styrenics which is a family of major plastic products that use Styrene as their key building block. The production of Styrene monomer can be thought of as replacing one of the hydrogen atoms in ethylene by a benzene ring (C6H6) as shown in Figure 7.
Figure 7 Reaction scheme for producing polystyrene (adapted from PlasticEurope Eco-profile [26])
Polystyrene’s production route is shown in Figure 8. Three main forms can be obtained: crystal or general purpose polystyrene (GPPS), high impact polystyrene (HIPS) and expandable polystyrene (EPS).
-Figure 8 Polystyrene’s production route (adapted from PlasticsEurope Eco-profile [26])
With regard to EPS, this material is widely used in building and construction sector (70%) due to their main properties: thermal insulation ability and low weight. The second most important application (25%) is related to the packaging sector such as cushioning of valuable goods and food packaging. Polystyrene is the fourth biggest polymer produced in the world after polyethylene, polyvinyl chloride and polypropylene. The total demand in 2001 was around 10.6 million t. Europe contributes 26 percent to the global demand for polystyrene and was approximately 2.7 million t in 2001, where packaging applications accounted for 37% (i.e. 1 million t) [27]. According to the Eco-profiles of PlasticsEurope, for each kg of EPS produced about 0.64 kg of oil and 0.33 kg of natural gas of feedstock are required [26].
Table14 Inventory for 1 kg of EPS (source: Ecoinvent 2.2 database based on Eco-profiles of PlasticsEurope) Unit Amount Product in output EPS (granule) kg 1 Input Resources
Oil, crude, in ground kg 1.0429
Gas, natural, in ground m3 9.08x10⁻¹
Coal, hard, unspecified, in ground kg 1.46x10⁻¹
Coal, brown, in ground kg 3.09x10⁻⁵
Peat, in ground kg 0.000853
Wood, unspecified, standing/m3 m3 8.27x10⁻⁸
Energy, potential (in hydropower reservoir), converted MJ 2.27x10⁻¹
Uranium, in ground kg 6.54x10⁻⁶
Energy, gross calorific value, in biomass MJ 1.93x10⁻¹
Barite, 15% in crude ore, in ground kg 1.29x10⁻⁶
Aluminium, 24% in bauxite, 11% in crude ore, in ground kg 1.75x10⁻⁴
Clay, bentonite, in ground kg 8.29x10⁻⁵
Anhydrite, in ground kg 8.42x10⁻⁶
Calcite, in ground kg 3.88x10⁻⁴
Clay, unspecified, in ground kg 1.15x10⁻⁷
Chromium, 25.5% in chromite, 11.6% in crude ore, in ground kg 2.33x10⁻⁸ Copper, 0.99% in sulfide, Cu 0.36% and Mo 8.2E-3% in crude ore, in ground kg 1.89x10⁻⁴
Dolomite, in ground kg 4.26x10⁻⁶
Iron, 46% in ore, 25% in crude ore, in ground kg 3.47x10⁻⁴
Feldspar, in ground kg 2.73x10⁻¹⁶
Manganese, 35.7% in sedimentary deposit, 14.2% in crude ore, in ground kg 4.48x10⁻⁷
Fluorspar, 92%, in ground kg 1.50x10⁻⁵
Granite, in ground kg 4.94x10⁻¹³
Gravel, in ground kg 1.28x10⁻⁶
Cinnabar, in ground kg 8.98x10⁻⁹
Magnesite, 60% in crude ore, in ground kg 2.45x10⁻¹⁰
Nickel, 1.98% in silicates, 1.04% in crude ore, in ground kg 2.73x10⁻⁵
Olivine, in ground kg 3.26x10⁻⁶
Lead, 5.0% in sulphide, Pb 3.0%, Zn, Ag, Cd, In, in ground kg 5.62x10⁻⁷
Phosphorus, 18% in apatite, 12% in crude ore, in ground kg 1.56x10⁻¹¹
Sylvite, 25 % in sylvinite, in ground kg 6.42x10⁻⁶
Sulfur, in ground kg 1.98x10⁻⁴
Sand, unspecified, in ground kg 5.64x10⁻⁴
Shale, in ground kg 2.38x10⁻⁵
Sodium chloride, in ground kg 2.27x10⁻³
Sodium nitrate, in ground kg 7.35x10⁻¹⁰
Zinc, 9.0% in sulfide, Zn 5.3%, Pb, Ag, Cd, In, in ground kg 2.57x10⁻⁵
Water, unspecified natural origin/m3 m3 4.73x10⁻³
Water, river m3 6.68x10⁻⁴
Water, well, in ground m3 2.78x10⁻¹⁰
Water, cooling, unspecified natural origin/m3 m3 1.65x10⁻¹
Output
Emissions to air
Heat, waste MJ 42.383
Particulates, > 10 um kg 2.84x10⁻⁴
Particulates, > 2.5 um, and < 10um kg 3.81x10⁻⁴
Particulates, < 2.5 um kg 2.22x10⁻⁴
Carbon monoxide, fossil kg 3.77x10⁻³
Carbon monoxide, biogenic kg 7.54x10⁻⁶
Carbon dioxide, fossil kg 2.5405
Carbon dioxide, biogenic kg 5.09x10⁻³
Sulfur dioxide kg 7.00x10⁻³ Hydrogen sulphide kg 1.19x10⁻⁸ Nitrogen oxides kg 4.84x10⁻³ Ammonia kg 7.35x10⁻⁹ Chlorine kg 9.82x10⁻⁷ Hydrogen chloride kg 5.95x10⁻⁵ Fluorine kg 3.59x10⁻⁸ Hydrogen fluoride kg 2.20x10⁻⁶
NMVOC, non-methane volatile organic compounds, unspecified origin kg 5.17x10⁻³
Aldehydes, unspecified kg 1.08x10⁻¹³ Lead kg 2.75x10⁻⁷ Mercuri kg 1.84x10⁻⁹ Sulfate kg 7.51x10⁻¹⁵ Dinitrogen monoxide kg 2.15x10⁻⁸ Hydrogen kg 6.00x10⁻⁵ Ethane, 1,2-dichloro- kg 1.57x10⁻⁹ Ethene, chloro- kg 7.59x10⁻¹⁰ Hydrocarbons, chlorinated kg 6.82x10⁻⁷ Cyanide kg 2.00x10⁻¹⁸ Methane, fossil kg 3.12x10⁻² Methane, biogenic kg 6.25x10⁻⁵ Hydrocarbons, aromatic kg 2.82x10⁻⁵
Hydrocarbons, aliphatic, alkanes, cyclic kg 5.59x10⁻⁶
Carbon disulfide kg 4.25x10⁻⁹ Methane, dichloro-, HCC-30 kg 3.01x10⁻⁹ Copper kg 6.87x10⁻⁸ Arsenic kg 1.02x10⁻⁸ Cadmium kg 1.16x10⁻⁹ Silver kg 1.02x10⁻⁹ Zinc kg 3.24x10⁻⁸ Chromium kg 2.83x10⁻⁶ Selenium kg 3.5x10⁻¹¹ Nickel kg 5.15x10⁻⁶ Antimony kg 3.33x10⁻¹¹
Ethene kg 6.66x10⁻⁶ Benzene kg 1.83x10⁻⁵ Toluene kg 2.54x10⁻⁶ Xylene kg 1.06x10⁻⁶ Benzene, ethyl- kg 5.30x10⁻⁶ Styrene kg 4.51x10⁻⁵ Propene kg 4.93x10⁻⁶ Methane, chlorodifluoro-, HCFC-22 kg 1.12x10⁻⁶ Emissions to water
COD, Chemical Oxygen Demand kg 1.92x10⁻³
BOD5, Biological Oxygen Demand kg 2.69x10⁻⁴
Lead kg 2.05x10⁻⁹ Iron, ion kg 4.34x10⁻⁸ Sodium, ion kg 2.81x10⁻⁴ Acidity, unspecified kg 7.82x10⁻⁶ Nitrate kg 8.27x10⁻⁶ Mercury kg 1.95x10⁻¹⁰ Ammonium, ion kg 2.93x10⁻⁵ Chloride kg 5.65x10⁻⁴ Cyanide kg 3.29x10⁻¹¹ Fluoride kg 3.77x10⁻⁷ Sulfide kg 1.83x10⁻⁷ Hydrocarbons, unspecified kg 1.64x10⁻⁴
Suspended solids, unspecified kg 1.75x10⁻³
Oils, unspecified kg 3.70x10⁻⁵
Chlorinated solvents, unspecified kg 3.36x10⁻⁸
Chlorine kg 2.14x10⁻⁸ Phenol kg 4.10x10⁻⁷ Solved solids kg 1.18x10⁻³ Phosphorus kg 6.29x10⁻⁵ Nitrogen kg 3.20x10⁻⁶ Sulfate kg 4.00x10⁻⁴ Ethane, 1,2-dichloro- kg 2.46x10⁻¹¹ Ethene, chloro- kg 1.72x10⁻¹¹ Potassium, ion kg 2.03x10⁻⁷ Calcium, ion kg 1.63x10⁻⁵ Magnesium kg 5.22x10⁻⁹ Chromium, ion kg 8.71x10⁻¹² Chlorate kg 6.09x10⁻⁷ Bromate kg 3.28x10⁻⁹
TOC, Total Organic Carbon kg 3.82x10⁻⁵
AOX, Adsorbable Organic Halogen as Cl kg 6.05x10⁻⁸
Aluminium kg 1.10x10⁻⁶
Zinc, ion kg 3.78x10⁻⁸
Copper, ion kg 1.85x10⁻⁷
Carbonate kg 1.15x10⁻⁴ Arsenic, ion kg 8.29x10⁻¹⁰ Cadmium, ion kg 2.92x10⁻¹¹ Manganese kg 2.63x10⁻¹⁰ Tin, ion kg 4.4x10⁻¹⁴ Strontium kg 5.05x10⁻¹¹ Benzene kg 1.63x10⁻⁶ Molybdenum kg 7.24x10⁻⁹ Sulfite kg 6.4x10⁻⁹ Waste to treatment
Disposal, facilities, chemical production/RER U kg 1.11x10⁻⁴
Disposal, tailings from hard coal milling, in impoundment/GLO U kg 7.88x10⁻³ Disposal, spoil from coal mining, in surface landfill/GLO U kg 4.55x10⁻² Disposal, municipal solid waste, 22.9% water, to municipal incineration/CH U kg 2.70x10⁻² Disposal, average incineration residue, 0% water, to residual material landfill/CH U kg 1.55x10⁻² Disposal, wood untreated, 20% water, to municipal incineration/CH U kg 1.19x10⁻⁴ Disposal, plastics, mixture, 15.3% water, to municipal incineration/CH U kg 1.90x10⁻³ Disposal, hazardous waste, 25% water, to hazardous waste incineration/CH U kg 1.20x10⁻²
3.2.2 Packaging production (Stage 2)
Stage 2 addressed the granule expansion so as to get a foamed pck material. For EPS, average industrial data were considered, whereas for the prototype primary data were used as they were directly collected from the partner involved in the semi-industrial pilot plant development.
Prototype granule expansion
The core of the REBIOFOAM project was the development of an innovative manufacturing process for the production of foamed 3D-shaped packaging material originating from expandable starch-based polymer granule. In this new process, expansion of the granules was driven by microwave technology that heating up exploits the inner water content of the material to generate vapour at high pressure, which triggers the foaming process. Nevertheless so as to meet the functional requirements for the innovative protective packaging three fundamental development steps were overcome. These were:
1. The achievement of a proper formulation (i.e. blend of raw materials) and processing conditions so as to get a suitable prototype granule (e.g. water content, peel thickness etc.) for the subsequent microwave expansion (Figure 9).
Figure 9 Granule peel influences microwave expansion (source : Novamont)
2. The achievement of a adequate foaming of the bio-based polymer, in terms of expanded cell’s size and conformation/shape, cell’s morphology, and, finally, mechanical characteristics and cushion behaviour of the expanded samples. This implied a carefully evaluation effects of microwave fields (e.g. thermal homogeneity), an efficient design of the microwave oven and finally, an efficient tuning of the operational parameters required for the expansion.
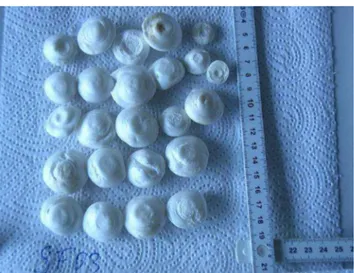
Figure 10 Example of foamed granules with mean diameter of round granules: D = 28.5 mm (source: Novamont)
3. An adequate mould design accomplished for successful processing of moulded, 3D-shaped, foam products. To this extent, a thorough comparison of dielectric properties of mould materials as well as a careful selection of the most appropriate material for mould construction, guaranteeing proper adhesion to the substrate while achieving at the same time inherent surface temperature control, was achieved. At the same time, the occurrence of viscous shear stresses at the foam / mould interface was minimized, thus facilitating complex 3Dshaping during the moulding process, through the proper design of the mould surface.
Based on the experimental outcomes focusing on points 1, 2 and 3 and other technical-economic considerations in May 2011, a flow sheet of material and energy balances about prototype process in pilot scale were designed by
involved partners in the development of the pilot line. The pilot line was a rotary machine able to produce around 120 pcs/h (port-hole spacers) in a semi-automatic way made of four different steps represented in Figure 11. The achieved density of the prototype pck was of 40 kg/m3 .
The process consisted of four stages: storage and dosing unit for granules, microwave system for foaming granules, extraction stage for removing the product and conditioning unit for cooling or heating mould before restarting process.
In general, the pilot line has a central shaft able to turn around a main table. On this table four plates were jointly installed and on each plate as installed only one mould. A central table was able to turn around in order to transfer each plate supporting the mould from a station to another one. Figure 12 showed the assembling semi-industrial pilot.
Figure 12 Assembling the pilot line (source: REBIOFOAM consortium)
The expansion process for prototype pck requires only electricity for its operation: neither thermal energy nor blowing agents are needed. Inventory data here reported reflected a pilot line designed to produce 120 pieces/h with a time cycle of 30 seconds.
The pilot machine has been fully industrial-oriented and was able to manage the foaming process in continuous state. The machine has been supposed to be equipped with four stations supporting one-half mould each (see also Figure 11). To point out that the level of scale-up from the pilot line depends on the production capacity definition to be able to identify the technology fulfils technical requirements. As in many industrial cases, the pilot line is technologically different with respect to a higher production capacity plant, where efficiency and reliability are enhanced. Up to a limited scaling-up, the machine concept keeps the same; whereas for larger scales the machine type could change. In our case this aspect was not investigated.
Figure 13 Mass balance for expansion (prototype pck)
Table 15 Inventory for expansion (figures related to 100 pcs prototype pck)
Unit Amount Product in output 100 port-hole spacers kg 2.4 Input Material Starch-based granules kg 3.0 Energy
Electricity, medium voltage, at grid/IT U (undoped mould) kWh 4.7
Output
Emission to air
Water kg 0.6
The partitioning of electricity consumption for expansion is provided in Figure 14.
To notice that the microwave system dominated the overall electricity consumption for expansion process. Calculations about the electricity consumption were done considering the installed power for each component (see Figure 11), operational time and other parameters according to the typology of the component itself.
Port-hole spacer surface
An important aspect related to the expansion process for prototype pck was the achievement of a proper refined surface of the end product (i.e. port-hole spacer). Many research activities were performed so as to handle this aspect. For example the influence of mould temperature on foamability was investigated finding out that per-heating the mould allows to achieve better samples. The most promising solutions identified were:
to heat the mould with a IR system (inventory data presented in Table 15 are referred to this option)
to dope the mould with iron-based layer that when exposed to microwave electromagnetic field increases the temperature of the mould surface.
Both solutions permitted to optimize the granules flow within the mould (before the expansion) thus achieving a more refined end product (i.e. port-hole space), however, the IR system seemed to be preferable to the doped mould, as the absence of a doped layer allowed to optimize the irradiation time (also according to analysis carried out in WP3 and WP4) thus reducing electricity consumption. The expansion with a doped mould was, anyhow, addressed in the sensitivity analysis. The estimated electricity consumption for the microwave system using a doped mould was approximately twofold higher compared to IR system.
EPS granule expansion
Before being formed into the final article (i.e. port-hole spacer), the EPS beads need to be processed. When these expandable pearls are heated with steam, they expand to about 40 times their original size (i.e. pre-foaming). After a stabilisation period - maturing - the expanded beads are then transferred to a mould. Further steam-heating makes them fuse together to form a rigid foam containing 98% air. Finally, the foam can then easily be cut into the desired shape [28]. The figure 15 below summarizes the expansion steps.
Figure 15 EPS granule expansion steps and related timing
Table 16 Inventory data for the foaming expanding EPS process (data per kg of EPS foamed product)
Per kg output Unit
Ecoinvent database Literature Primary data
This study Habrsatter et al (1998) Ritcher et al (1995) LCA study on EPS pck systems [29] Company 1 Company 2 Company 3 Company 1 Company 2 Input Material input EPS granulate kg 1.008 1.075 1 1.065 1.065 Compressed air M3 1.053 2.61 1.053 Water process kg 5.9 0.661 3.8 5.9
Water cooling kg closed sys. -
Energy input
Electricity kWh 0.57 0.805 0.788 0.14 0.4 0.95 0.9 0.8
Natural gasa) MJ - - - 0.1 28.1 - 32.2
32b)
Light fuel oil MJ - - 0.141 4.91 - - -
Heavy fuel oil MJ 59.1 19 2.72 - - 34.2 -
Diesel, MJ - - 0.056 - - - - Lubricating oil kg 0.0087 - Output Emission to air Heat waste MJ 2.84 - Pentane G 37.4 43 15 37.4 Particulates G 0.0204 0.0204 VOC G 0.1401 0.1401 Nitrogen oxides G 0.0204 0.0204 Sulfur oxides G 3.269 3.269 Emission to water COD mg 226 226 BOD5 mg 79.4 79.4 Suspended substances mg 39.69 39.69 Organic substances mg 0.397 0.397 Waste Waste to recycling kg 0.064 0.064 Disposal to incineration kg 0.001 0.001
Empty cells: data not available; a) Calorific value for natural gas: 40.3 MJ/Nm3; b) avg value (primary data), supplied 50% from natural gas and 50% from heavy fuel oil (assumption)
Representing data for EPS used in packaging sector Representing data for EPS used in building sector
Three out off six sources referred to primary data provided by three different companies that produced EPS pck products. For confidential reasons they were named “company 1, 2 and 3”. Among them, the figures on thermal energy were quite homogeneous whereas the electricity consumption for company 1 was two times lower compared to companies 2 and 3. To notice that the figures from Ecoinvent 2.2 database were quite close to primary ones with
the exception of thermal energy reported in the Ritcher et al. source. In that case it could be argued that such a difference could be associated with a different technology for producing EPS for building sector compared to EPS for packaging purposes. Finally the literature source, related to an LCA study on EPS pck systems [29], reported inventory data for electricity and heat consumptions significant lower compared to those reported on all other sources.
At the end it was decided to consider for EPS expansion the most representative inventory data, also taking into account the primary sources available. These were reported in the last column on the right side of Table 16. To point out that the figures in blue were not accounted for in the impact assessment since the level of detail was higher compared to the data collected for the prototype process, so to keep the systems as more homogeneous as possible they were left out. Only pentane emissions were accounted for since, they represent a well recognized and specific emission of EPS expansion process.
IMPORTANT NOTE
The use phase for the port-hole spacer consisted of its utilization within washing machine packaging and shipment phases. For such phases no valuable differences were identified between prototype and EPS pck systems, therefore they were not taken into account.
3.2.3 Packaging disposal (Stage 3)
As soon as the pck system has fulfilled its (short) duty, it has to be disposed of according to its characteristics like material recyclability or compostability and waste management systems running across the countries in which the washing machines were sold. Thanks to the (tested) compostability of the prototype pck it was assumed to be suitable for biological recycling through an industrial composting process. Consequently it was assumed to be collected along with household bio-waste fraction. Compostability is a crucial feature of the prototype pck because it opens to new routes of waste treatments contributing in diversion from landfill. In APPENDIX A biodegradation and compostability tests performed on the prototype along with achieved results were reported.
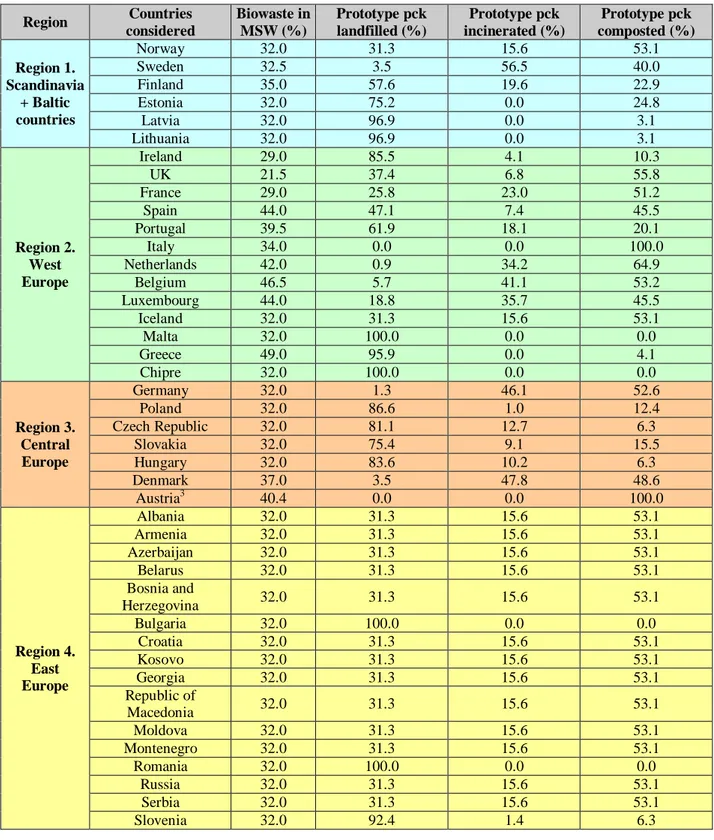
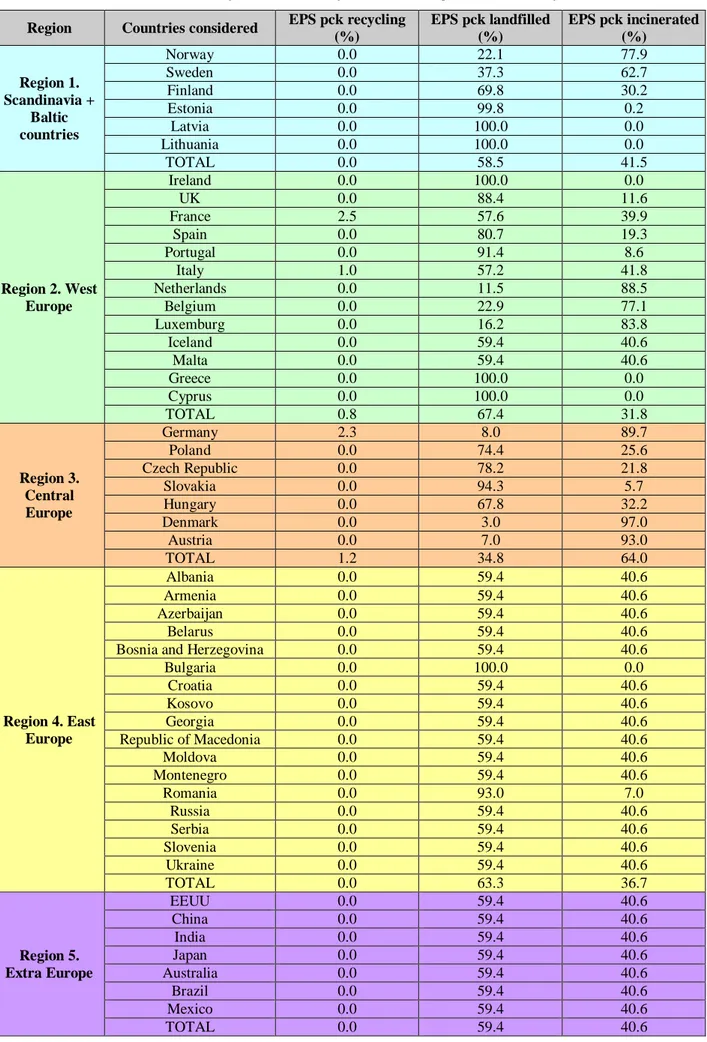
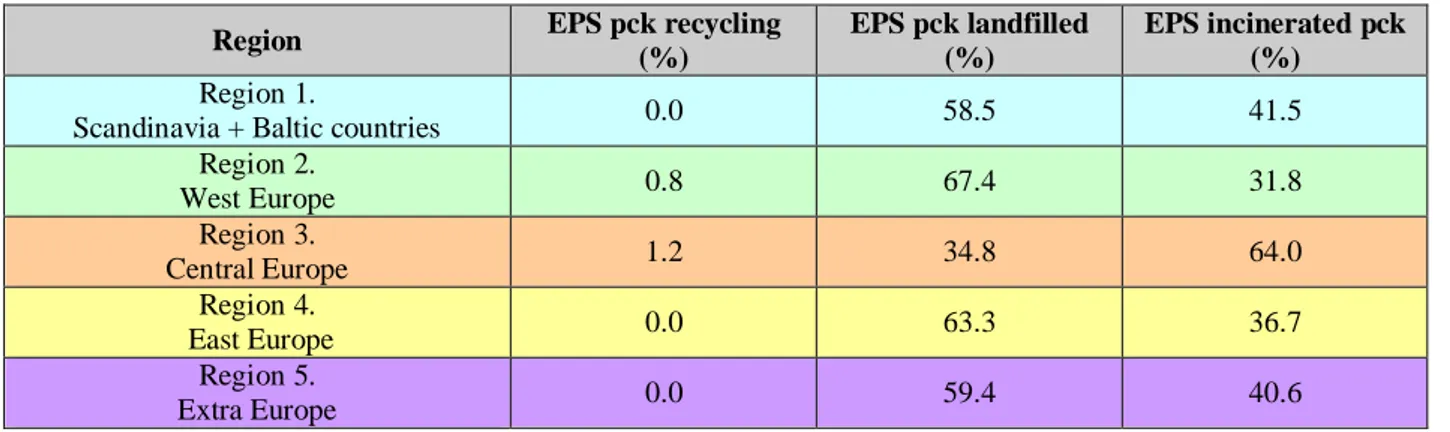
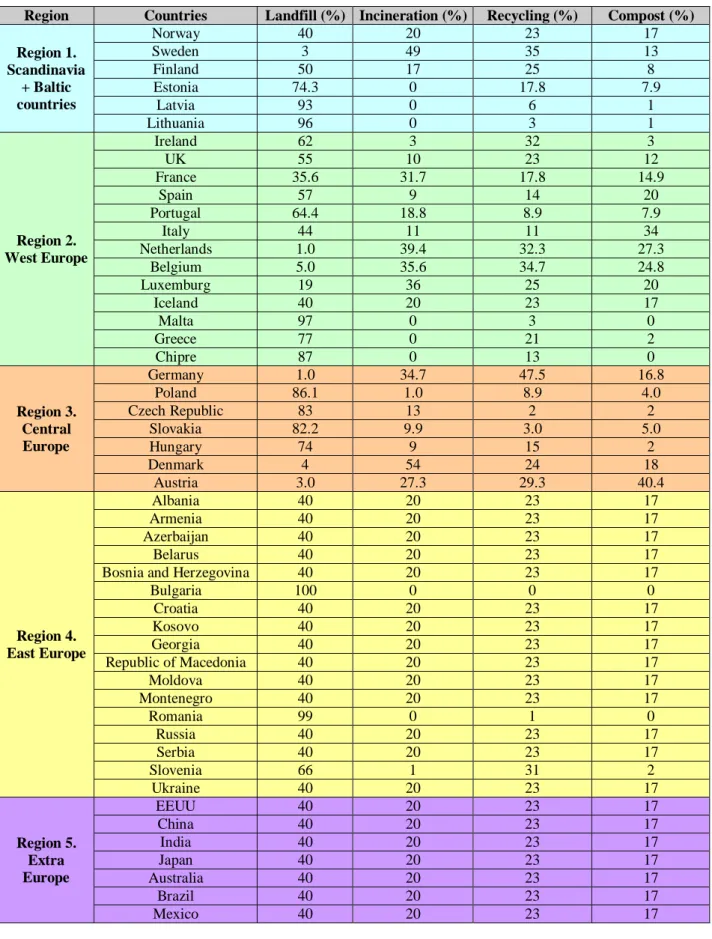
In this study, the “basic” disposal scenario reflected, as more as possible, the real fate of both pck systems. To this end statistic data on waste management [30] along with data on washing machines distribution were matched. The latter data, provided directly from the project partner, were of extreme importance for the reliability of the model since according to Eurostat 2008 data on waste management there was a very high variation on waste treatments across European countries: for example landfill passed from ≈1% in the Netherlands up to ≈100% in Bulgaria. However, a sensitivity analysis considering different EoL disposals was performed (see § 4.2.3).
To set a real End of Life (EoL) scenario for EPS pck and prototype one, the following methodological approach was adopted. It consisted of four steps.
![Table 19 End of life scenario of Municipal Solid Waste in the EU countries. [30]](https://thumb-eu.123doks.com/thumbv2/123dokorg/2788718.1637/40.892.99.815.339.1068/table-end-life-scenario-municipal-solid-waste-countries.webp)
![Table 22 Organic part in the MSW in different European countries. Source: Eunomia. Research and consulting [32]](https://thumb-eu.123doks.com/thumbv2/123dokorg/2788718.1637/44.892.93.817.343.786/organic-different-european-countries-source-eunomia-research-consulting.webp)