original
reports
Negative Hyperselection of Patients With
RAS
and
BRAF Wild-Type Metastatic Colorectal
Cancer Who Received Panitumumab-Based
Maintenance Therapy
Federica Morano, MD1; Salvatore Corallo, MD1; Sara Lonardi, MD2; Alessandra Raimondi, MD1; Chiara Cremolini, MD, PhD3; Lorenza Rimassa, MD4; Roberto Murialdo, MD5; Alberto Zaniboni, MD6; Andrea Sartore-Bianchi, MD7,8; Gianluca Tomasello, MD9; Patrizia Racca, MD10; Matteo Clavarezza, MD11; Vincenzo Adamo, MD12; Federica Perrone, PhD1; Annunziata Gloghini, PhD1; Elena Tamborini, PhD1; Adele Busico, MD1; Antonia Martinetti, MDSc1; Federica Palermo, MDSc1; Fotios Loupakis, MD, PhD2; Massimo Milione, MD, PhD2,3; Giovanni Fuc `a, PhD1; Maria Di Bartolomeo, MD1; Filippo de Braud, MD1,8; and Filippo Pietrantonio, MD1,8
abstract
PURPOSE
We assessed the prognostic/predictive role of primary tumor sidedness and uncommon alterations of
anti
–epidermal growth factor receptor (EGFR) primary resistance (primary resistance in RAS and BRAF
wild-type metastatic colorectal cancer patients treated with anti-EGFR monoclonal antibodies [PRESSING] panel) in
patients with
RAS/BRAF wild-type (wt) metastatic colorectal cancer (mCRC) who were randomly assigned to
panitumumab plus
fluorouracil, leucovorin, and oxaliplatin (FOLFOX-4) induction followed by maintenance with
panitumumab with or without
fluorouracil (FU) plus leucovorin (LV); Valentino trial (ClinicalTrials.gov identifier:
NCT02476045).
PATIENTS AND METHODS
This prespeci
fied retrospective analysis included 199 evaluable patients with RAS/
BRAF wt. The PRESSING panel included the following: immunohistochemistry (IHC) and in situ hybridization for
HER2/MET amplification, IHC with or without RNA sequencing for ALK/ROS1/NTRKs/RET fusions,
next-generation sequencing for
HER2/PIK3CAex.20/PTEN/AKT1 and RAS mutations with low mutant allele
frac-tion, and multiplex polymerase chain reaction for microsatellite instability. PRESSING status (any positive
biomarker
v all negative) and sidedness were correlated with overall response rate (ORR), progression-free
survival (PFS), and overall survival (OS) in the study population and by treatment arm.
RESULTS
Overall, left- and right-sided tumors were 85.4% and 14.6%, respectively, and PRESSING-negative
and -positive tumors were 75.4% and 24.6%, respectively. At a median follow-up of 26 months, inferior
outcomes were consistently observed in right- versus left-sided tumors for ORR (55.2%
v 74.1%; P = .037), PFS
(8.4
v 11.5 months; P = .026), and OS (2-year rate: 50.2% v 65.1%; P = .062). Similar results were observed in
the PRESSING-positive versus PRESSING-negative subgroup for ORR (59.2%
v 75.3%; P = .030), PFS (7.7 v
12.1 months;
P , .001), and OS (2-year rate: 48.1% v 68.1%; P = .021). The PFS benefit of FU plus LV added to
panitumumab maintenance, reported in the study, was independent from sidedness and PRESSING status
(interaction for PFS
P = .293 and .127, respectively). However, outcomes were extremely poor in patients who
received single-agent panitumumab and had right-sided tumors (median PFS, 7.7 months; 2-year OS, 38.5%)
or PRESSING-positive tumors (median PFS, 7.4 months; 2-year OS, 47.0%).
CONCLUSION
The combined assessment of sidedness and molecular alterations of anti-EGFR primary resistance
identi
fied a consistent proportion of patients with RAS/BRAF–wt mCRC who had inferior benefit from initial
anti-EGFR
–based regimens, particularly after maintenance with single-agent anti-EGFRs.
J Clin Oncol 37:3099-3110. © 2019 by American Society of Clinical Oncology
Licensed under the Creative Commons Attribution 4.0 License
INTRODUCTION
The decision-making algorithm of the treatment of
patients with metastatic colorectal cancer (mCRC) has
deeply changed in the recent years, and it should now
take into account both clinical and tumor
molecu-lar features. Since the introduction of anti
–epidermal
growth factor (EGFR) monoclonal antibodies, the
progressive refinement of the negative selection
par-adigm has led to notable improvements of patients
’
outcomes.
1All current guidelines recommend
con-sideration of an anti-EGFR
–based first-line therapy
after the evaluation of
RAS and BRAF mutational
ASSOCIATED CONTENT See accompanying Editorial on page3066 Appendix Author affiliations and support information (if applicable) appear at the end of this article. Accepted on July 11, 2019 and published at jco.orgon September 20, 2019: DOIhttps://doi.org/10. 1200/JCO.19.01254status in addition to assessment of primary tumor sidedness.
2,3Because of the negative predictive role of
RAS and BRAF
mutations and right sidedness, patients with left-sided,
RAS
and
BRAF wild-type mCRC currently are regarded as optimal
candidates for anti-EGFR agents alone or in combination
with chemotherapy.
4-9However, several gaps in knowledge
about primary resistance to EGFR inhibition exist, and more
negative predictive biomarkers would be clinically useful in
both left- and right-sided primary tumors.
In a recent case-control study in patients with
RAS and
BRAF wild-type mCRC treated with single-agent anti-EGFR
therapy,
10we demonstrated the promising negative
pre-dictive impact of a panel of uncommon molecular
alter-ations linked to primary resistance to EGFR inhibition.
This panel, the Primary resistance in
RAS and BRAF
wild-type metastatic colorectal cancer patients treated with
anti-EGFR monoclonal antibodies (PRESSING) panel, includes
HER2 amplification/activating mutations; MET
amplifica-tion;
NTRK/ROS1/ALK/RET rearrangements; PIK3CA exon
20, and
PTEN and AKT1 mutations.
Here, we present the results of a prespeci
fied exploratory
analysis of the Valentino study (ClinicalTrials.gov identi
fier:
NCT02476045) to investigate the prognostic role of tumor
sidedness and PRESSING panel in patients with
RAS and
BRAF wild-type mCRC who were randomly assigned to
maintenance with either single-agent panitumumab or
panitumumab plus
fluorouracil and leucovorin (FU + LV)
after a 4-month induction with panitumumab plus
fluoro-uracil, leucovorin, and oxaliplatin (FOLFOX-4).
PATIENTS AND METHODS
Study Population
The Valentino study was a multicenter, randomized,
open-label, phase II trial that investigated the progression-free
sur-vival (PFS) noninferiority of maintenance with single-agent
panitumumab (arm B) versus panitumumab plus FU plus
LV (arm A) after an induction treatment with panitumumab
plus FOLFOX-4 in patients with
RAS wild-type mCRC.
11The
trial enrolled 229 patients (arm A, n = 117; arm B, n =112) and
showed that maintenance with single-agent panitumumab
is inferior to panitumumab plus FU/LV in terms of PFS.
The main inclusion criteria were as follows:
histologi-cally con
firmed CRC with RAS (exons 2, 3, and 4 of both
KRAS and NRAS) wild-type status confirmed by
ap-proved methods; an Eastern Cooperative Oncology Group
performance score (ECOG PS) of 0 to 1; no previous
treatment of metastatic disease, unresectable
metasta-ses, measurable, or just-evaluable disease according to
RECIST version 1.1; and availability of baseline tumor
samples centrally collected at the coordinating center
(Fondazione IRCCS Istituto Nazionale dei Tumori).
Pa-tients were excluded if they had experienced relapse
during adjuvant oxaliplatin-based chemotherapy or within
12 months from its completion (or within 6 months for
adjuvant
fluoropyrimidine monotherapy) or in case of
notable comorbidities.
For this exploratory analysis, we selected all those patients
enrolled in the trial with at least one radiologic disease
assessment and with tumor tissue specimens obtained
before enrollment and available for a complete molecular
analysis, including PRESSING panel and
RAS/BRAF
mu-tational status centrally determined at the coordinating
center via next-generation sequencing (NGS). Institutional
review board and ethics committee approvals were
ob-tained from all participating centers. All of the patients
provided written informed consent before any study-related
procedures occurred.
Molecular Analyses
The PRESSING panel analysis included the following
genomic alterations, as previously reported:
HER2
amplification/activating mutations; MET amplification;
NTRK/ROS1/ALK/RET rearrangements; PIK3CA exon 20
mutations,
PTEN inactivating mutations, and AKT1
mu-tations.
10Brie
fly, immunohistochemistry (IHC) for HER2/
MET and dual-color silver in situ hybridization for both
genes were performed. IHC analyses for ALK/ROS1/
panTRK/RET were performed as the screening method for
actionable gene fusions; in all samples with evidence of IHC
staining of any intensity/extension, whole-transcriptome
shotgun sequencing (RNA-seq) was performed to
con-firm the presence of specific rearrangements. Oncogenic
mutations in the hotspot regions of 50 cancer-related genes
(Cancer Hotspot Panel v2; ThermoFisher Scienti
fic,
Wal-tham, MA), including
HER2 and PIK3CA/PTEN/AKT1, were
assessed by means of targeted NGS through the Ion Torrent
Personal Genome platform (ThermoFisher Scientific). In
addition, by means of targeted NGS,
RAS and BRAF
mutational status was centrally reassessed with deeper
coverage, and the fractional abundance of
BRAF and RAS
mutant allele fractions (MAFs) was reported after correction
for tumor cellularity.
12On the basis of recent data on microsatellite instability (MSI)
as a poor predictive factor in patients who received
anti-EGFR
–based first-line therapy,
13multiplex
polymerase-chain reaction (PCR) was performed to evaluate MSI status.
For additional details, see the Appendix (online only).
Statistical Analysis
PFS was de
fined as the interval from random assignment
to
first objective documentation of progressive disease (PD)
or death as a result of any cause, whichever occurred
first
(censored at last follow-up for patients alive and without
PD). Overall survival (OS) was the interval from random
assignment to death as a result of any cause (censored at
last follow-up for patients alive). Overall response rate
(ORR) was de
fined as the proportion of patients who
achieved a complete (CR) or partial response (PR).
Bi-nomial two-sided 95% CIs were calculated for ORR.
Sur-vival analyses were performed using the Kaplan-Meier
method and the Cox proportional-hazards model. Variables
with a
P value of , .1 at univariable analysis were entered
into the multivariable models. An interaction term was
included in the statistical models when subgroup analyses
were performed. Median follow-up was calculated by the
reverse Kaplan-Meier approach. The
x
2test, the Fisher
exact test, or the Mann-Whitney
U test was used, as
ap-propriate, to evaluate the association between patient
baseline characteristics and tumor sidedness or PRESSING
panel status. The
x
2test or Fisher exact test was used, as
appropriate, to assess the association between sidedness
and/or PRESSING panel status with ORR. All tests were two
sided at
a of 5%. The analyses were carried out using R
(version 3.5.0) and R Studio (version 1.1.447) and the
survival, survminer, and epitools packages.
RESULTS
Baseline Characteristics
A total of 199 (87%) of the 229 enrolled in the Valentino
study were eligible for this prespecified exploratory analysis.
The CONSORT diagram of the study is illustrated in
Ap-pendix
Figure A1
(online only).
Baseline patients and disease characteristics are listed in
Table 1. Overall, 52.3% and 47.7% patients were treated in
arms A and B, respectively. Left- and right-sided tumors
accounted for 170 (85.4%) and 29 (14.6%) patient cases,
and the PRESSING panel was negative in 150 (75.4%)
patients and positive in 49 (24.6%) patients.
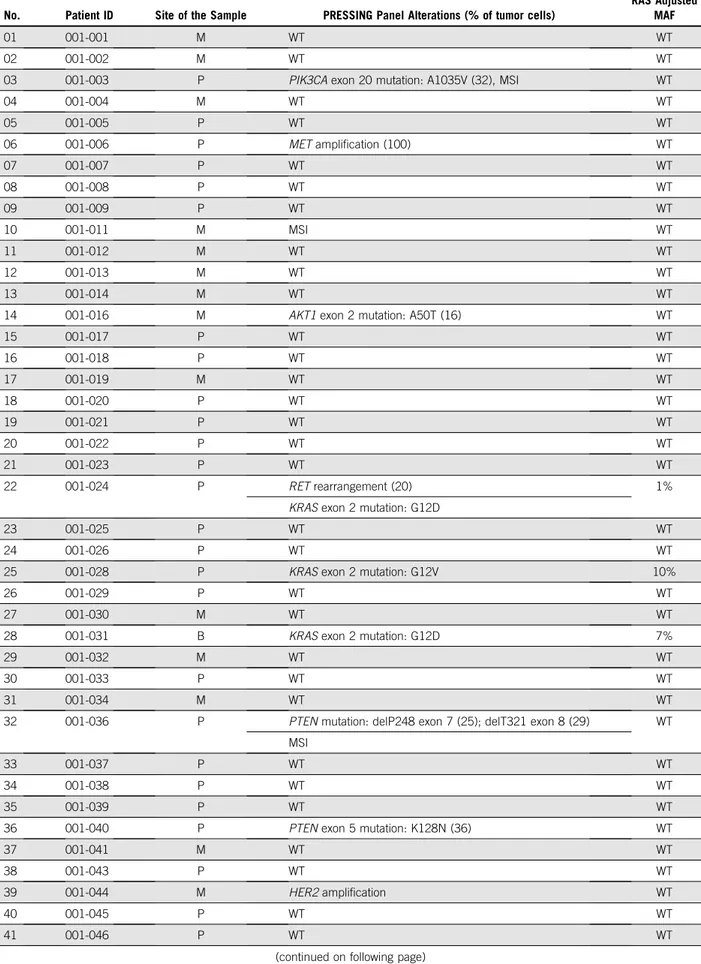
The incidence of the singular molecular alterations
in-cluded in the PRESSING panel is illustrated in
Figure 1
and
listed in Appendix
Table A1
(online only). Notably,
am-plifications of HER2 and MET genes were present in nine
patients (4.5%) and three patients (1.5%), respectively.
Gene fusions were reported in
five patients (2.5%);
spe-ci
fically, three were rearrangements of RET, one was of
ALK, and one was of NTRK. Mutations of PI3KCA exon 20
were found in 10 patients (5.0%); of
PTEN, in six (3.0%);
and of
AKT1, in two (1%). RAS mutations with low MAF
(
, 5%) occurred in 15 patients (7.5%). Overall, MSI-high
status was detected in
five patients (2.5%), of whom two
(40%) had disease associated with speci
fic PRESSING
alterations and only one (20%) had right sidedness.
Regarding the associations between baseline
character-istics and tumor sidedness or PRESSING panel, no
sig-nificant associations were observed except for older age in
right-sided tumors (P = .02). A borderline correlation was
observed between primary tumor sidedness and PRESSING
panel, with a higher rate of PRESSING positivity in
right-sided tumors (37.9%) versus left-right-sided ones (22.3%;
P =
.07;
Table 1).
At the time of this analysis (cutoff on March 30, 2019), the
median follow-up was 26 months (95% CI, 24.6 to 29
months). A total of 167 disease progressions and 85 deaths
occurred. Appendix
Figures A2A and A2B
(online only)
depict, respectively, the PFS (median, 11.1 months) and
OS (median, 30.7 months; 2-year OS rate, 63%) curves in
the whole-study population.
Response Analyses According to Sidedness and
PRESSING Panel
The ORR in the study population was 75.5% (95% CI,
68.4% to 81.5%). According to sidedness, the ORR was
74.1% (95% CI, 66.9% to 80.5%) and 55.2% (95% CI,
35.7% to 73.6%) in left- and right-sided tumors,
re-spectively (odds ratio [OR], 0.43; 95% CI, 0.19 to 0.99;
P =
.037; Appendix
Fig A3A, online only). In PRESSING
pan-el
–negative and –positive tumors, the ORR was 75.3%
(95% CI, 67.6% to 82.0%) and 59.2% (95% CI, 44.2% to
73.0%), respectively (OR, 0.48; 95% CI, 0.24 to 0.95;
P =
.030; Appendix
Fig A3B). The ORR for patients with
PRESSING-positive versus -negative tumors was 77.3%
versus 63.2% (OR, 0.51; 95% CI, 0.23 to 1.12;
P = .080)
in the left-sided subgroup and was 45.6% versus 61.1%
(OR, 0.55; 95% CI, 0.11 to 2.57;
P = .466) in the
right-sided subgroup (Appendix
Fig A3C). Appendix
Table A2
(online only) provides information on sidedness, speci
fic
PRESSING panel alterations, and RECIST response at
in-dividual patient level. Appendix
Table A3
(online only) and
Appendix
Figure A4
(online only) summarize the results in
terms of depth of response and duration of response,
re-spectively, according to sidedness, PRESSING panel
sta-tus, or both.
Prognostic Analyses According to Sidedness and
PRESSING Panel
The PFS was lower in the right-sided versus left-sided
subgroup (median PFS, 8.4
v 11.5 months; hazard ratio
[HR], 1.60; 95% CI, 1.06 to 2.42;
P = .026;
Fig 2A), as was
OS (2-year OS, 50.2%
v 65.1%; HR, 1.71; 95% CI, 0.97 to
2.99;
P = .062;
Fig 2B). In parallel, PFS was lower in the
PRESSING-positive versus PRESSING-negative subgroup
(median PFS, 7.7
v 12.1 months; HR, 1.90; 95% CI, 1.35 to
2.67;
P , .001;
Fig 2C) as well as OS (2-year OS, 48.1%
v
68.1%; HR, 1.71, 95% CI, 1.09 to 2.69;
P = .021;
Fig 2D).
The median PFS of patients with PRESSING-positive
versus PRESSING-negative tumors was 7.8 versus
13.2 months (HR, 2.01; 95% CI, 1.37 to 2.94;
P , .001)
in the left-sided subgroup, and it was 7.7 versus 8.6
months (HR, 1.40; 95% CI, 0.64 to 3.06;
P = .399) in the
right-sided subgroup (Fig 2E). Consistent results were
observed in terms of OS: the 2-year OS of patients with
PRESSING-positive versus -negative tumors was 49.9%
versus 69.7% (HR, 1.78; 95% CI, 1.08 to 2.95;
P = .025)
in the left-sided subgroup and was 40.9% versus 55.6%
(HR, 1.16; 95% CI, 0.41 to 3.25;
P = .786) in the
right-sided subgroup (Fig 2F). Finally, PFS was lower in the
MSI-high versus microsatellite-stable subgroup (median
PFS, 4.1
v 11.1 months; HR, 3.03; 95% CI, 1.24 to 7.42;
P = .015; Appendix
Fig A5A, online only), whereas OS
was similar in the two subgroups (2-year OS, 60.0%
v
62.9%; HR, 1.23; 95% CI, 0.38 to 3.92;
P = .732;
Ap-pendix
Fig A5B, online only).
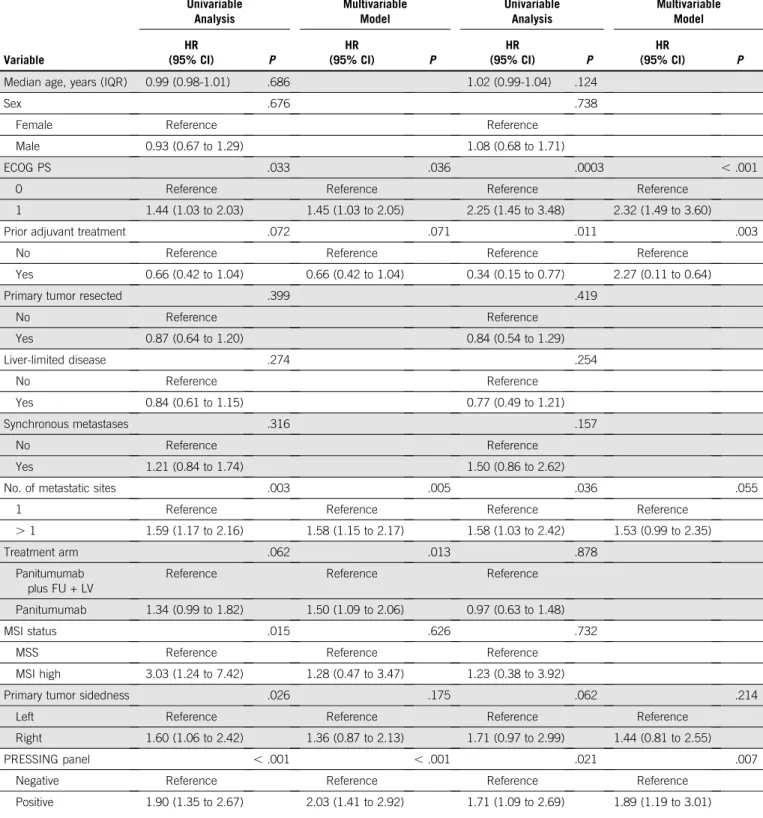
In the univariable analysis for PFS, ECOG PS, number
of metastatic sites (one
v more than one), MSI status,
primary tumor sidedness, and PRESSING panel were
significantly associated with PFS; however, only ECOG PS
(0
v 1), number of metastatic sites (one v more than
one), and PRESSING panel con
firmed their prognostic
value in the multivariable model, whereas sidedness lost
its significance. Similarly, in the univariable analysis for
OS, ECOG PS, prior adjuvant treatment, number of
met-astatic sites, and PRESSING panel were signi
ficantly
associated with OS; ECOG PS, prior adjuvant treatment,
and PRESSING panel were con
firmed in the multivariable
model. In particular, the strongest association with poor
PFS and OS was reported in the multivariable models for
PRESSING-positive tumors (
P , .001 and P = .007,
re-spectively;
Table 2).
TABLE 1. Baseline Characteristics in the Overall Population and According to Sidedness PRESSING Panel Status
Characteristic
Data for All Patients (N = 199)
Data by Sidedness
P
Data by PRESSING Status
P Left (n = 170) Right (n = 29) Negative (n = 150) Positive (n = 49)
Median age, years (IQR) 62 (54-69) 62 (54-68) 68 (61-71) .021 63 (55-69) 61 (52-69) .389
Sex .342 .602 Female 67 (33.7) 55 (32.3) 12 (41.4) 52 (34.7) 15 (30.6) Male 132 (66.3) 115 (67.7) 17 (58.6) 98 (65.3) 34 (69.4) ECOG PS .300 .468 0 146 (73.4) 127 (74.7) 19 (65.5) 112 (74.7) 34 (69.4) 1 53 (26.6) 43 (25.3) 10 (34.5) 38 (25.3) 15 (30.6)
Prior adjuvant treatment .138 .107
Yes 27 (13.6) 26 (15.3) 1 (3.4) 17 (11.3) 10 (20.4)
No 172 (86.4) 144 (84.7) 28 (96.6) 133 (88.7) 39 (79.6)
Primary tumor resected .495 .993
Yes 126 (63.3) 106 (62.4) 20 (69.0) 95 (63.3) 31 (63.3) No 73 (36.7) 64 (37.6) 9 (31.0) 55 (36.7) 18 (36.7) Liver-limited disease .07 .394 Yes 71 (35.7) 65 (38.2) 6 (20.7) 56 (37.3) 15 (30.6) No 128 (64.3) 105 (61.8) 23 (79.3) 94 (62.7) 34 (69.4) Synchronous metastases .124 .060 Yes 157 (78.9) 131 (77.1) 26 (89.7) 123 (82.0) 34 (69.4) No 42 (21.1) 39 (22.9) 3 (10.3) 27 (18.0) 15 (30.6)
No. of metastatic sites .634 .270
1 111 (55.8) 96 (56.5) 15 (51.7) 87 (58.0) 24 (49.0)
. 1 88 (44.2) 74 (43.5) 14 (48.3) 63 (42.0) 25 (51.0)
Treatment arm .734 .841
Panitumumab 95 (47.7) 82 (48.2) 13 (44.8) 71 (47.3) 24 (49.0)
Panitumumab plus FU + LV 104 (52.3) 88 (51.8) 16 (55.2) 79 (52.7) 25 (51.0)
Primary tumor sidedness — .072
Left 170 (85.4) — — 132 (88.0) 38 (77.6)
Right 29 (14.6) — — 18 (12.0) 11 (22.4)
PRESSING panel .072 —
Negative 150 (75.4) 132 (77.7) 18 (62.1) — —
Positive 49 (24.6) 38 (22.3) 11 (37.9) — —
NOTE. Data presented as No. (%) unless otherwise indicated.
Abbreviations: ECOG PS, Eastern Cooperative Oncology Group performance status; FU + LV,fluorouracil plus leucovorin; IQR, interquartile range; PRESSING, primary resistance inRAS and BRAF wild-type metastatic colorectal cancer patients treated with anti-EGFR monoclonal antibodies.
Predictive Analyses According to Sidedness and
PRESSING Panel
Results about the predictive role of sidedness, PRESSING
panel status, or both according to the two treatment arms
are summarized in
Table 3. Primary tumor sidedness was
not signi
ficantly associated with differential effect of the two
maintenance arms in terms of PFS and OS (
P for interaction =
.293 and .068, respectively), although the PFS and OS
bene
fits from maintenance treatment with panitumumab
plus FU plus LV were higher among patients with
right-than with left-sided tumors (Figs 3A and 3B). Similar results
were observed with regard to the predictive effect of the
PRESSING panel for both PFS and OS (P for interaction =
.127 and .450, respectively), although the PFS benefit from
addition of FU plus LV to panitumumab in the maintenance
setting was clearly superior in PRESSING-positive tumors
(Figs 3C and 3D). Consistent results were found when the
predictive role of the PRESSING panel was analyzed with
regard to maintenance treatment arm in the subgroup of
patients with left-sided tumors (Appendix
Table A4, online
only; Appendix
Fig A6, online only), whereas the sample
size was too limited to perform such analyses in the
sub-group of patients with right-sided tumors.
DISCUSSION
In a previous prospective, case-control study, we showed
the potential negative predictive role of the PRESSING
panel, including several genomic alterations selected on
the basis of the most robust and biologically sound
bio-markers of primary resistance to anti-EGFRs beyond
RAS
and
BRAF mutational status and primary tumor
sided-ness.
10In this prespeci
fied exploratory analysis of the
Valentino study, we investigated the potential prognostic
and predictive role of primary tumor sidedness and
PRESSING panel in patients with
RAS and BRAF wild-type
mCRC who were randomly assigned to panitumumab plus
FOLFOX-4 followed by maintenance with either
single-agent panitumumab or panitumumab plus FU plus LV.
We reported that a negative hyperselection beyond
RAS
and
BRAF, obtained through the accurate analysis of
multiple and less frequent genomic alterations included in
the PRESSING panel, combined with the evaluation of
tumor sidedness, allowed better prediction of the outcomes
in this study population. In particular, patients with
left-sided and PRESSING-negative tumors achieved clearly
better outcomes in terms of both PFS and OS, and FU plus
LV
–based maintenance treatment had a positive PFS
im-pact also in this patient subgroup.
Of note, no signi
ficant associations between baseline
char-acteristics and tumor sidedness or PRESSING panel
were observed (except for older age in right-sided tumors).
As expected, the association between sidedness and
PRESSING panel positivity was due to the enrichment of
resistance alterations (except
HER2 amplification) in
right-sided tumors.
10,14-16This correlation may have failed to
achieve statistical significance because of the low number
of right-sided tumors in the study population. However, even
if primary tumor sidedness may be a surrogate marker for
the heterogeneous molecular pro
file of mCRC, primary
re-sistance to anti-EGFRs displayed by right-sided cancers is
not fully explained by the well-known and biologically
vali-dated genomic alterations included in the PRESSING panel
and may be linked to speci
fic gene expression profiles or
miRNAs, such as miR-31-3p.
17,18The results of this study were internally consistent, because
ORR, PFS, and OS were all decreased in right-sided tumors
compared with left-sided ones and in PRESSING-positive
with respect to -negative ones. In the multivariable model,
the PRESSING panel was the strongest prognostic factor
not only in terms of PFS but also with regard to OS.
001-003 001-006 001-011 001-016 001-024 001-028 001-031 001-036 001-040 001-044 002-002 003-006 004-009 004-013 004-022 004-025 005-002 005-006 006-004 007-008 007-010 007-014 007-015 008-004 008-007 008-008 008-009 008-016 009-001 010-005 011-002 011-007 012-002 012-005 012-006 013-004 015-003 015-006 015-008 017-001 017-005 018-001 018-004 021-002 024-001 024-003 025-001 025-002 026-002 HER2 MET PTEN AKT MSI Sidedness PI3KCA exon 20 Gene fusions* Low % RAS†
FIG 1. Heatmap detailing the incidence of the genomic alterations included in the primary resistance inRAS and BRAF wild-type metastatic colorectal
cancer patients treated with anti-EGFR monoclonal antibodies (PRESSING) panel study population. Green indicates amplifications, violet, gene fusions, and red, mutations. Blue indicates patients with high microsatellite instability (MSI) status; gray indicates patients with right-sided tumors. (*) Targeted screening forALK, ROS1, NTRKs, RET fusions; (†) mutant allele fraction , 5%.
0.25 3 0 6 9 12
Time (months)
15 18 21 24 161 170 No. at risk: 147 Left sided Right sided Median PFS (95% CI) 11.5 (10.6 to 13.6) 8.4 (7.0 to 13.1) 1.60 (1.06 to 2.42) ref HR (95% CI) .026 P 116 82 60 39 29 14 24 29 22 12 9 7 5 3 1 0.50 0.75 1.00PFS (proportion)
A
3 0 6 9 12 15 18 21 24 PRESSING neg PRESSING pos Median PFS (95% CI) 12.1 (10.8 to 14.6) 7.7 (7.0 to 10.9) 1.90 (1.35 to 2.67) ref HR (95% CI) < .001 PTime (months)
143 150 No. at risk: 134 109 75 59 38 27 14 42 49 35 19 16 8 6 5 1 0.25 0.50 0.75 1.00PFS (proportion)
C
3 0 6 9 12 15 18 21 24Time (months)
126 132 No. at risk: 119 102 70 55 35 25 13 35 38 28 14 12 5 4 4 1 17 18 15 7 5 4 3 2 1 7 11 7 5 4 3 2 1 0 0.25 0.50 0.75 1.00PFS (proportion)
Left sided and PRESSING neg
Left sided and PRESSING pos
Right sided and PRESSING neg Right sided and PRESSING pos
Median PFS (95% CI) 13.2 (11.1 to 15.4) 7.8 (7.0 to 12.9) 8.6 (7.0 to 18.7) 7.7 (2.1 to NA) 2.01 (1.37 to 2.94) ref 1.40 (0.64 to 3.06) ref HR (95% CI) < .001 .399 P
E
Time (months)
3 0 6 9 12 15 18 21 24 132 132 No. at risk: 127 126 120 114 92 72 57 38 38 37 35 32 29 23 18 13 18 18 17 13 12 11 10 8 6 11 11 9 9 7 7 6 5 3 0.25 0.50 0.75 1.00OS (proportion)
Left sided and PRESSING negLeft sided and PRESSING pos Right sided and PRESSING neg Right sided and PRESSING pos2-year OS rate (95% CI)
69.7 (61.9 to 78.6) 49.9 (35.6 to 69.8) 55.6 (36.8 to 84.0) 40.9 (18.7 to 89.4) 1.78 (1.08 to 2.95) ref 1.16 (0.41 to 3.25) ref HR (95% CI) .0251 .786 P
F
PRESSING neg PRESSING pos2-year OS rate (95% CI)
68.1 (60.6 to 76.4) 48.1 (35.4 to 65.5) 1.71 (1.09 to 2.69) ref HR (95% CI) .021 P
Time (months)
3 0 6 9 12 15 18 21 24 150 150 No. at risk: 144 139 132 125 102 80 63 49 49 46 44 39 36 29 23 16 0.25 0.50 0.75 1.00OS (proportion)
D
Left sided Right sided2-year OS rate (95% CI)
65.1 (57.9 to 73.2) 50.2 (34.4 to 73.2) 1.71 (0.97 to 2.99) ref HR (95% CI) .062 P 0.25 3 0 6 9 12
Time (months)
15 18 21 24 179 170 No. at risk: 164 161 152 143 115 90 70 29 29 26 22 19 18 16 13 9 0.50 0.75 1.00OS (proportion)
B
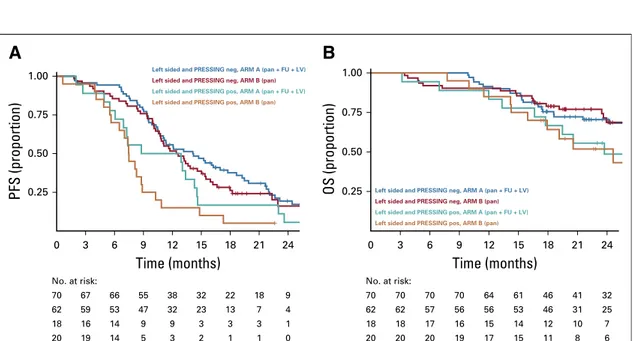
FIG 2. Prognostic analysis according to tumor sidedness and primary resistance inRAS and BRAF wild-type metastatic colorectal cancer patients
treated with anti-EGFR monoclonal antibodies (PRESSING) panel status: Kaplan-Meier curves for (A) progression-free survival (PFS) and (B) overall survival (OS) in patients stratified according to tumor sidedness; (C) PFS and (D) OS according to PRESSING panel status; and (E) PFS and (F) OS according to the combined analysis. HR, hazard ratio; NA, not assessable; ref, reference.
TABLE 2. Univariable and Multivariable Cox Proportional Hazard Regression Models for PFS and OS Variable PFS OS Univariable Analysis Multivariable Model Univariable Analysis Multivariable Model HR (95% CI) P HR (95% CI) P HR (95% CI) P HR (95% CI) P
Median age, years (IQR) 0.99 (0.98-1.01) .686 1.02 (0.99-1.04) .124
Sex .676 .738
Female Reference Reference
Male 0.93 (0.67 to 1.29) 1.08 (0.68 to 1.71)
ECOG PS .033 .036 .0003 , .001
0 Reference Reference Reference Reference
1 1.44 (1.03 to 2.03) 1.45 (1.03 to 2.05) 2.25 (1.45 to 3.48) 2.32 (1.49 to 3.60)
Prior adjuvant treatment .072 .071 .011 .003
No Reference Reference Reference Reference
Yes 0.66 (0.42 to 1.04) 0.66 (0.42 to 1.04) 0.34 (0.15 to 0.77) 2.27 (0.11 to 0.64)
Primary tumor resected .399 .419
No Reference Reference Yes 0.87 (0.64 to 1.20) 0.84 (0.54 to 1.29) Liver-limited disease .274 .254 No Reference Reference Yes 0.84 (0.61 to 1.15) 0.77 (0.49 to 1.21) Synchronous metastases .316 .157 No Reference Reference Yes 1.21 (0.84 to 1.74) 1.50 (0.86 to 2.62)
No. of metastatic sites .003 .005 .036 .055
1 Reference Reference Reference Reference
. 1 1.59 (1.17 to 2.16) 1.58 (1.15 to 2.17) 1.58 (1.03 to 2.42) 1.53 (0.99 to 2.35)
Treatment arm .062 .013 .878
Panitumumab plus FU + LV
Reference Reference Reference
Panitumumab 1.34 (0.99 to 1.82) 1.50 (1.09 to 2.06) 0.97 (0.63 to 1.48)
MSI status .015 .626 .732
MSS Reference Reference Reference
MSI high 3.03 (1.24 to 7.42) 1.28 (0.47 to 3.47) 1.23 (0.38 to 3.92)
Primary tumor sidedness .026 .175 .062 .214
Left Reference Reference Reference Reference
Right 1.60 (1.06 to 2.42) 1.36 (0.87 to 2.13) 1.71 (0.97 to 2.99) 1.44 (0.81 to 2.55)
PRESSING panel , .001 , .001 .021 .007
Negative Reference Reference Reference Reference
Positive 1.90 (1.35 to 2.67) 2.03 (1.41 to 2.92) 1.71 (1.09 to 2.69) 1.89 (1.19 to 3.01)
Abbreviations: ECOG PS, Eastern Cooperative Oncology Group performance status; FU + LV,fluorouracil plus leucovorin; HR, hazard ratio; IQR, interquartile range; MSI, microsatellite instability; MSS, microsatellite stable; OS, overall survival; PFS, progression-free survival; PRESSING, primary resistance inRAS and BRAF wild-type metastatic colorectal cancer patients treated with anti-EGFR monoclonal antibodies.
TABLE 3. Pr edictive Anal yses Accordin g to Side dness and PRE SSING Pane l Stat us Sur vival Data by Side dness and PR ESSING Panel Stat us Left-Sided Tum ors Righ t-Sided Tumor s Inter action Test P Ar m A Ar m B HR (95% CI) P Arm A Arm B HR (95% CI) P Side dnes s Medi an PFS , month s (95% CI) 13 .0 (1 0.8 to 15 .4) 10 .8 (1 0.0 to 13 .2) 1.30 (0.93 to 1.81) .128 9.9 (6 .4 to 22.7) 7.7 (6 .4 to NA) 1.8 9 (0 .82 to 4.3 7) .135 .29 3 2-year OS rate , % 65 .5 (5 6.0 to 76 .7) 64 .5 (5 4.0 to 77 .1) 0.84 (0.52 to 1.35) .463 60 .2 (3 9.5 to 91 .7) 38 .5 (1 9.3 to 76 .5) 2.0 2 (0 .73 to 5.6 0) .178 .06 8 PRE SSING PRESSING Negativ e PRES SING Pos itive Medi an PFS , month s (95% CI) 13 .2 (1 0.6 to 17 .8) 11 .6 (1 0.6 to 13 .9) 1.24 (0.86 to 1.77) .253 12 .9 (7 .3 to 14.6) 7.4 (6 .4 to 8.8) 1.8 5 (1 .01 to 3.4 0) .047 .12 7 2-year OS rate , % 70 .1 (6 0.5 to 81 .2) 65 .5 (5 4.4 to 79 .0) 0.86 (0.51 to 1.46) .588 50 .6 (3 4.0 to 75 .4) 47 .0 (3 0.0 to 73 .8) 1.2 6 (0 .60 to 2.6 6) .543 .45 0 Abb revia tions: H R , haz ard ratio; N A , not asses sable; OS, overall surv ival; PFS , progre ssion-free survival ; PRESS ING, primary resistance in RAS and BRAF wild-type met astatic colorectal cancer patie nts treated with anti-EGFR monoc lonal antibod ies.
Conversely, sidedness was no longer signi
ficant, again
possibly because of the low number of right-sided tumors.
Consistent with the literature,
13,19MSI-high status was
associated with poor PFS outcome at the univariable
analysis, although the number of MSI-high occurrences in
this data set was quite small (only
five patients) and did not
allow us to properly assess its independent prognostic
role. The type of maintenance treatment retained its value
in terms of PFS but not OS; this result has been already
reported
11and may be due to the low number of OS events
at the time of data cutoff and to the underpowered
sample size.
Interestingly, we observed that ORR and depth of response
were numerically increased in patients with right-sided/
PRESSING-negative versus right-sided/PRESSING-positive
tumors. A similar role of the PRESSING panel was observed
in the left-sided subgroup. However, in the speci
fic
sub-group of patients with right-sided tumors, the increase of
response rate achieved thanks to negative hyperselection
failed to translate into a benefit in terms of duration of
response, PFS, or OS. This is in line with post hoc analyses
of pivotal trials and meta-analyses that investigated the
impact of sidedness on ORR versus survival end points in
patients with
RAS wild-type mCRC who received
anti-EGFR
–based treatment.
8,20,21On the basis of such results,
an anti-EGFR
–based first-line treatment rarely may be
offered on an individual basis to patients with right-sided
RAS wild-type mCRC, at least whenever tumor response is
0.25
Left and Arm A
Left and Arm B
Right and Arm A Right and Arm B
Left and Arm A
Left and Arm B
Right and Arm A Right and Arm B
PRESSING neg and Arm A
PRESSING neg and Arm B
PRESSING pos and Arm A PRESSING pos and Arm B
PRESSING neg and Arm A
PRESSING neg and Arm B
PRESSING pos and Arm A PRESSING pos and Arm B 3 0 6 9 12
Time (months)
15 18 21 24 83 88 No. at risk: 80 64 47 35 25 21 10 0.50 0.75 1.00PFS (proportion)
A
0.25 3 0 6 9 12Time (months)
15 18 21 24 76 79 No. at risk: 73 59 41 35 25 20 10 0.50 0.75 1.00PFS (proportion)
C
0.25 3 0 6 9 12Time (months)
15 18 21 24 79 79 No. at risk: 79 77 71 67 52 46 36 67 71 61 50 34 24 13 7 4 71 71 65 62 61 58 50 34 27 21 25 19 14 13 6 5 4 1 25 25 24 23 21 20 17 15 10 21 24 16 5 3 2 1 1 0 24 24 22 21 18 16 12 8 6 0.50 0.75 1.00OS (proportion)
D
0.25 3 0 6 9 12Time (months)
15 18 21 24 88 88 No. at risk: 87 86 79 75 58 51 39 78 82 67 52 35 25 14 8 4 82 82 77 75 73 68 57 39 31 14 16 12 9 7 6 5 3 1 16 16 16 14 13 12 11 10 7 10 13 10 3 2 1 0 0 0 13 13 10 8 6 6 5 3 2 0.50 0.75 1.00OS (proportion)
B
FIG 3. Predictive analysis according to tumor sidedness and primary resistance inRAS and BRAF wild-type metastatic colorectal
cancer patients treated with anti-EGFR monoclonal antibodies (PRESSING) panel status: Kaplan-Meier curves for (A) progression-free survival (PFS) and (B) overall survival (OS) in patients stratified according to the two different maintenance treatment arms and sidedness (right-v left-sided tumors) and for (C) PFS and (D) OS according to treatment arm and PRESSING panel status (positive [pos]v negative [neg]).
the primary goal of treatment and particularly when
anti-angiogenics and/or triplet chemotherapy are
contra-indicated. Given the higher prevalence of PRESSING panel
alterations in right-sided tumors, the role of negative
mo-lecular hyperselection may be crucial for some patients
with
RAS and BRAF wild-type/right-sided tumors.
Furthermore, the PFS bene
fit of FU plus LV added to
panitumumab in the maintenance setting was independent
from sidedness and PRESSING panel status, which thus
con
firmed the crucial role of fluoropyrimidine continuation
in the maintenance setting. However, PFS was extremely
poor in patients with right-sided or PRESSING-positive
disease treated with single-agent panitumumab, with an
abrupt decrease of the curves after 4 months (which
corresponded to the end of the induction phase). This
result highlights that single-agent anti-EGFRs should not
be regarded as an effective maintenance treatment
strat-egy in disease subgroups with a lack of clinically or
mo-lecularly defined EGFR dependency. In these subgroups,
de-escalation to a fully chemotherapy-free maintenance
strategy was associated with a signi
ficant loss of efficacy,
and, in patients with right-sided mCRC (which is itself
as-sociated with poorer outcomes
22), a detrimental effect was
observed even in terms of OS.
This study has some clear limitations. First of all, because
both maintenance treatment arms contained
pan-itumumab, we could not investigate the predictive role of
tumor sidedness and PRESSING panel status with regard
to anti-EGFR therapy. However, because FU plus LV was
administered only in arm A, we could identify a subgroup of
patients (ie, right-sided and/or PRESSING-positive disease)
who derived a limited benefit from single-agent
pan-itumumab, which confirmed the fundamental role of
chemotherapy for maintenance treatment and suggested
the limited clinical benefit from anti-EGFR treatment itself in
these subsets. Most important, the results of this study
should be interpreted with caution, because the role of
anti-EGFR therapy added to FU/LV in the maintenance setting
is still not established by level I evidence. This is
particu-larly relevant in light of the current lack of comparison with
other evidence-based maintenance options that have
better long-term tolerability, such as FU plus LV with or
without bevacizumab. Ongoing studies, such as Panama
(ClinicalTrials.gov identifier:
NCT01991873) and FIRE-4
(ClinicalTrials.gov identifier:
NCT02934529), we hope will
address the still-unanswered questions with their adequate
randomized settings.
Also, we acknowledge that, although tumor sidedness is
a simple, clearly de
finable and homogeneous variable, the
PRESSING panel is a composite biomarker that includes
several genomic alterations. Therefore, each genomic
al-teration may constitute a single marker, endowed with
a potential differential prognostic and/or predictive effect,
and our results do not distinguish the relative contribution of
individual variables because of the extremely low
preva-lence of each. The complex molecular interactions of these
candidate genomic alterations in the neoplastic signaling
pathways and their low prevalences limit their formal
val-idation in prospective clinical studies or in post hoc
ana-lyses of randomized clinical trials as negative predictive
markers for response to EGFR-targeted therapies, and this
limitation may impair their implementation in the tumor
pro
filing work-up, even if many of them are validated
therapeutic targets.
10,14-16,23-29Regarding
RAS mutations
with an MAF less than the 5% cutoff, which was validated
for negative selection of patients for anti-EGFRs, it is still
unclear whether mutations with low fractional abundance
simply mirror tumor heterogeneity that may be overcome by
novel techniques, such as liquid biopsy,
30or may be
as-sociated with the rapid onset of acquired resistance and
limited long-term PFS bene
fit under the selective pressure
of anti-EGFR agents continued until disease progression
develops.
31In conclusion, even if patients with left-sided,
RAS and
BRAF wild-type tumors currently are considered the
opti-mal candidates for EGFR inhibitors,
3a consistent
pro-portion of them achieve a signi
ficantly inferior clinical
bene
fit from upfront anti-EGFR–based regimens,
particu-larly after de-escalation to maintenance treatment with
single-agent anti-EGFRs. A negative molecular
hyper-selection with our PRESSING panel, added to the initial
assessment of sidedness and
RAS/BRAF mutational status,
may help identify a subgroup of patients who will
excep-tionally bene
fit from anti-EGFR–based initial therapy.
AFFILIATIONS
1Fondazione Instituto di Ricovero e Cura Carattere Scientifico (IRCCS) Istituto Nazionale dei Tumori, Milan, Italy
2Istituto Oncologico Veneto, IRCCS, Padua, Italy 3University of Pisa, Pisa, Italy
4Humanitas Cancer Center, IRCCS, Rozzano, Italy
5University of Genoa and IRCCS Azienda Ospedaliera Universitaria (AOU) San Martino-IST, Genoa, Italy
6Fondazione Poliambulanza, Brescia, Italy 7Niguarda Cancer Center, Milan, Italy 8University of Milan, Milan, Italy
9Azienda Socio-Sanitaria Territoriale Ospedale di Cremona, Cremona, Italy
10AOU Citt `a della Salute e della Scienza di Torino, Torino, Italy 11Ente Ospedaliero Ospedali Galliera, Genoa, Italy
12University of Messina, Messina, Italy
CORRESPONDING AUTHOR
Filippo Pietrantonio, MD, Oncology and Hemato-oncology Department, University of Milan, via Festa del Perdono 7, 20122 Milan, Italy, and Department of Medical Oncology, Fondazione IRCCS Istituto Nazionale dei Tumori, via Giacomo Venezian 1, 20133 Milan, Italy; e-mail: fi[email protected].
PRIOR PRESENTATION
Presented in part as a poster discussion at the European Society for Medical Oncology 2018 Congress, Munich, Germany, October 12-23, 2018, and as an oral presentation at the Associazione Italiana di Oncologia Medica National Congress 2018, Rome, Italy, November 16-18, 2018.
SUPPORT
Supported in part with a research grant and drug supply during panitumumab-based maintenance treatment by Amgen.
AUTHORS’ DISCLOSURES OF POTENTIAL CONFLICTS OF INTEREST
AND DATA AVAILABILITY STATEMENT
Disclosures provided by the authors and data availability statement (if
applicable) are available with this article at DOIhttps://doi.org/10.1200/
JCO.19.01254.
AUTHOR CONTRIBUTIONS
Conception and design: Federica Morano, Filippo de Braud, Filippo Pietrantonio
Provision of study material or patients: Sara Lonardi, Chiara Cremolini, Lorenza Rimassa, Alberto Zaniboni, Andrea Sartore-Bianchi, Roberto
Murialdo, Gianluca Tomasello, Patrizia Racca, Matteo Clavarezza, Vincenzo Adamo, Fotios Loupakis
Collection and assembly of data: Federica Morano, Salvatore Corallo, Sara Lonardi, Chiara Cremolini, Lorenza Rimassa, Roberto Murialdo, Alberto Zaniboni, Andrea Sartore-Bianchi, Gianluca Tomasello, Patrizia Racca, Vincenzo Adamo, Federica Perrone, Elena Tamborini, Adele Busico, Antonia Martinetti, Federica Palermo, Fotios Loupakis, Massimo Milione, Maria Di Bartolomeo, Filippo Pietrantonio
Data analysis and interpretation: Federica Morano, Salvatore Corallo, Alessandra Raimondi, Matteo Clavarezza, Federica Perrone, Annunziata Gloghini, Elena Tamborini, Fotios Loupakis, Massimo Milione, Giovanni Fuc `a, Filippo Pietrantonio
Manuscript writing: All authors Final approval of manuscript: All authors
Accountable for all aspects of the work: All authors
ACKNOWLEDGMENT
We thank all of the patients who agreed to take part in the trial. We also thank the investigators and the study teams who participated.
REFERENCES
1. Van Cutsem E, Lenz HJ, K ¨ohne CH, et al: Fluorouracil, leucovorin, and irinotecan plus cetuximab treatment andRAS mutations in colorectal cancer. J Clin Oncol 33:692-700, 2015
2. Van Cutsem E, Cervantes A, Adam R, et al: ESMO consensus guidelines for the management of patients with metastatic colorectal cancer. Ann Oncol 27: 1386-1422, 2016
3. National Comprehensive Cancer Network: Colon cancer (version 1.2019).https://www.nccn.org/professionals/physician_gls/pdf/colon.pdf.
4. Van Cutsem E, K ¨ohne CH, L ´ang I, et al: Cetuximab plus irinotecan,fluorouracil, and leucovorin as first-line treatment for metastatic colorectal cancer: Updated analysis of overall survival according to tumorKRAS and BRAF mutation status. J Clin Oncol 29:2011-2019, 2011
5. Venook AP, Niedzwiecki D, Lenz HJ, et al: Effect offirst-line chemotherapy combined with cetuximab or bevacizumab on overall survival in patients with KRAS wild-type advanced or metastatic colorectal cancer: A randomized clinical trial. JAMA 317:2392-2401, 2017
6. Heinemann V, von Weikersthal LF, Decker T, et al: FOLFIRI plus cetuximab versus FOLFIRI plus bevacizumab asfirst-line treatment for patients with metastatic colorectal cancer (FIRE-3): A randomised, open-label, phase 3 trial. Lancet Oncol 15:1065-1075, 2014
7. Douillard JY, Oliner KS, Siena S, et al: Panitumumab-FOLFOX4 treatment andRAS mutations in colorectal cancer. N Engl J Med 369:1023-1034, 2013 8. Arnold D, Lueza B, Douillard JY, et al: Prognostic and predictive value of primary tumour side in patients withRAS wild-type metastatic colorectal cancer treated
with chemotherapy andEGFR directed antibodies in six randomized trials. Ann Oncol 28:1713-1729, 2017
9. Holch JW, Ricard I, Stintzing S, et al: The relevance of primary tumour location in patients with metastatic colorectal cancer: A meta-analysis offirst-line clinical trials. Eur J Cancer 70:87-98, 2017
10. Cremolini C, Morano F, Moretto R, et al: Negative hyper-selection of metastatic colorectal cancer patients for anti-EGFR monoclonal antibodies: The PRESSING case-control study. Ann Oncol 28:3009-3014, 2017
11. Pietrantonio F, Morano F, Corallo S, et al: Maintenance therapy with panitumumab alone vs panitumumab plusfluorouracil-leucovorin in patients with RAS wild-type metastatic colorectal cancer: A phase 2 randomized clinical trial. JAMA Oncol doi:10.1001/jamaoncol.2019.1467 [epub ahead of print on July 3, 2019] 12. Dienstmann R, Elez E, Argiles G, et al: Analysis of mutant allele fractions in driver genes in colorectal cancer: Biological and clinical insights. Mol Oncol 11:
1263-1272, 2017
13. Innocenti F, Ou FS, Qu X, et al: Mutational analysis of patients with colorectal cancer in CALGB/SWOG 80405 identifies new roles of microsatellite instability and tumor mutational burden for patient outcome. J Clin Oncol 37:1217-1227, 2019
14. Pietrantonio F, Di Nicolantonio F, Schrock AB, et al:ALK, ROS1, and NTRK rearrangements in metastatic colorectal cancer. J Natl Cancer Inst 109:djx089, 2017
15. Pietrantonio F, Di Nicolantonio F, Schrock AB, et al:RET fusions in a small subset of advanced colorectal cancers at risk of being neglected. Ann Oncol 29: 1394-1401, 2018
16. Sartore-Bianchi A, Trusolino L, Martino C, et al: Dual-targeted therapy with trastuzumab and lapatinib in treatment-refractory,KRAS codon 12/13 wild-type, HER2-positive metastatic colorectal cancer (HERACLES): A proof-of-concept, multicentre, open-label, phase 2 trial. Lancet Oncol 17:738-746, 2016 17. Guinney J, Dienstmann R, Wang X, et al: The consensus molecular subtypes of colorectal cancer. Nat Med 21:1350-1356, 2015
18. Laurent-Puig P, Grisoni ML, Heinemann V, et al: Validation of miR-31-3p expression to predict cetuximab efficacy when used as first-line treatment in RAS wild-type metastatic colorectal cancer. Clin Cancer Res 25:134-141, 2019
19. Lenz H-J, Ou F-S, Venook AP, et al: Impact of consensus molecular subtype on survival in patients with metastatic colorectal cancer: Results from CALGB/ SWOG 80405 (alliance). J Clin Oncol 37:1876-1885, 2019
20. Tejpar S, Stintzing S, Ciardiello F, et al: Prognostic and predictive relevance of primary tumor location in patients withRAS wild-type metastatic colorectal cancer: Retrospective analyses of the CRYSTAL and FIRE-3 trials. JAMA Oncol 3:194-201, 2017
21. Qin S, Li J, Wang L, et al: Efficacy and tolerability of first-line cetuximab plus leucovorin, fluorouracil, and oxaliplatin (FOLFOX-4) versus FOLFOX-4 in patients withRAS wild-type metastatic colorectal cancer: The open-label, randomized, phase III TAILOR trial. J Clin Oncol 36:3031-3039, 2018
22. Petrelli F, Tomasello G, Borgonovo K, et al: Prognostic survival associated with left-sided vs right-sided colon cancer: A systematic review and meta-analysis. JAMA Oncol 3:211-219, 2017
23. De Roock W, Claes B, Bernasconi D, et al: Effects ofKRAS, BRAF, NRAS, and PIK3CA mutations on the efficacy of cetuximab plus chemotherapy in
chemotherapy-refractory metastatic colorectal cancer: A retrospective consortium analysis. Lancet Oncol 11:753-762, 2010
24. Yonesaka K, Zejnullahu K, Okamoto I, et al: Activation ofERBB2 signaling causes resistance to the EGFR-directed therapeutic antibody cetuximab. Sci Transl Med 3:99ra86, 2011
25. Bardelli A, Corso S, Bertotti A, et al: Amplification of the MET receptor drives resistance to anti-EGFR therapies in colorectal cancer. Cancer Discov 3:658-673, 2013
26. Perrone F, Lampis A, Orsenigo M, et al:PI3KCA/PTEN deregulation contributes to impaired responses to cetuximab in metastatic colorectal cancer patients. Ann Oncol 20:84-90, 2009
27. Mao C, Liao RY, Chen Q: Loss ofPTEN expression predicts resistance to EGFR-targeted monoclonal antibodies in patients with metastatic colorectal cancer. Br J Cancer 102:940, 2010
28. Overman MJ, McDermott R, Leach JL, et al: Nivolumab in patients with metastatic DNA mismatch repair-deficient or microsatellite instability-high colorectal cancer (CheckMate 142): An open-label, multicentre, phase 2 study. Lancet Oncol 18:1182-1191, 2017
29. Overman MJ, Lonardi S, Wong KYM, et al: Durable clinical benefit with nivolumab plus ipilimumab in DNA mismatch repair-deficient/microsatellite instability-high metastatic colorectal cancer. J Clin Oncol 36:773-779, 2018
30. Antoniotti C, Pietrantonio F, Corallo S, et al: Circulating tumor DNA analysis in colorectal cancer: From dream to reality. JCO Precis Oncol10.1200/PO.18.00397 31. Van Emburgh BO, Arena S, Siravegna G, et al: AcquiredRAS or EGFR mutations and duration of response to EGFR blockade in colorectal cancer. Nat Commun
7:13665, 2016
AUTHORS’ DISCLOSURES OF POTENTIAL CONFLICTS OF INTEREST
Negative Hyperselection of Patients WithRAS and BRAF Wild-Type Metastatic Colorectal Cancer Who Received Panitumumab-Based Maintenance Therapy
The following represents disclosure information provided by authors of this manuscript. All relationships are considered compensated. Relationships are self-held unless noted. I = Immediate Family Member, Inst = My Institution. Relationships may not relate to the subject matter of this manuscript. For more information about ASCO’s conflict of interest policy, please refer towww.asco.org/rwcorascopubs.org/jco/site/ifc.
Federica Morano Honoraria: SERVIER
Travel, Accommodations, Expenses: Sanofi, SERVIER
Salvatore Corallo Speakers’ Bureau: SERVIER Sara Lonardi
Consulting or Advisory Role: Amgen, Merck Serono, Lilly
Speakers’ Bureau: Roche, Lilly, Bristol-Myers Squibb, SERVIER, Merck Serono Research Funding: Amgen, Merck Serono
Chiara Cremolini
Honoraria: Roche, Amgen, Bayer, SERVIER Consulting or Advisory Role: Roche, Bayer, Amgen Speakers’ Bureau: SERVIER
Research Funding: Merck
Travel, Accommodations, Expenses: Roche, SERVIER Lorenza Rimassa
Honoraria: AstraZeneca, AbbVie, Gilead Sciences, Roche
Consulting or Advisory Role: Bayer, Sirtex Medical, Italfarmaco, Sanofi, ArQule, Baxter, Ipsen, Exelixis, Amgen, Incyte, Celgene, Eisai, Lilly, Hengrui Therapeutics, Merck Sharp & Dohme
Travel, Accommodations, Expenses: ArQule, Ipsen Alberto Zaniboni
Consulting or Advisory Role: Amgen, SERVIER, Bayer, Merck Serono Speakers’ Bureau: SERVIER
Andrea Sartore-Bianchi
Consulting or Advisory Role: Amgen, Bayer, Sanofi Speakers’ Bureau: Amgen, Bayer, Sanofi
Travel, Accommodations, Expenses: Amgen, Bayer, Sanofi
Patrizia Racca
Honoraria: Merck Serono, Roche, Amgen, SERVIER Matteo Clavarezza
Speakers’ Bureau: Sanofi, Aventis, Amgen
Travel, Accommodations, Expenses: Roche, Genentech, Sanofi, Aventis Fotios Loupakis
Consulting or Advisory Role: Amgen, Sanofi, Bayer Speakers’ Bureau: Roche, Sanofi, Bayer, Amgen
Research Funding: Roche (Inst), Merck Serono (Inst), Amgen (Inst), Bayer (Inst) Travel, Accommodations, Expenses: Roche, Amgen, Merck Serono Maria Di Bartolomeo
Honoraria: Lilly, MSD Oncology, SERVIER Consulting or Advisory Role: Lilly, MSD Oncology Research Funding: Lilly (Inst)
Travel, Accommodations, Expenses: Roche, Sanofi Filippo de Braud
Consulting or Advisory Role: Ignyta, Pfizer, Amgen, Novartis, Daiichi Sankyo, Bristol-Myers Squibb, Domp `e, Pierre Fabre, Roche, Octimet, Incyte, Teofarma, EMD Serono
Speakers’ Bureau: Merck Sharp & Dohme, Novartis, Bristol-Myers Squibb, Roche, Pfizer, Menarini
Research Funding: Novartis (Inst), Roche (Inst), Merck Sharp & Dohme (Inst), Ignyta (Inst), MedImmune (Inst), Nektar (Inst), Bristol-Myers Squibb (Inst), Merck Serono (Inst), Bayer (Inst), Celgene (Inst), GlaxoSmithKline (Inst), Boehringer Ingelheim (Inst), Lilly (Inst), Pfizer (Inst), SERVIER (Inst) Filippo Pietrantonio
Consulting or Advisory Role: Amgen, Merck Serono, Bayer, Lilly, Sanofi, Roche, SERVIER
APPENDIX
Supplementary Methods
The primary resistance inRAS and BRAF wild-type metastatic co-lorectal cancer patients treated with anti-EGFR monoclonal antibodies (PRESSING) panel analysis was performed as previously described.10 Specifically, immunohistochemistry (IHC) for HER2/MET and dual-color silver in situ hybridization (SISH) for both genes were carried out and scored as described previously (Pietrantonio F, et al: Clin Cancer Res 23: 2412-2422, 2017; Valtorta E, et al: Mod Pathol 28:1481-1491, 2015). In detail, IHC was performed on 3-mm formalin-fixed paraffin-embedded (FFPE) tissue sections or on WiDr cytoclots.MET protein expression was detected by a rabbit monoclonal anti-MET antibody (dilution 1:200; clone SP44; Spring Bioscience, Pleasanton, CA) di-rected against the synthetic peptide derived from the C terminus of human MET that displayed membranous and/or cytoplasmic epitope. HER2 expression analysis was performed using the HercepTest an-tibody (Agilent; Santa Clara, CA) and automatically on the automated Benchmark Ultrasystem (Ventana Medical Systems, Tucson, AZ) using the Ventana 4B5 antibody according to the manufacturers’ instructions. Bright-field dual-color SISH analysis was performed on 3-mm FFPE tissue sections using the MET DNP Probe (Ventana Medical Systems) along with the Chromosome 7 DIG Probe (Ventana Medical Systems) on a BenchMark Ultra Platform (Ventana Medical Systems) according to the manufacturer’s protocol. HER2 amplification analysis by SISH with a Ventana Medical Systems 4B5 Inform HER2 dual color on the BenchMark Ultra system (Inform HER2 DNA dual-color assay; Roche Tissue Diagnostics, Ventana Medical Systems). The scoring and evaluation for in situ hybridization was performed by counting HER2 and CEN17 signals from 100 nuclei per case. Nontumor tissue (normal colon mucosa) was used as an internal negative control.HER2 gene amplification was defined as positive when the HER2/CEP17 ratio was two or greater or the average number ofHER2 signals per tumor cell nucleus was more than 6, whereasMET amplification was defined as positive when theMET/CEP7 ratio was two or greater or average number ofMET signals per tumor cell nucleus was more than 6. IHC for ALK/ROS1/panTRK/RET was carried out as screening method using standard protocols for pan-Trk (including TrkA, TrkB, TrkC; Cell Signaling, Danvers, MA; clone C17F1, 1:25 dilution), ROS1 (Cell Signaling; clone D4D6, 1:500 dilution), ALK (Cell Signaling, Danvers, MA; clone D5F3, 1:500 dilution) and RET (Abcam, Cambridge, United Kingdom; clone EPR2871). In all samples with evidence of IHC staining of any intensity/extension, whole-transcriptome shotgun se-quencing (RNA-seq) was performed to confirm the presence of specific rearrangements and to identify the specific fusion partner.14 Mutational analysis was performed on FFPE specimens for each case; these were sliced in 5-mm sections and manually microdissected to
isolate the tumor area that carried the highest percentage of neoplastic cells—identified by a pathologist on hematoxylin and eosin. A minimal tumor percentage of 10% was required; the average tumor percentage was 70% (range, 10% to 90%), and no difference of percentages was observed between sensitive and resistant samples. Samples were treated with xylene and 100% ethanol to remove paraffin, and then DNA was isolated using the GeneRead DNA FFPE kit (catalog No. 180134; Qiagen, Hilden, Germany; ). DNA amount and quality were identified using Nano Drop platform and Qbit dsDNA BR kit (Ther-moFisher Scientific, Waltham, MA) according to the manufacturer’s instructions. Oncogenic mutations in the hotspot regions of 50 on-cogenes and tumor suppressor genes commonly mutated in human cancers (Cancer Hotspot Panel v2, ThermoFisher Scientific: ABL1, AKT1, ALK, APC, ATM, BRAF, CDH1, CDKN2A, CSF1R, CTNNB1, EGFR, ERBB2, ERBB4, EZH2, FBXW7, FGFR1, FGFR2, FGFR3, FLT3,GNA11, GNAS, GNAQ, HNF1A, HRAS, IDH1, IDH2, JAK2, JAK3, KDR/VEGFR2, KIT, KRAS, MET, MLH1, MPL, NOTCH1, NPM1, NRAS, PDGFRA, PIK3CA, PTEN, PTPN11, RB1, RET, SMAD4, SMARCB1, SMO, SRC, STK11, TP53, VHL) were assessed by means of targeted next-generation sequencing through the Ion Torrent Per-sonal Genome platform (ThermoFisher Scientific) , according to the manufacturer’s instructions (Peitrantonio F, et al: Ann Oncol 27:2097-2103, 2016; Pietrantonio F, et al: Clin Cancer Res 24:1082-1089, 2018).
The BRAF and RAS mutational status was centrally reassessed through targeted next-generation sequencing with deeper coverage to detect low-percentage and atypical RAS mutations. The fractional abundances ofBRAF and RAS mutations, called mutant allele frac-tions (MAFs) were reported. Average sequencing depth was 1,0003, and mutations were defined with a minimum MAF of 3%. MAF was corrected for tumor cellularity, defined as the percentage of tissue sample occupied by tumor cells on the total amount of cells, including stromal microenvironment and inflammatory infiltrate.12
Microsatellite instability status (MSI) analysis was performed after DNA was extracted from each tumor block and amplified via polymerase chain reaction. The MSI status was identified using five quasi-monomorphic mononucleotide markers able to provide highly accu-rate determinations of the tumor MSI status from DNA: BAT-25, BAT-26, NR-21, NR-24, and MONO-27 (MSI Analysis System, version 1.2; Promega, Madison, WI). According to previous evidence, cases with instability at two or more of thefive markers were classified as MSI high, whereas samples with instability at one marker and without instability were categorized as MSI low and microsatellite stable, respectively (Smyth EC, et al: JAMA Oncol 3:1197-1203, 2017).
Patients randomly assigned (N = 229) Italian centers involved, (n = 29) July 2015 to October 2017
Clinically evaluable patients (n = 213)
Patients not clinically evaluable were excluded
(n = 16)
Patients with no available tissue were excluded
(n = 5) BRAF-mutated patients were excluded (n = 9) Right-sided, PRESSING panel positive (n = 11)
PRESSING panel positive (n = 49) Left-sided, PRESSING panel positive (n = 38) Right-sided, PRESSING panel negative (n = 18) Left-sided, PRESSING panel negative (n = 132) PRESSING panel negative
(n = 150)
RAS wild-type evaluable patients
with available tumor tissue (n = 208)
RAS/BRAF wild-type evaluable
patients with available tumor tissue (n = 199)
Right-sided primary tumor (n = 29)
Left-sided primary tumor (n = 170)
0 1.00
A
0.25 Median PFS: 11.1 months (95% Cl, 10.3 to 13.2) No. of events: 167 0.50 0.75PFS (proportion)
No. at risk: 3 6 9 12 15 18 21 24 199 185 169 128 91 67 44 32 15Time (months)
0 1.00B
0.25Median OS: 30.7 months (95% Cl, 27.5 to NA) 2-year OS rate: 63% (95% Cl, 56 to 71) No. of events: 85 0.50 0.75
OS (proportion)
Time (months)
No. at risk: 3 6 9 12 15 18 21 24 199 199 190 183 171 161 131 103 79FIG A2. Survival analysis in the overall study population: (A) progression-free survival (PFS) and (B) overall survival (OS). NA, not assessable.
55.2 74.1 0 10 20 30 40 50 60 70 80 Right (n = 29) Left (n = 170)
Response Rate (%)
A
OR (95 CI): 0.43 (0.19 to 0.99) P = .037Response Rate (%)
59.2 75.3 0 10 20 30 40 50 60 70 80 Positive (n = 49) Negative (n = 150)B
OR (95 CI): 0.48 (0.24 to 0.95) P = .030C
45.5 61.1 63.2 77.3 0 10 20 30 40 50 60 70 80 90Response Rate (%)
OR (95 CI): 0.55 (0.11 to 2.57) P = .46 OR (95 CI): 0.51 (0.23 to 1.12) P = .080Left and Pos (n = 38)
Left and Neg (n = 132) Right and Pos
(n = 11)
Right and Neg (n = 18)
FIG A3. Activity analysis according to tumor sidedness and primary resistance inRAS and BRAF wild-type
metastatic colorectal cancer patients treated with anti-EGFR monoclonal antibodies (PRESSING) panel status: overall response (OR) rate in patients stratified according to (A) sidedness, (B) PRESSING panel status, and (C) combined analysis. Neg, negative; Pos, positive.
0 3 6 9 12
Time (months)
15 18 21 24 126 No. at risk: 118 99 76 56 39 24 13 9 16 16 9 6 4 3 2 1 0 0.25 0.50Duration
of Response (proportion)
1.00A
0.75 Left sided Median Duration of Response (IQR) 10.7 (6.5-17.8) 6.4 (5.0-12.0) Right sided 0 3 6 9 12Time (months)
15 18 21 24 113 No. at risk: 110 94 71 52 36 21 13 8 29 24 14 11 8 6 5 1 1 0.25 0.50Duration
of Response (proportion)
1.00B
0.75 Median Duration of Response (IQR) 11.3 (7.4-18.0) 5.9 (3.2-12.3) PRESSING negative PRESSING positive Median Duration of Response (IQR) 11.5 (7.9-18.1) 6.1 (3.2-12.8) 6.7 (5.1-12.6) 5.9 (4.2-11.3)Left sided and PRESSING negative
Left sided and PRESSING positive Right sided and PRESSING negative Right sided and PRESSING positive
0 3 6 9 12
Time (months)
15 18 21 24 102 No. at risk: 99 87 67 49 34 20 12 8 24 19 12 9 7 5 4 1 1 11 11 7 4 3 2 1 1 0 5 5 2 2 1 1 1 0 0 0.25 0.50Duration
of Response (proportion)
1.00C
0.75FIG A4. Duration of response analysis according to (A) sidedness: right sided and left sided in red and blue, respectively; (B) primary
resistance inRAS and BRAF wild-type metastatic colorectal cancer patients treated with anti-EGFR monoclonal antibodies (PRESSING) panel status and (C) combined analysis. IQR, interquartile range; PRESSING, primary resistance inRAS and BRAF wild-type metastatic colorectal cancer patients treated with anti-EGFRmonoclonal antibodies.
0 No. at risk: 3 6 9 12 15 Median PFS (95% Cl) 11.1 (10.4 to 13.2) MSS
MSI high 4.1 (4.0 to NA)
HR ref 3.03 (1.24 to 7.42) P .015 18 21 24 194 181 168 127 90 66 43 32 15 5 4 1 1 1 1 1 0 0 0.25 0.50
PFS (proportion)
Time (months)
1.00 0.75A
0 No. at risk: 3 6 9 12 15 2-year OS rate (95% Cl) 62.9 (56.0 to 70.6) MSS MSI high 60.0 (29.3 to 100) HR ref 1.23 (0.38 to 3.92) P .732 18 21 24 194 194 185 180 168 158 128 100 76 5 5 5 3 3 3 3 3 3 0.25 0.50OS (proportion)
Time (months)
1.00 0.75B
FIG A5. Prognostic analysis according to microsatellite instability (MSI) status: Kaplan-Meier curves for (A) progression-free
survival (PFS) and (B) overall survival (OS) in patients stratified according to MSI status. HR, hazard ratio; MSS, microsatellite stable; NA, not assessable; ref, reference.
0 No. at risk: 3 6 9 12 15 18 21 24 70 67 66 55 38 32 22 18 9 62 59 53 47 32 23 13 7 4 18 16 14 9 9 3 3 3 1 20 19 14 5 3 2
Left sided and PRESSING neg, ARM A (pan + FU + LV)
Left sided and PRESSING neg, ARM B (pan)
Left sided and PRESSING pos, ARM A (pan + FU + LV) Left sided and PRESSING pos, ARM B (pan)
1 1 0 0.25 0.50
PFS (proportion)
Time (months)
1.00A
0.75 0 No. at risk: 3 6 9 12 15 18 21 24 70 70 70 70 64 61 46 41 32 62 62 57 56 56 53 46 31 25 18 18 17 16 15 14 12 10 7 20 20 20 19 17 15Left sided and PRESSING neg, ARM A (pan + FU + LV)
Left sided and PRESSING neg, ARM B (pan)
Left sided and PRESSING pos, ARM A (pan + FU + LV) Left sided and PRESSING pos, ARM B (pan)
11 8 6 0.25 0.50
OS (proportion)
Time (months)
1.00B
0.75FIG A6. Predictive analysis according to combined tumor sidedness and primary resistance in RAS and BRAF wild-type
metastatic colorectal cancer patients treated with anti-EGFR monoclonal antibodies (PRESSING) panel status in left-sided tumors. Kaplan-Meier curves for (A) progression-free survival (PFS) and (B) overall survival (OS) in the patient subgroup with left-sided/ PRESSING-negative tumors stratified according to the two different maintenance treatment arms or the patient subgroup with left-sided/PRESSING-positive tumors stratified according to the two different maintenance treatment arms. FU + LV, fluorouracil plus leucovorin; neg, negative; pan, panitumumab; pos, positive.
TABLE A1. Incidence of the Singular Molecular Alterations Included in the PRESSING Panel
No. Patient ID Site of the Sample PRESSING Panel Alterations (% of tumor cells)
RAS Adjusted MAF
01 001-001 M WT WT
02 001-002 M WT WT
03 001-003 P PIK3CA exon 20 mutation: A1035V (32), MSI WT
04 001-004 M WT WT 05 001-005 P WT WT 06 001-006 P MET amplification (100) WT 07 001-007 P WT WT 08 001-008 P WT WT 09 001-009 P WT WT 10 001-011 M MSI WT 11 001-012 M WT WT 12 001-013 M WT WT 13 001-014 M WT WT
14 001-016 M AKT1 exon 2 mutation: A50T (16) WT
15 001-017 P WT WT 16 001-018 P WT WT 17 001-019 M WT WT 18 001-020 P WT WT 19 001-021 P WT WT 20 001-022 P WT WT 21 001-023 P WT WT 22 001-024 P RET rearrangement (20) 1%
KRAS exon 2 mutation: G12D
23 001-025 P WT WT
24 001-026 P WT WT
25 001-028 P KRAS exon 2 mutation: G12V 10%
26 001-029 P WT WT
27 001-030 M WT WT
28 001-031 B KRAS exon 2 mutation: G12D 7%
29 001-032 M WT WT
30 001-033 P WT WT
31 001-034 M WT WT
32 001-036 P PTEN mutation: delP248 exon 7 (25); delT321 exon 8 (29) WT
MSI
33 001-037 P WT WT
34 001-038 P WT WT
35 001-039 P WT WT
36 001-040 P PTEN exon 5 mutation: K128N (36) WT
37 001-041 M WT WT
38 001-043 P WT WT
39 001-044 M HER2 amplification WT
40 001-045 P WT WT
41 001-046 P WT WT
TABLE A1. Incidence of the Singular Molecular Alterations Included in the PRESSING Panel (continued)
No. Patient ID Site of the Sample PRESSING Panel Alterations (% of tumor cells)
RAS Adjusted MAF
42 001-047 P WT WT
43 001-048 P WT WT
44 002-001 M WT WT
45 002-002 B NRAS exon 3 mutation: Q61R 1%
KRAS exon 2 mutation: G12V 4%
46 003-001 P WT WT 47 003-002 P WT WT 48 003-003 P WT WT 49 003-004 P WT WT 50 003-005 P WT WT 51 003-006 P HER2 amplification WT 52 003-007 P WT WT 53 003-008 P WT WT 54 004-001 P WT WT 55 004-002 P WT WT 56 004-004 P WT WT 57 004-005 M WT WT 58 004-007 P WT WT 59 004-008 P WT WT 60 004-009 P NTRK rearrangement (EML4-NTRK3) WT 61 004-010 P WT WT 62 004-012 P WT WT
63 004-013 P PIK3CA exon 20 mutation: H1047L (80) WT
64 004-014 P WT WT 65 004-015 P WT WT 66 004-016 P WT WT 67 004-017 P WT WT 68 004-018 P WT WT 69 004-019 P WT WT 70 004-020 P WT WT 71 004-021 P WT WT
72 004-022 P PTEN exon 7 mutation: C250V-fsTer 5 (39) WT
73 004-024 P WT WT
74 004-025 P PIK3CA exon 20 mutation –H1047L (38) WT
75 004-026 P WT WT 76 004-027 P WT WT 77 004-028 P WT WT 78 004-029 P WT WT 79 004-030 P WT WT 80 004-031 P WT WT 81 004-033 P WT WT 82 005-001 P WT WT 83 005-002 P MET amplification (53) WT
TABLE A1. Incidence of the Singular Molecular Alterations Included in the PRESSING Panel (continued)
No. Patient ID Site of the Sample PRESSING Panel Alterations (% of tumor cells)
RAS Adjusted MAF 84 005-004 P WT WT 85 005-006 P MET amplification (83) WT HER2 amplification 86 005-009 P WT WT 87 006-001 P WT WT 88 006-003 P WT WT
89 006-004 P KRAS exon 2 mutation: G12S 1%
90 007-001 P WT WT 91 007-002 P WT WT 92 007-005 M WT WT 93 007-006 P WT WT 94 007-007 P WT WT 95 007-008 P MSI WT 96 007-009 P WT WT
97 007-010 P PTEN exon 5 mutation: R130G (15) WT
98 007-011 P WT WT 99 007-012 P WT WT 100 007-013 P WT WT 101 007-014 P HER2 amplification WT 102 007-015 P HER2 amplification WT 103 008-001 P WT WT 104 008-002 P WT WT 105 008-003 P WT WT
106 008-004 M NRAS exon 2 mutation: G13S 3%
107 008-005 M WT WT
108 008-006 P WT WT
109 008-007 P KRAS exon 2 mutation: G12D 1%
110 008-008 P PIK3CA exon 20 mutation: H1047R (5) WT
111 008-009 P PIK3CA exon 20 mutation: H1047R (70) WT
112 008-010 P WT WT 113 008-011 P WT WT 114 008-012 B WT WT 115 008-013 M WT WT 116 008-014 P WT WT 117 008-015 P WT WT
118 008-016 P PIK3CA exon 20 mutation: H1047L (30) WT
119 009-001 M HER2 amplification WT 120 009-002 P WT WT 121 010-001 M WT WT 122 010-002 P WT WT 123 010-003 P WT WT 124 010-004 M WT WT 125 010-005 P HER2 amplification WT