The cut runs deep: linking the cut marks to the
cutting tools.
Boschin Francesco
1, Erika Moretti
2, Daniele Aureli
3, Jacopo Crezzini
4, Simona Arrighi
5 1Università degli Studi di Siena, DSFTA, UR Ecologia Preistorica, [email protected]
2
[email protected]
3
UMR 7041 ArScAn Equipe An-TET, Université Parigi Ouest Nanterre La Défense,
[email protected]
4
Università degli Studi di Siena, DSFTA, UR Ecologia Preistorica, [email protected]
5Dipartimento di Beni Culturali, Università di Bologna, [email protected]
Abstract – The analysis of bone surface modifications
(BSM), such as butchering marks, is necessary to better understand how the exploitation of animal resources by past hominins influenced their biological and cultural evolution. Even if several studies have been carried out on this topic in the last decades, there are still some phenomena which need to be thoroughly understood. Here we try to quantify how can the depth of cut marks influence the shape of their cross-sections. This is of crucial important for a valid interpretation of shape data collected on archaeological BSMs. In particular, two groups of cut marks’ cross-sections experimentally produced with two flint burins on a cattle innominate are analysed in this paper by means of 3D microscopy and geometric morphometrics. The two sets of striae show a different depth and a different cross-sectional shape. In particular, shallower cross sections are characterized by less steep walls and consequently by a wider opening angle. If analysis moves to the characteristics of the cutting edge of the burins, it comes out that the different shape between the two groups of striations is probably a function of the way in which the tool penetrates into the bone. These results are relevant for taphonomy, since similar difference in cross-sectional shape were found between marks produced with different raw materials. This contribution highlights the importance of considering the characteristics of tool’s cutting edges in evaluating the meaning of shape variability of cut marks cross-sections.
I. INTRODUCTION
The application of 3D imaging in taphonomy increased in the last years. These studies are often aimed at analysing bone surface modifications (BSM) such as butchering marks, gnawing marks or modifications due to trampling and abrasion by sediments [1-4]. Aim of such a taphonomic study is to better understand hominin
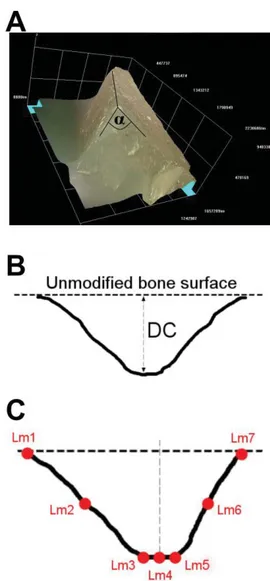
Figure 1. A: 3D image of the active edge of the burins. B: depth of cut measured on the cross-sections; C: landmarks placed on the cross-sections.
behaviour through time [5-8]. At the university of Siena, 3D imaging has been applied in the study of BSMs since 2009, by means of a Hirox KH-7700 digital microscope [2-4,7,9,10]. A first pilot study, inspired by the results achieved by colleagues [1], was focused on the distinction between cross-sections of cut marks (i.e. elongated striations on the bone surfaces) produced with different tools (metal knives and retouched/unretouched flint implements). The obtained results [2] demonstrated how a morphometrical approach can be useful to characterize and study cross-sections of bone surface modifications from archaeological sites. In addition, it demonstrated that the analysis of only one median cross-section per each mark can be enough to separate between different sets of striae. Further research was carried out to understand how specific tools and actions can influence morphology and morphometry of cut mark cross-sections [3,4]. In particular, it was observed that a same “category” of lithic implement (for instance an unretouched flint flake) can leave different traces when used for different tasks, such as, for instance, butchery activities or production of engraved art objects on flat bones [4]. At the same time, other research groups begun to use geometric morphometrics to separate between different types of BSMs, achieving interesting results [5,11-14]. Aim of this paper is to use a geometric morphometric approach to analyse cross-sections of two sets of incisions intentionally produced in a previous experimental work [4] in order to evaluate cross-sectional variability of traces produced with similar lithic implements, and to link characteristics of the grooves with those of the cutting edges of the used tools.
II. MATERIALS AND METHODS
Two burins produced by one of the authors (DA) were used to inflict three marks each on a fresh cattle innominate. Both tools are made with the same raw material (flint from the Gargano promontory, south east Italy) and in both cases the cutting edge had the same characteristics: it is a trihedral (Figure 1A). Cut marks and active edge of the burins were scanned by means of a Hirox KH-7700 digital microscope equipped with an MXG-10C body, an OL-140II lens and an AD-10S Directional Lighting Adapter [2,4,15]. Angle α was measured on the 3D model of each burin’s active edge (Figure 1A). Three cross sections were analysed per each mark (taken respectively at 25%, 50% and 75% of mark’s length). Depth of cut (DC) [1,2], was measured on each profile (Figure 1B) and seven landmarks were placed on each cross-section following [9] (Figure 1C). using the software tpsUtil (v. 1.58) and tpsDig (v. 2.17) [16,17]. Raw coordinates of landmarks were imported to MorphoJ software (v. 1.8) [18]. After a Procrustes fit and the generation of a covariance matrix, a Principal Component Analysis was performed on the dataset.
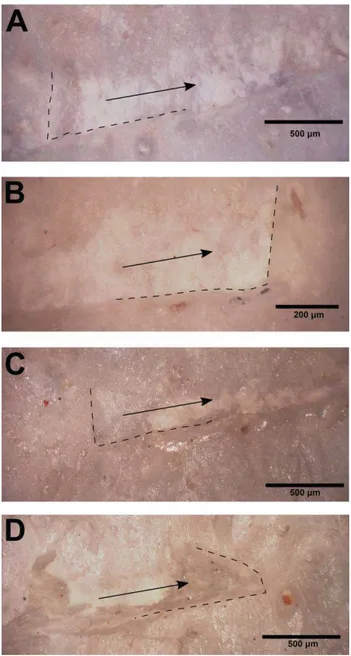
Figure 2. A, B: starting and ending points of a groove produced with Burin 1; C, D: starting and ending points of a groove produced with Burin 2; dotted lines indicate the abrupt edges of the groove; arrows indicate direction of the hand movement.
III. RESULTS
The grooves show some differences with the usually called “slicing cut marks” (sensu Greenfield [19]): the starting and ending point are sometimes abrupt. This is due to the fact that the operator produced grooves of a prearranged length and the applied force didn’t change a lot in the entrance and exit points of the marks in comparison with the force applied in the median part. For this reason, morphological characteristics of the beginning/ending points of the grooves are not important for this study. An example of how do two grooves start
and end is shown in Figure 2.
The grooves produced with the two burins show a significant difference in DC (Mann-Whitney U test, p=0.006). In particular, deeper cuts were inflicted using the Burin 2, ranging DC between 58.7 and 86.9 μm. DC of marks produced with Burin 1 is comprised between 26.6 and 78.7 μm (Figure 3). Being used the same kind of tool, produced with the same raw material, and being the tools applied on the same surface, this difference is due to the different force adopted by the operator, as already observed during other tests [3].
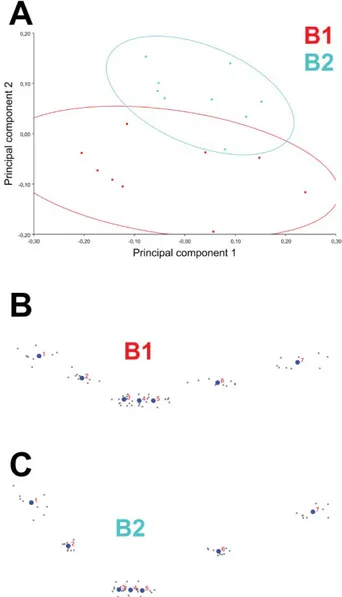
Geometric morphometric analysis is able to discriminate between cut marks produced with the two burins. In particular, the two groups Burin1 (B1) and Burin2 (B2) are differently distributed along the Principal Component 2 (PC2), which describes the 31.5% of the sample’s variance. Value of B2 group are significantly higher than those of group B1 (Mann-Whitney U test, p=0.0005), indicating deeper cross-sections with steeper walls (Figure 4A). The difference in shape between the two groups can be easily seen with the Procrustes analysis shown in figures 4B and 4C. PC1 is not able to separate between the two groups. It describes the 54.8% of sample’s variance and it is more related to the symmetry of the cross-sections.
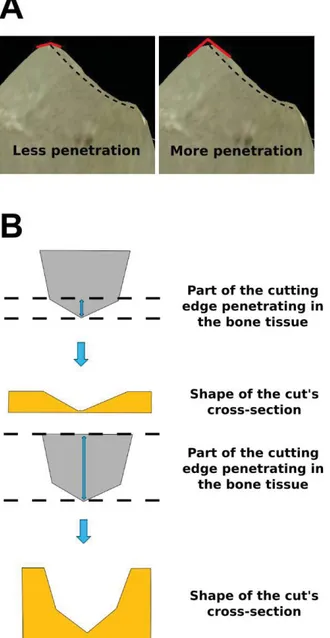
If the analysis moves to the 3D models of the active edges used to inflict the cut marks, it emerges that the angle α is generally wider toward the top of the edge. In the Burin 1, the angle between the two surfaces which form the cutting edge is about 123° if only the first 30 μm are considered, 98° if we consider a depth of 60 μm and 81° if we consider a depth of 85 μm. These values are respectively 119°, 110° and 92° in the Burin 2. Figure 5A shows more clearly how does the angle change if a different depth of the edge is considered in the penetration of the tool into the bone tissue. This implies, that the general shape of the cross-sections of a cut mark depends on the penetration of the cutting edge into the bone tissue (as exemplified in figure 5B).
Fig. 3. DC of cross-sections (in μm) according to used burin (B1: burin 1; B2: burin 2).
Fig. 4. A: PCA performed on the covariance matrix after a Procrustes superimposition. B:Procrustes analysis on group “Burin 1”. C: Procrustes analysis on group “Burin 2”.
IV. DISCUSSION AND CONCLUSION
Data presented in this short contribution show how the shape of mark’s cross-sections can depend from the level of penetration of the cutting edge into the bone tissue. It also highlights the importance of combining shape data from geometric morphometrics with linear measurements (here the depth of cut, DC). Difference in shape found between marks produced with the two burins, are similar to difference in shape found by other authors between marks inflicted using tools produced with different raw
Fig. 5. A. An example of how does the angle α changes depending on the penetration of the cutting edge into the bone tissue. Dotted line: cutting edge. Red lines: the angle α when only 20 μm of flint penetrate into the bone tissue (left) and when 80 μm of flint penetrate into the bone tissue (right). B: schematic sketch explaining the possible influence of the cutting edge on the mark’s cross section, depending on the intensity of the penetration.
materials [5]. A more in depth analysis of tools’ cutting edges should be carried out in order to understand their variability at a microscopic level and if there are differences depending on the raw material, on the nature of the cutting edge (i.e. the specific functional part of the tool) and on the presence/absence of a retouch. Since the
study of marks on bones is of primary importance for the reconstruction of the hominin behaviour in the past [e.g. 5], it is necessary to understand how the above mentioned parameters influence the penetrability of the tools in the bone tissue and, thus, the shape of cut marks.
REFERENCES
[1] S.M.Bello, C.Soligo, “A new method for the quantitative analysis of cutmark micromorphology”, Journal of Archaeological Science 35, 2008, pp.1542-1552. Doi: 10.1016/j.jas.2007.10.018. [2] F.Boschin, J.Crezzini “Morphometrical Analysis on
Cut Marks Using a 3D Digital Microscope”, International Journal of Osteoarchaeology 22, 2012, pp. 549-562. Doi:10.1002/oa.1272
[3] J.Crezzini, F.Boschin, U.Wierer, P.Boscato, “Wild cats and cut marks: Exploitation of Felis silvestris in the Mesolithic of Galgenbühel/Dos de la Forca (South Tyrol, Italy)”, Quaternary International 330, 2014, pp. 52-60. Doi: 10.1016/j.quaint.2013.12.056. [4] E.Moretti, S.Arrighi, F.Boschin, J.Crezzini,
D.Aureli, A.Ronchitelli “Using 3D Microscopy to Analyze Experimental Cut Marks on Animal Bones Produced with Different Stone Tools”, Ethnobiology Letters 6, 2015, pp. 267-275. Doi: 10.14237/ebl.6.1.2015.349.
[5] J.Yravedra, M.Á.Maté-González, J.F.Palomeque-González, J.Aramendi, V.Estaca-Gómez, M.S.J.Blazquez, E. García-Vargas, E.Organista, D.Gónzalez-Aguilera, M.C.Arriaza, L.Cobo-Sánchez, A.Gidna, D.Uribelarrea Del Val, E.Barquedano, A.Mabulla, M.Domínquez-Rodrigo, “A new approach to raw material use in the exploitation of animal carcasses at BK (Upper Bed II, Olduvai Gorge, Tanzania): a micro-photogrammetric and geometric morphometric analysis of fossil cut marks”, Boreas, 2017, Doi: 10.1111/bor.12224.
[6] S.M.Bello, R.Wallduck, S.A.Parfitt, C.B.Stringer, “An Upper Palaeolithic engraved human bone associated with ritualistic cannibalism”, PLoS ONE 12(8), 2017, e0182127.
[7] R.Duches, N.Nannini, A.Fontana, F.Boschin, J.Crezzini, F.Bernardini, C.Tuniz, “Archeological bone injuries by lithic backed projectiles: new evidence on bear hunting from the Late Epigravettian site of Cornafessa rock shelter (Italy)”, Archaeological and Anthropological Sciences 11, 2019, pp. 2249-2270. Doi: 10.1007/s12520-018-0674y.
[8] M.A. Maté González, J.F. Palomeque-González, J.Yravedra, D.González-Aguilera, M.Domínguez-Rodrigo, “Micro-photogrammetric and morphometric differentiation of cut marks on bones using metal knives, quartzite and flint flakes”,
Archaeological and Anthropological Science 4, 2016, pp. 805-816. Doi: 10.1007/s12520-016-0401-5
[9] • A.Moroni, G.Boschian, J.Crezzini, G.Montanari-Canini, G.Marciani, G.Capecchi, S.Arrighi, D.Aureli, C.Berto, M.Freguglia, A.Araujo, S.Scaramucci, J.J.Hublin, T.Lauer, S.Benazzi, F.Parenti, M.Bonato, S.Ricci, S.Talamo, A.G.Segre, F.Boschin, V.Spagnolo, “Late Neandertals in central Italy. High-resolution chronicles from Grotta dei Santi (Monte Argentario - Tuscany)”, 2019, Quaternary Science Reviews 217, pp. 130-151. Doi: 10.1016/j.quascirev.2018.11.021.
[10] F.Boschin, “Exploitation of carnivores, lagomorphs and rodents at Grotta Paglicci during the Epigravettian: The dawn of a new subsistence strategy?”, Journal of Archaeological Science: Reports 26, 101871. Doi: 10.1016/j.jasrep.2019.101871
[11] M.A.Maté González, J.Yravedra, D.González-Aguilera, J.F.Palomeque-González, M.Domínguez-Rodrigo, “Micro-photogrammetric characterization of cut marks on bones”, Journal of Archaeological Science 62, 2015, pp. 128-142. Doi: 10.1016/j.jas.2015.08.006.
[12] M.A.Maté-González, J.Aramendi, J.Yravedra, R.Blasco, J.Rosell, D.González-Aguilera, M.Domínguez-Rodrigo, “Assessment of Statistical Agreement of Three Techniques for the Study of Cut Marks: 3D Digital Microscope, Laser Scanning Confocal Microscopy and Micro-Photogrammetry”, Journal of Microscopy 267, pp. 356-370. Doi: 10.1111/jmi.12575.
[13] J.Yravedra, E.García Vargas, M.A.Maté González, J.Aramendi, J.Palomeque-González, J.Vallés-Iriso, J.Matasanz-Vicente, D.González-Aguilera, M.Domínguez-Rodrigo, “The use of Micro-Photogrammetry and Geometric Morphometrics for identifying carnivore agency in bone assemblage”, 2017, Journal of Archaeological Science Reports 14, pp. 106–115.
[14] J.Yravedra, J.Aramendi, M.A.Maté-González, L.A.Courtenay, D.González-Aguilera, “Differentiating Percussion Pits and Carnivore Tooth Pits Using 3D Reconstructions and Geometric Morphometrics”, 2018, PLoSONE Doi: 10.1371/journal.pone.0194324.
[15] S.Arrighi, V.Borgia, “Surface Modifications of Flint Tools and Their Functional Meaning.”, Materials and Manufacturing Processes 24, 2009, pp. 922-927. Doi: 10.1080/10426910902987150.
[16] F.J.Rohlf, “tpsUtil, file utility program. version 1.58”, Department of Ecology and Evolution, State University of New York at Stony Brook, 2013. [17] F.J.Rohlf, “tpsDig, digitize landmarks and outlines,
version 2.17”, Department of Ecology and Evolution, State University of New York at Stony Brook, 2013.
[18] C.P.Klingenberg, “MorphoJ: an integrated software package for geometric morphometrics”, Molecular Ecology Resources 11, 2011, pp. 353-357. Doi: 10.1111/j.1755-0998.2010.02924.x.
[19] A.Greenfield, “The Origin of Metallurgy in the Central Balkans based on the analysis of Cut Marks on Animal Bones”, Environmental Archaeology 5, 2000, pp. 93-106.