A
A
l
l
m
m
a
a
M
M
a
a
t
t
e
e
r
r
S
S
t
t
u
u
d
d
i
i
o
o
r
r
u
u
m
m
–
–
U
U
n
n
i
i
v
v
e
e
r
r
s
s
i
i
t
t
à
à
d
d
i
i
B
B
o
o
l
l
o
o
g
g
n
n
a
a
DOTTORATO DI RICERCA IN
Ingegneria Civile, Chimica, Ambientale e dei Materiali
Ciclo XXXI
Settore Concorsuale: 08/A2 - Ingegneria sanitaria-ambientale, Ingegneria degli idrocarburi e fluidi del sottosuolo, della sicurezza e protezione in ambito civile
Settore Scientifico Disciplinare: ING-IND/29 – Ingegneria delle materie prime
ENVIRONMENTAL LIFE-CYCLE BASED METHODS TO
SUPPORT THE TRANSITION TOWARDS CIRCULAR ECONOMY
IN THE AGRI-FOOD SECTOR
Presentata da:
Valentina Fantin
Coordinatore Dottorato
Supervisore
Prof. Luca Vittuari
Prof.ssa Alessandra Bonoli
Co-supervisori
Dott.ssa
Patrizia Buttol
(ENEA)
Dott.ssa Serena Righi
i
Abstract
The holistic approach of Life Cycle Thinking (LCT) can support the transition towards sustainable production and consumption patterns, in a circular economy approach. The objective of this dissertation thesis is to critically analyse some peculiar aspects of the application of environmental life-cycle based methods to the agri-food sector and to identify opportunities and obstacles of the LCT approach through the testing of some methods and tools.
The main critical methodological problems of the application of Life Cycle Assessment (LCA) to agri-food sector were described. In particular, since on-field emissions cannot be directly measured at a reasonable effort, the analysis was focused on the necessity of using dispersion models for their estimation. Different models exist but scientific consensus lacks about the most suitable in terms of reliability and practicability. To test how this kind of models work and which data are required, PestLCI 2.0 has been applied to an experimental farm in Northern Italy, and a comprehensive set of pesticide emissions in the different compartments, which is a relevant input for the inventory phase, has been obtained. The application has required collecting detailed information about the soil characteristics, which resulted to affect the outcomes significantly, especially for groundwater emissions. Since the detailed picture of pesticides emissions is not fully captured by the current impact assessment methods, further research efforts will be needed to develop characterisation factors for groundwater emissions, in order to exploit the potential of PestLCI 2.0.
The analysis of the literature concerning the methodological problems highlighted that different scientific approaches used to solve the problems might lead to different life cycle results, thus affecting products comparability, which is important when LCA is used for calculating and communicating the environmental performance of products. In this dissertation thesis, the use of LCA for communication purposes was evaluated through the testing of the Product Environmental Footprint (PEF) method in an Italian Taleggio cheese production chain, with the aim to evaluate if it fulfils the harmonisation needs for the calculation and communication of the environmental performance of food and drink products. Although Product Environmental Footprint Category Rules for dairy products provide quite detailed guidance for some methodological issues, some other topics would require additional guidance. The application of the PEF method resulted to be
resource-ii
intensive: this aspect could make it difficult to spread the method, especially if the goal is to involve European Small and Medium Enterprises. In general, the application of the PEF method could take advantage of the development of simplified supporting tools.
Finally, due to the significant contribution of agricultural sector to water scarcity and water pollution problems, the Water Footprint (WF) Network method was tested in an Italian tomato cultivar production with the aim to evaluate strengths and weaknesses. The study required the collection of a large number of data, some of which obtained from literature due to lack of primary data. Results highlighted that site-specific data are needed to increase the results robustness and demonstrated that the effect of the yield may penalize cultivations with low blue water use, because the model to calculate green water does not depend on the cultivation intensity, thus leading, ceteris paribus, to higher WF in extensive cultivations. Though further research will be needed to develop a common accepted WF method, agri-food companies and public decision makers can take advantage of this method to support a sustainable water management and the implementation of green marketing strategies.
iii
List of acronyms
AF = Allocation factor
AMD = Availability Minus the Demand
ARPAV = Veneto Regional Agency for Environmental Prevention and Protection ARPAV = Veneto Regional Agency for Environmental Prevention and Protection AWARE = Available WAter REmaining for area in a watershed),
B2B = Business to Business B2C = Business to Consumers BIB1 = Bibione soil
C = Clay
CAB1 = Caberlotto soil CAP1 = Capitello soil CFO1 = Ca' Fornera soil
CMT = Meteorological Centre of Teolo CON1 = Conche soil
CRL1 = Caorle soil CTU1 = Ca' Turcata soil DM = Dry Matter
DNM = Data Needs Matrix DQR = Data Quality Rating
EEA =European Environment Agency EF = Environmental Footprint
EMEP = European Monitoring and Evaluation Programme EPD = Environmental Product Declaration
ET = Evapotranspiration
iv IPCC = Intergovernmental Panel on Climate Change IPP = Integrated Product Policy
L = Loam
LCA = Life Cycle Assessment LCI = Life Cycle Inventory analysis LCIA = Life cycle impact assessment LCIA = Life Cycle Impact Assessment LCT = Life Cycle Thinking
LS = Loamy sand
MEL1 = Casa Scaramello soil
OEF = Organisation Environmental Footprint Organization PDO = Product Designation of Origin
PEF = Product Environmental Footprint
PEFCR =Product Environmental Footprint Category Rules QUA1 = Quarto d'Altino soil
S = Sand
SAB1 = Sabbioni soil SCL = Sandy clay loam SCO1 = Santa Scolastica soil SIC = Silty clay
SICL = Silty clay loam SIL = Silt loam
SL = Sandy loam
SOIL6 = Default soil from PestLCI 2.0 database SMEs = Small and Medium Enterprises
v TDF1 = Torre di Fine soil
VAD1 = Valcerere Dolfina soil VAN1 = Vanzo soil
VED1 = Casa Vendramin soil WF = Water Footprint
WFA = Water Footprint Assessment WFN = Water Footprint Network
1
Table of Contents
Abstract ... i
List of acronyms ... iii
1 Introduction and objectives ... 9
2 Circular economy ... 14
2.1 European policies for circular economy ... 17
3 Circular economy in the agri-food sector ... 20
3.1 Problems of the linear economic model in the agri-food sector ... 20
3.2 Benefits of the circular economy in the agri-food sector ... 22
4 Life Cycle based methods to support the transition towards circular economy in the agri-food sector ... 24
4.1 Life Cycle Assessment ... 25
4.2 Water Footprint ... 28
4.3 Application of LCA in the agri-food sector: main methodological problems.... 30
4.3.1 Definition of the functional unit ... 31
4.3.2 System boundaries definition ... 34
4.3.3 Allocation procedures ... 35
4.3.4 Emission models for pesticides and fertilisers emissions ... 39
5 Harmonised LCA guidelines for agri-food production chain ... 45
5.1 ILCD Handbook ... 46
5.2 Envifood Protocol ... 48
5.3 Product Environmental Footprint method ... 49
6 PestLCI 2.0 sensitivity to soil variations for the evaluation of pesticide distribution in LCA studies ... 53
6.1 Description of PestLCI 2.0 ... 54
6.2 Soil and tillage sensitiveness evaluation method ... 59
6.3 Experimental farm description ... 60
6.3.1 Climatological data ... 60
6.3.2 Soil data ... 60
6.3.3 Crop and pesticide data ... 67
2
6.4.1 Results of Test 1: comparison among TDF1 and similar soils ... 68
6.4.2 Results of Test 2: comparison among TDF1 and different soils ... 75
6.4.3 Results of Test 3: comparison between TDF1 and Soil6 ... 78
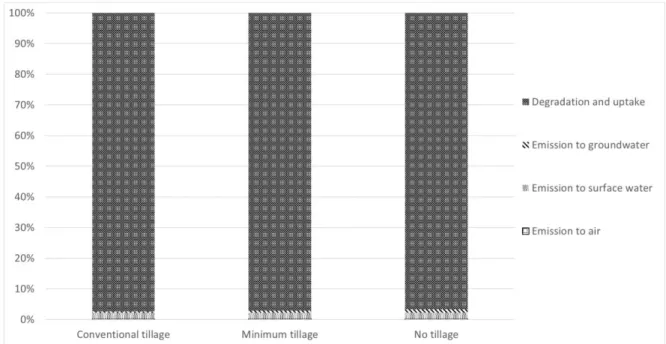
6.4.4 Results of Test 4: TDF1 with different types of tillage ... 79
6.5 Conclusions ... 83
7 Product Environmental Footprint Category Rules for dairy products ... 86
7.1 Functional unit ... 87
7.2 System boundaries ... 87
7.3 Handling of multi-functionality ... 88
7.4 On-farm pesticides and fertilisers emissions and livestock emissions ... 90
7.5 Water use and related impacts ... 92
8 PEF study on Taleggio cheese production ... 93
8.1 Goal and scope of the study ... 93
8.1.1 Goal of the study ... 93
8.1.2 Functional unit and reference flow ... 93
8.1.3 Description of the life cycle of the analysed product ... 94
8.1.4 System boundaries and system boundaries diagram ... 95
8.1.5 Assumptions and relevant justification ... 99
8.1.6 Information about the data used and data gaps ... 99
8.1.7 Impact assessment methods and indicators ... 100
8.1.8 Treatment of multi-functionality ... 101
8.2 Life cycle inventory analysis ... 102
8.2.1 Description and documentation of all the unit processes data collected .... 102
8.2.2 Life cycle inventory ... 104
8.3 PEF impact assessment results ... 127
8.3.1 Characterization results ... 127
8.3.2 Normalisation results ... 128
8.4 Interpretation of PEF results ... 128
8.4.1 Most relevant impact categories ... 128
8.4.2 Most relevant direct elementary flows ... 129
8.4.3 Most relevant processes and life cycle stages ... 129
3
8.5 Conclusions ... 132
9 Water Footprint Network method and ISO 14046 ... 134
9.1 Water Footprint method by the Water Footprint Network ... 134
9.1.1 Setting goals and scope ... 135
9.1.2 Water Footprint Accounting: calculation of blue, green and grey WF ... 136
9.1.3 Water Footprint sustainability assessment ... 139
9.1.4 Water Footprint response formulation... 142
9.2 The WF by ISO 14046 ... 143
9.2.1 Goal and scope definition ... 144
9.2.2 WF inventory analysis ... 145
9.2.3 WF impact assessment ... 145
9.2.4 Interpretation of results ... 147
9.3 Comparison between the WF Network method and ISO 14046 ... 147
10 Water Footprint of Italian tomato production ... 151
10.1 Calculation of Water Footprint of crop growth ... 152
10.2 Calculation of Green WF ... 154
10.3 Calculation of Grey WF ... 162
10.4 Results and discussion ... 167
10.5 Conclusions ... 170
11 Conclusions ... 173
References ... 178
ANNEX 1 ... 199
4
List of Figures
Figure 1. Representation of the life cycle phases in the linear and circular economy models (Source: Personal elaboration adapted from www.riciclanews.it). ... 16 Figure 2. Schematic representation of product’s life cycle (Source: ENEA)... 25 Figure 3. Four main phases of LCA method (Source: Personal elaboration adapted from ISO, 2006a). ... 27 Figure 4. Representation of the technosphere box and of the emissions from the application of PestLCI 2.0 (Source: Personal elaboration adapted from Birkved and Hauschild, 2006). ... 55 Figure 5. Modular structure of PestLCI 2.0 (Source: Personal elaboration adapted from Dijkman et al., 2012). ... 57 Figure 6. Correlation analysis among some soil characteristics and emission fractions of pesticides. Figures a), b) and c) refer to the first experiment (among similar soils); figures d), e), f), g), h) and i) refer to the second experiment (among different soils) (Source: Personal elaboration). ... 74 Figure 7. Percentage of Terbuthylazine emitted in pre-emergence according to the different types of tillage (Source: Personal elaboration). ... 82 Figure 8. Percentage of Metolachlor emitted in post-emergence according to the different types of tillage (Source: Personal elaboration). ... 83 Figure 9. System boundaries of Taleggio cheese production (Source: Personal elaboration). ... 98 Figure 10. Representation of the components of a Water Footprint (Source: Personal elaboration adapted from Hoekstra et al., 2011). ... 135 Figure 11. The four phases of the Water Footprint sustainability assessment in a river basin (Source: Personal elaboration adapted from Hoekstra et al., 2011). ... 139 Figure 12. Phases of a WF assessment according to ISO 14046 (Source: Personal elaboration adpated from ISO 14046, 2016). ... 144 Figure 13. Comparison between the WFN method and ISO 14046 (Source: Personal elaboration adapted from Boulay et al., 2013). ... 150 Figure 14. Climate parameters inserted in CROPWAT software (Source: CROPWAT software, personal elaboration). ... 156 Figure 15. Rainfall values inserted in CROPWAT (Source: CROPWAT software, personal elaboration). ... 157 Figure 16. Crop parameters inserted in CROPWAT (Source: CROPWAT software, personal elaboration). ... 158
5
Figure 17. Sandy soil parameters (Source: CROPWAT software, personal elaboration). ... 158 Figure 18. Calculation of the evapotranspiration by the “Irrigation schedule option” (Source: CROPWAT software, personal elaboration). ... 160 Figure 19. Effect of water stress conditions (Ks<1) (Source: CROPWAT software, personal elaboration). ... 161 Figure 20. Comparison among the Green, Blue and Grey Water Footprint for open-air rainfed, open-air irrigated and greenhouse tomato production (Source: Personal elaboration adapted from Chico et al., 2010), which shows the relationship between the WF values and the type of production system... 170
6
List of Tables
Table 1. Summary characteristics of considered soils (Source: Fantin et al., 2019, reproduced by permission of Elsevier). ... 64 Table 2. Summary characteristics of considered soils (Source: Fantin et al., 2019, reproduced by permission of Elsevier). ... 66 Table 3. Quantity and type of pesticide applied for maize cultivation on the Vallevecchia experimental farm. (Source: Fantin et al., 2019, reproduced by permission of Elsevier). . 67 Table 4. Distributions of pesticide among the environmental compartments obtained with Pest LCI 2.0 model and using site-specific data (TDF1) and those obtained applying data of soils with similar characteristics. Figures indicate the fraction of pesticide emitted in each environmental compartment. (Source: Fantin et al., 2019, reproduced by permission of Elsevier). ... 70 Table 5. Distributions of pesticide among the environmental compartments obtained with Pest LCI 2.0 model using site-specific data (TDF1) and those obtained applying data of soils with different characteristics. Figures indicate the fraction of pesticide emitted in each environmental compartment. (Source: Fantin et al., 2019, reproduced by permission of Elsevier). ... 77 Table 6. Results of the application of PestLCI 2.0 model for each active ingredient and for TDF1 soil and Soil6. Values indicate the fraction of pesticide emitted in each environmental compartment. (Source: Fantin et al., 2019, reproduced by permission of Elsevier). ... 79 Table 7. Results of the application of PestLCI 2.0 model for each active ingredient and for TDF1 soil varying the tillage system. (Source: Fantin et al., 2019, reproduced by permission of Elsevier). ... 81 Table 8. List of impact categories and related assessment methods used. ... 101 Table 9. Normalization and weighting factors. ... 101 Table 10. Data collected from the dairy company in relation to unripened Taleggio cheese production. ... 103 Table 11. Data collected from the ageing company in relation to ageing and packing. .. 104 Table 12. Inputs and outputs for the cheese production stage at the dairy company. ... 106 Table 13. Inputs and outputs for the ageing stage at the ageing company. ... 108 Table 14. Types and amount of ripened Taleggio sizes produced at the ageing company and the relevant type and amount of primary packaging. ... 108 Table 15. Inputs and outputs for the cheese production at the dairy company. ... 110
7
Table 16. Allocation factors at the dairy unit for conventional Taleggio cheese production.
... 111
Table 17. Parameters for the calculation of the average weighted distance for the transport of unripened Taleggio cheese to the ageing company... 112
Table 18. Inputs and outputs for the ageing stage at the ageing company. ... 114
Table 19. Allocation factors at the ageing company for ripened Taleggio cheese production. ... 114
Table 20. Inventory table in relation to 10 g Dry Matter of ripened Taleggio cheese. .... 121
Table 21. Parameters used to model the treatment of organic waste. ... 124
Table 22. Parameters used to model the treatment of paper waste. ... 125
Table 23. Parameters used to model the treatment of cardboard waste. ... 125
Table 24. Parameters used to model the treatment of plastic waste. ... 126
Table 25. Parameters used to model the treatment of wood waste. ... 127
Table 26. Characterised values for Taleggio cheese in relation to the Functional Unit (10 g dry matter = 20.4 g of cheese). ... 128
Table 27. Normalised values for Taleggio cheese in relation to the Functional Unit (10 g dry matter = 20.4 g of cheese). ... 128
Table 28. Most relevant elementary flows in relation to the most significant impact categories. ... 129
Table 29. Contribution of the life cycle stages to the overall impact for the most relevant impact categories. ... 131
Table 30. Considered values for the Data Quality Rating of milk production process. ... 132
Table 31. Primary cultivation data for the production of the PDO Italian tomato. ... 152
Table 32.Values for the Kc crop coefficient and maximum crop height (Source: Personal elaboration adapted from Allen et al., 1998). ... 155
Table 33. Results of the evapotranspiration and green Water Footprint. ... 161
Table 34. Minimum, average and maximum values of the leaching-runoff fraction α for nutrients, metals and pesticides (Source: Personal elaboration adapted from Franke et al., 2013). ... 162
Table 35. Minimum, average and maximum values of the β leaching fraction for nitrogen and phosphorus (Source: Personal elaboration adapted from Franke et al., 2013). ... 163
Table 36. Factors influencing leaching-runoff potential for nitrogen (Source: Personal elaboration adapted from Franke et al., 2013). ... 164
Table 37. Agricultural management practice questionnaire (Source: Personal elaboration from Franke et al., 2013). ... 165
8
Table 38. Results of the grey Water Footprint. ... 167 Table 39. Water Footprint values and yield (Y) for some case studies about tomato cultivation in the mediterranean region. ... 168
9
1 Introduction and objectives
Agriculture and agri-food sector satisfy one of the most important human needs, i.e. nutrition and provide significant social and economic values. As regards Italian situation, the agri-food sector is a priority sector for national economy, due to both its cultural, social and economic importance and to the peculiarities and specific characteristic of Italian food and drink products. Nevertheless, the traditional economic model, the so-called “linear economy”, applied in the last century also in the agri-food sector, as in all the other manufacturing sectors, and based on the massive exploitation of non-renewable resources and to the production of significant amount of waste, has become unsustainable (Ellen MacArthur Foundation, 2013a). In fact, food and drink supply chain has several important environmental impacts and is the main responsible for the land use change, the loss of biodiversity, the greenhouse gas emissions and the use of freshwater (European Commission, 2011). Without appropriate offsetting measures, severe consequences for both the world population and the environment could occur, such as the lack of food availability and food security and the almost complete depletion of natural resources. Because of these reasons, the agri-food sector should move from linear economy models to circular economy ones, which include sustainable production and consumption patterns and which could decouple the economic growth from the environmental impacts and the use of resources (European Commission, 2014a). These topics are included in the most important international agendas, such as the United Nations’ Global Agenda for Sustainable Development, which has been signed also by Italian government in 2015, and the related seventeen Sustainable Development Goals. At European level, the European Commission’s communication "Closing the loop – An EU Action Plan for Circular Economy" (COM (2015) 614) represents the most important policy document which defines circular economy and introduces an action plan for the implementation of a legislative framework for the development of circular economy measures in all member states.
However, the transition towards sustainable consumption and production systems in the agri-food sector, in a circular economy approach, requires the use of robust and scientific methods which can support sustainability assessment of the overall analysed system for several sustainability indicators, by appropriately evaluating the consequences of all the possible circular options, both from an economic, environmental and social point of view.
10
Life Cycle Thinking (LCT) approach, which takes into account the whole product’s life cycle, from the extraction of raw materials, to the product manufacturing, its transport and distribution, and the final waste disposal can support this transition, because it can be used for the assessment of the impacts and benefits associated to circular solutions in the agri-food supply chain, avoiding burden shifting from a phase to another of the life cycle, and from an environmental compartment to another one.
The objective of this dissertation thesis is to critically analyse some peculiar aspects of the application of environmental life-cycle based methods and tools to the agri-food sector. The application of this holistic approach to agri-food production chains allows the evaluation of their overall ecological performance and supports product development as well as the implementation of improvement strategies. However, it presents also some technical and methodological problems that risk to limit a wide use of the approach. In this work opportunities and obstacles of the approach will be identified through the testing of some methods and tools and needs for future developments will be discussed.
Among the life-cycle based methods, Life Cycle Assessment (LCA), standardised by the ISO 14040 series (ISO 2006a, b), is recognised as a strategic and effective tool to evaluate the potential environmental impacts occurring in the whole product's life cycle as well as to identify possible areas for improvement. LCA has been used in the recent years to evaluate the environmental impacts of a wide variety of agri-food products, contributing to identify the environmental hotspots of the supply chain and the potential improvement opportunities (Notarnicola et al., 2012). Nevertheless, when applying LCA to food and drink products, the practitioner has to deal with methodological problems which stem from the peculiarities and specific characteristics of the agri-food supply chain. In fact, differently from industrial production systems, agri-food supply chains are characterised by complex relationships both between inputs (for example nutrients and soil) and outputs (crops and emissions) and more in general between biological processes and processes of technological systems, which are difficult to be modelled in LCA studies. In particular, the inventory phase of LCA studies for food and drink products involves the estimation of on-field emissions due to the use of fertilisers, pesticides, or emissions from livestock, such as ruminants’ enteric fermentation, which cannot be directly measured at a reasonable cost and effort. This is one of the main critical problems in LCA studies of agri-food products, because these emissions must be calculated by dispersion models, which are based on several agricultural or livestock site-specific parameters that have to be collected or
11
alternatively found in literature (for example the nitrogen content in manure) and which therefore require specific knowledge in this field. Several literature models are available in literature, but no scientific consensus still exists on which one should be used.
Among the main critical methodological problems of the application of LCA to agri-food sector, which will be described in this dissertation thesis, due to the relevance of the problem for the impact on ecosystems and human health, a focus will be given to the calculation of on-field emissions due to the use of pesticides at inventory level by applying the detailed PestLCI 2.0 model (Dijkman et al., 2012) to an experimental farm in Northern Italy, with the aim to verify the model’s sensitiveness to soil variations.
LCA can also be used to communicate the environmental performance of products business to business (B2B) or business to consumers (B2C), representing a marketing opportunity for agri-food companies to increase competitiveness. In fact, LCA and more in general the LCT approach are the basis of many ecological labels, in particular those compliant with ISO 14020, such as the European Ecolabel or the Environmental Product Declaration (EPD), which have been increasingly applied in the last recent years to a great variety of products, including food and drink products. However, when LCA is used to communicate the environmental performance of agri-food products, the different scientific approaches used to deal with the methodological issues might lead to different LCA results, making it difficult to compare the environmental performance of products of the same category. The European Commission’s Product Environmental Footprint (PEF) recommendation, developed in 2013 (European Commission, 2013a), and the integrating documents aim to fulfil the need for harmonisation to calculate and communicate environmental footprint of products. Through the development of ‘category rules’ for food and drink products, detailed requirements should be provided for each stage and process of the life cycle, thus supporting products comparability. In this dissertation thesis, the use of LCA for communication purposes was tested by analysing how the PEF method responds to these harmonisation needs, and applying it to an Italian Taleggio cheese supply chain, highlighting also the advantages and difficulties of this approach.
Another life-cycle based tool developed in the last years and progressively used in the agri-food sector, also for communication purposes, is Water Footprint (WF), which is an assessment of the water use by products, individuals, companies or the entire population. Agricultural sector is indeed a major contributor to water scarcity and water pollution problems, and it is therefore essential to have tools and methods to understand how water
12
use is affected by our production and consumption choices as well as to support a better management of water resources. In this context, the Water Footprint concept has created a lively discussion within the scientific community in the last years, because two methods, both based on a LCT approach, have been developed in parallel: the WF method by the Water Footprint Network (WFN) (www.waterfootprint.org), published in 2011 (Hoekstra et al., 2011), and the ISO 14046 standard, published in 2016 (ISO, 2016). The former defines the WF as the total volume of freshwater used to produce the goods and services consumed by the individual or the community or produced by a company, whereas the latter is based on the ISO 14040 LCA method and defines the WF as a metric to quantify the potential environmental impacts of products and services related to water throughout their life cycle.
The two methods are therefore different from each other, because the method of the Water Footprint Network follows a volumetric approach focused also on the quality of water and aims to support a sustainable use of water resources, whereas the latter is focused on product’s environmental impacts due to the use of water. In this work, the WF method of the WFN, which has been increasingly used in literature in the last years to evaluate the water use of several agri-food products, was applied to the production of an Italian tomato cultivar with the Product Designation of Origin label, with the aim to evaluate practicability of the method as well as its strengths and weaknesses.
The research activity performed during the PhD course and presented in this dissertation thesis was carried out in cooperation with ENEA – Italian National Agency for New Technologies, Energy and Sustainable Economic Development, Laboratory Resources Valorisation, Division Resource Efficiency, Deparment for Sustainability.
The dissertation thesis is divided in 11 chapters. Chapters 1 provides an overview of the objectives of the research activity performed during the PhD. Chapters 2 and 3 presents circular economy and its possible benefits in the agri-food sector. Chapter 4 and 5 introduce LCA and Water Footprint methods, describe the main methodological problems of the application of LCA in the agri-food sector and the available harmonised LCA guidelines for the agri-food sector. Chapter 6 presents the case study performed to test PestLCI 2.0 model and evaluates its sensitivity to soil variations. Chapters 7 and 8 describe how the Product Environmental Footprint Category Rules for dairy products fulfil the need for harmonisation to calculate and communicate environmental footprint of dairy products and present the PEF case study performed on Taleggio cheese production.
13
Chapter 9 outlines and compares the two available WF methods and Chapter 10 describes the WF study on Piennolo tomato production. Finally, general conclusions for the overall research activity are included in Chapter 11.
14
2 Circular economy
Chapters 2 and 3 are based on the following publication, performed during the PhD:
Chiavetta C., Fantin V., Cascone C., 2017. L’Economia Circolare nel settore
agroalimentare e il Life Cycle Assessement come strumento a supporto: il progetto FOOD CROSSING DISTRICT. ENEA Technical report,
USER-PG64-003, June 2017 (Confidential).
The linear economic model, also known as “take-make-dispose”, based on the extraction of raw materials, their transformation into manufactured products, their consumption and finally their disposal as waste, has characterized the global industrial development over the last 150 years (Ellen MacArthur Foundation, 2013a) (Figure 1). This production and consumption pattern allowed the economic growth and the improvement of the world population well-being, but it is based on the intensive exploitation of non-renewable resources and energy and has therefore become unsustainable.
According to Krausmann et al., (2009), in the last century, the use of raw materials by European industrialization has increased tenfold and the domestic energy consumption has increased by seven times. Globally, in the next decade, the economic growth will require 30% increase in the demand of oil, coal, iron and other resources, especially for the emerging countries (Ellen MacArthur Foundation, 2013a). Production efficiency can contribute to decrease the quantity of raw materials and energy necessary for the production of goods, but it cannot decouple the consumption and degradation of resources from the economic growth (Ellen MacArthur Foundation, 2013). Therefore, this linear system should refer to unlimited resources to be sustainable. The linear model presents different kind of waste and losses, both in the production phases and in the consumption and post-consumption ones, where most materials are not recovered at the end of their life, but they are disposed in landfills. For example, in Europe, around 60% of materials at the end of their lifecycle are not recycled, reused or composted. Moreover, only 5% of the resource initial value is recovered after its first use (Ellen Mac Arthur Foundation et al., 2015). Further critical issues are the energy loss, because high quantity of energy is required in the first phases of the production chain to extract and manufacture raw
15
materials, and the damage to terrestrial ecosystems and biodiversity (Ellen MacArthur Foundation, 2013b).
According to the forecasts, the current imbalances will tend to increase, leading to higher competition for obtaining the natural resources necessary to satisfy the linear economy model. In fact, world population will increase by 1 billion in 2030 and the global population will reach 8.5 billion individuals (United Nations, 2015).
The above-mentioned dynamics will compromise the stability of the linear economy model. In fact, without a change in production policies, in the legislation and in the people behaviour, the imbalance between supply and demand for resources will increase considerably (Ellen MacArthur Foundation, 2013a).
A production and consumption system which decouples economic growth from the intensive use of rapidly expiring resources is therefore necessary. This means that every product should enter into a cycle, which can be repeated several times, to ensure that its productivity increases. In this way, the production capacity of renewable resources will be safeguarded and the natural ecosystems will be protected, to guarantee the well-being of current and future generations (Ghisellini et al., 2016). The circular economy is “an industrial economy that is restorative by intention and design” (Ellen MacArthur Foundation, 2013a). It is based on the radical rethinking of the way in which value is created. Products’ materials and components are thus designed to be part of a cycle that aims to maintain the maximum value as long as possible. This means that the design of products is aimed at facilitating their reuse, their disassembly, repair, refurbishing and recycling. Moreover, waste becomes resource for other production cycles (Jurgilevich, 2017; Ellen MacArthur Foundation, 2013a). The transition to circular economy entails a complete change over the whole value chain, including new product design, circular business models, transformation of waste into resources and new consumption patterns. These goals can be achieved by strong cooperation among industries, policy makers and consumers, and by technological, social and finance innovation (European Commission, 2014a).
16
Figure 1. Representation of the life cycle phases in the linear and circular economy models
(Source: Personal elaboration adapted from www.riciclanews.it).
This new configuration of production and consumption activities has a close correlation with non-linear systems based on frequent interactions, such as those of living beings. The fundamental principle is the systemic view. In the Cradle to Cradle philosophy, two types of cycles are distinguished: the "technical" cycles and the "biological" ones, and each of them follows a different path to close the loop (McDonough and Braungart, 2003). The "biological" components are designed to be safely released into the biosphere, they do not contain toxic substances and can be easily composted. The result is the reconstitution of natural capital, extremely important for the well-being of ecosystems and terrestrial species. On the other hand, the "technical" components are designed to recirculate at the highest possible value, without connecting to the biosphere (McDonough and Braungart, 2003). In addition to the Cradle to Cradle design, other theories have inspired the Circular Economy concept since the ‘70s, such as the, the Performance Economy (Stahel, 2006), the theories of Industrial Ecology (Lifset and Graedel, 2001), the Blue Economy (Pauli, 2010).
17
The circular economy model is established on three main principles (Ellen MacArthur Foundation et al., 2015):
The protection and growth of natural capital, through the control of limited quantities of non-renewable resources and the balancing of flows of renewable resources.
The optimization of the resource productivity by means of the permanence in the "biological" or "technical" cycles of products, components and materials, at the highest possible value.
The centrality of the identification of environmental impacts and a design that excludes negative externalities, in order to achieve system effectiveness.
The transition to the circular economy model can lead to several opportunities and benefits from the economic, environmental and social point of views (Ellen MacArthur Foundation et al., 2015). As regards the economic advantages, they would be the revenue increase from circular economy activities and the decrease of production costs due to the increase in the utilisation rate of resources as well as the employment growth and greater innovation, by means of new technologies and higher production efficiency. Several benefits for the environment would also occur, such as the reduction of carbon dioxide emissions into the atmosphere, the lower consumption of virgin materials, the reduction of both land use and the release of toxic substances. Finally, circular economy will also benefit the society and consumers, because there would be increased spending opportunities, due to products and services lower prices, customisation of products according to people needs and reduced products obsolescence (Ellen MacArthur Foundation et al., 2015).
2.1 European policies for circular economy
In the framework of sustainable development policies, the European Commission has developed in 2011 a Roadmap to Resource Efficient Europe (COM (2011) 571) (European Commission, 2011), which is part of the Europe 2020 strategy (COM (2010) 2020) (European Commission, 2010) for a competitive, inclusive and sustainable European economy. It aims at both increasing the productivity of resources and reducing the environmental impacts for the decoupling of economic growth from the environmental burdens. The Roadmap foresees several actions in this context, such as the development of
18
new sustainable production and consumption models, with the focus on the entire products life cycles, the reduction of waste and losses by 50%, with particular attention to the agri-food sector, the valorisation of waste, by means of recovery, recycling and regeneration; the financing of eco-innovation projects; the elimination of environmentally harmful subsidies, the protection of natural ecosystems and biodiversity; the reduction of land use and improvement of soil quality; the identification of improvement solutions for those sectors with a considerable environmental impact, i.e. food, construction and mobility. Therefore, the Roadmap includes several main topics related to circular production and consumption systems and the development of the circular economy within the European market, in order to obtain a greater global competitiveness, to support the sustainable growth and the employment growth.
A further action plan, "Closing the loop – An EU Action Plan for Circular Economy" (COM (2015) 614) (European Commission, 2015) involves all phases of the products life cycle. According to EU, “Circular economy systems keep the added value in products for as long as possible and eliminates waste. They keep resources within the economy when a product has reached the end of its life, so that they can be productively used again and again and hence create further value” (European Commission, 2014b). The solutions proposed by the Action Plan include eco-design, the choice of sustainable production techniques, the creation of industrial symbiosis projects and the adoption of the Extended Producer Responsibility policies. The consumption phase is supported by the introduction of environmental and energy labelling for products, the use of eco-design to extend the product’s life, by its reuse and repair, with the aim to avoid waste production, the reduction of household waste, the promotion of Green Public Procurement, the development and favouring of sharing economy models to share products and infrastructures and to boost the consumption of services rather than of products. The waste management actions include the compliance with the waste hierarchy, established by the EU in 2008 (prevention, preparation for re-use, recycling, energy recovery, disposal), prioritizing the waste reduction by eco-design and the recovery of the highest possible value, also increasing the recycling rate.
Furthermore, the Action Plan highlights that a market for recycled materials and secondary raw materials will be promoted, including recycled nutrients, with the aim to reduce the extraction of virgin materials. New sources of investment to finance innovative projects in the circular economy field will be introduced as well. Finally, circular actions
19
will be developed for some priority sectors, such as: 1) plastics, to increase their recycling and biodegradability and the recycling of plastic packaging; 2) food waste, to develop a common methodology for quantifying them as well as measures to facilitate the food donation and the use of by-products for feed production; 3) critical raw materials, to encourage their recovery; 4) construction and demolition waste; 5) biomass and biological products to promote the efficient use of bioresources and to support innovation in the bioeconomy field (European Commission, 2015).
20
3 Circular economy in the agri-food sector
3.1 Problems of the linear economic model in the agri-food sector
The agri-food sector involves 40% of the European land, contributes to satisfy one of the most important human needs, i.e. nutrition, provides several ecosystem services essential for our planet as well as social and cultural and economic value (European Environmental Agency, 2015; Notarnicola et al., 2017). Nevertheless, several risks threaten the stability of the linear economic model and the agri-food sector will suffer significant direct consequences, if appropriate offsetting measures will not be established. The Department of Agriculture of the U.S.A and Food and Agriculture Organisation (FAO) estimate that by 2030 there will be a greater demand for crops, equal to 40-50% higher than that of 2010 (Ellen MacArthur Foundation, 2013b). Moreover, the doubling of agricultural food production during the past 35 years was associated with a significant increase (from 1.1 to 6.87-fold) in nitrogen and phosphorus fertilization, in the amount of irrigated cropland and in land for cultivation (Fantin et al., 2017; Tilman et al., 2002). Intensive agricultural production has thus had strong impacts on the diversity, composition, and functioning of the natural world ecosystems and on their capacity to provide society with a variety of ecosystem services (Fantin et al., 2017; Tilman, 1999).
The combined use of mineral fertilizers, pesticides and massive irrigation, generated great prosperity in agriculture, satisfying the growing demand for products. Nevertheless, the trend has been reversed in the last years: the land productivity has been reduced and it was not able to satisfy the demand of the growing world population. In the next few years, hectares of fertile land will decrease by 25-35% compared to the 1.5 billion currently cultivated (Ellen MacArthur Foundation, 2013b). In addition, due to an increasingly intensive and industrialized agriculture, another important form of degradation is soil nutrient depletion. The high use of mineral fertilizers has caused negative imbalances in the soil characteristics, causing an excess of nutrients withdrawn from the soil compared to input nutrients, eutrophication phenomena, the destruction of biodiversity and the increase in the concentration of greenhouse gases in the atmosphere, due to increasingly specialized agricultural techniques based on fossil fuels consumption (Ellen MacArthur Foundation, 2013b). As regards direct environmental impacts, the food and drink production chain in the EU causes 17% of the greenhouse gases direct emissions and 28%
21
of the natural resource use and the consumption of meat requires involves a huge utilisation of water (European Commission, 2011).
A further critical issue in the agri-food sector is the loss of value throughout the supply chain, e.g. crops damage due to climatic and environmental conditions, losses of agricultural products which do not comply with market standards and the degradation during transport and storage (Ellen MacArthur Foundation et al., 2015). The use of water for agricultural purposes is a quarter of the total water demand, and almost 25% is lost during the transfer to the final point (European Environmental Agency, 2012). In the processing phases, 8% -12% of inputs are lost, without contributing to the final value, frequently due to non-optimised processing techniques or to strict specifications for finished products (FAO, 2011). The problem of the lost value in the distribution phase concerns mainly developing countries, where, in the post-harvest phases, the conservation and the sale of agricultural products are not efficiently managed. In developed countries, this loss occurs mainly in the use phase, where a large quantity of food is purchased but not consumed (FAO, 2011). It is estimated that around 30% of the food produced is wasted (FAO, 2011). In particular, 90 million t of food are wasted every year in Europe, equal to 180 kg per person (European Commission, 2011). Finally, a great loss of value occurs in the post-consumption phase, where large quantities of food waste are not further recovered and are treated as waste (FAO, 2011). The agricultural sector is therefore a major contributor to the waste stream stemming from the linear production and consumption model. Because of these reasons, the lack of environmental sustainability can negatively affect the functioning of the agri-food supply chain, in terms of production of safe food with a fair cost, and more in general the competitiveness of the agri-food industry (European Commission, 2014a).
Therefore, a transition towards circular economy models in the agri-food supply chain, which include sustainable production and consumption patterns, is required, which would increase system productivity while decreasing its environmental impacts (European Commission, 2014a). Without this systemic shift, the environmental impacts of the agri-food supply chain will increase significantly in the next years and probably they will exceed the planetary boundaries (Notarnicola et al., 2017).
The circular economy model aims to overcome the limits of the current system, moving from maximizing the performance of individual elements to optimizing the entire
agro-22
food system: the increase in performance must be followed by the improvement of quality of soil, water and air (Ellen MacArthur Foundation et al., 2015).
The application of circular economy concept in the agri-food production chain involves the reduction of waste, the utilisation of by-products and food waste, the recycling of nutrients (Jurgilevich et al., 2017), the sustainable use of resources (soil, land, water, biodiversity), the use of renewable natural resources (i.e. biomass), the avoidance of food waste and surplus (Rood et al., 2017), the production and consumption of products with a better environmental performance throughout their life cycle, the application of both cleaner technologies and eco-innovation in production processes. In these ways, the resources will be used efficiently within a life cycle of a product, and waste produced will be both minimized and re-used as much as possible in other production chains, thereby providing economy with added value and causing lower environmental impacts (Rigamonti et al., 2017). All the above measures must be implemented both at the producer and consumer levels and in the waste management systems (Jurgilevich et al., 2017).
3.2 Benefits of the circular economy in the agri-food sector
The benefits of maintaining the components of agro-food products within "biological" cycles can be summarized in three macro-categories: the supply of new raw materials, such as the bio-chemical substances contained in waste, soil regeneration and energy production (Ellen MacArthur Foundation et al., 2015). The extraction of components with excellent chemical-physical properties takes place within bio-refineries, which process organic materials, such as agricultural residues and food waste, to obtain chemical and biofuel substances. The food industry can capture all the value contained in waste and by-products by exploiting the cascade use. The involvement of all stakeholders, such as industry associations and government bodies, as well as companies, is essential for creating favourable conditions for new business ideas (Ellen MacArthur Foundation et al., 2015). A major role to obtain these objectives is played by technological and process innovation. A main feature of the circular economy in the agri-food sector is the capacity of soil restoration in order to promote a higher fertility rate, thus increasing crop productivity. Manure and other food and animal waste can be used for this purpose, in order to avoid the massive use of chemical fertilisers. Finally, energy can be obtained
23
from food waste through anaerobic digestion (which produces also digestate with good fertilising properties) and waste incineration (Ellen MacArthur Foundation et al., 2015). Several advantages can stem from the redesign of the agri-food sector in a circular economy approach. The annual expenditure of food products per family would be reduced by 25% by 2030 and by 40% by 2050, thanks to the decrease in food waste (Ellen MacArthur Foundation et al., 2015). From the environmental point of view, there would be significant reductions in the use of pesticides, chemical fertilizers, energy, soil, water and in the emissions of greenhouse gases. There would be also a job growth due to the increase in the organic farming practices and to waste management systems. In economic terms, the implementation of the circular model would bring an economic benefit of € 320 billion compared to the current system, due to the reduction of costs for primary resources procurement and the decrease in externality costs (Ellen MacArthur Foundation et al., 2015). It is important to highlight that, in the transition to a new agri-food system, the introduction of innovative technologies and systems aimed at reducing waste should be coupled with policy actions to promote the resource efficiency goals, the restoration of natural capital and the production of high-quality products (Ellen MacArthur Foundation et al., 2015). Moreover, the transition to circular economy in the agri-food production chain requires joint efforts of farmers, food companies, retailers and consumers and the use of resource efficient production techniques (e.g. precision agriculture practices, organic agriculture and digitalisation of supply chains) as well as sustainable food choices and a decrease in food waste (European Commission, 2011; Ellen MacArthur Foundation et al., 2015).
24
4 Life Cycle based methods to support the transition towards
circular economy in the agri-food sector
The transition towards sustainable consumption and production systems in the agri-food sector, in a circular economy approach, requires the use of robust and scientific methods and tools which can support sustainability assessment of the overall analysed system for several sustainability indicators, by appropriately evaluating the consequences of all the possible circular options, both from an economic, environmental and social point of view. For the assessment of the circular economy impacts, the application of the Life Cycle Thinking (LCT) approach, which takes into account the whole life cycle, can be an adequate solution with many benefits.
At international level, it is recognized that sustainability assessment must be based on a LCT approach, which aims to identify improvement opportunities for all phases of products life cycles, in terms of reduced environmental impacts and greater resource efficiency, thus avoiding burden shifting from a phase to another of the life cycle, and from an environmental compartment to another (Fantin, 2012). This holistic vision of the production system allows to consider the contribution of each process which fulfils the function for which it was designed. Cooperation along the value chain is essential to reach these goals, for sharing all the information and knowledge required for a complete and detailed study.
Par. 4.1 and 4.2 of this chapter are partially based on the following publications, performed during the PhD:
Chiavetta C., Fantin V., Cascone C., 2017. L’Economia Circolare nel settore
agroalimentare e il Life Cycle Assessement come strumento a supporto: il progetto FOOD CROSSING DISTRICT. ENEA Technical report,
USER-PG64-003, June 2017 (Confidential).
Ferrara M. Fantin V., Righi S., Chiavetta C., Buttol P., Bonoli A., 2017.
Applicazione della Water Footprint sviluppata dal WF Network: il caso del Pomodorino del Piennolo del Vesuvio DOP. In Proceedings of XI Conference of
Italian LCA Network Association, Siena, 22-23 June 2017, ISBN 978-88-8286-352-4.
25
4.1 Life Cycle Assessment
From the environmental point of view, Life Cycle Assessment (LCA) is an internationally accepted and standardised method (ISO 2006 a, b) which is recognized as a strategic and effective tool to evaluate the potential environmental impacts occurring in the whole product's life cycle as well as to identify possible areas for improvement (Fantin et al., 2014). Because of these reasons, LCA method could support the analysis of the impacts and benefits associated to circular solutions, also by a preventive approach, thus contributing to increase the sustainability of current sustainable production and consumption models (Sala et al., 2017). Since the LCA analysis considers the entire agri-food value chain, both the identification of agri-food systems environmental impacts and the consequent improvement solutions aim to increase the resource and energy efficiency of the supply chain while decreasing their environmental burdens (Notarnicola et al., 2017). LCA method is based on the compilation, quantification and evaluation of all inputs and outputs, in terms of materials and energy, waste and emissions, and the associated environmental impacts, throughout the entire life cycle of a product (“from cradle to grave”), thus including the extraction and processing of raw materials, the manufacturing of the product, its transport and distribution, the use, collection, storage and final disposal of the related waste (Figure 2).
26
LCT approach has been adopted by the European Union within the Integrated Product Policy (IPP) (European Commission, 2003) and in Sustainable production and consumption policy (European Commission, 2008) which propose the application of several actions to promote the continuous improvement of products environmental performance throughout their entire life cycle. LCA method and LCT approach are used also in environmental communication. In fact, they are the basis of both ISO 14020 compliant ecological labels, such as the European Ecolabel, and the Environmental Product Declaration (EPD) and Green Public Procurement. LCA can therefore support companies in the identification of opportunities for the improvement of the environmental performance of products, in the selection of key environmental indicators for monitoring their environmental performance, in marketing processes, e.g. to obtain ecological product labels and in the eco-design of product and processes.
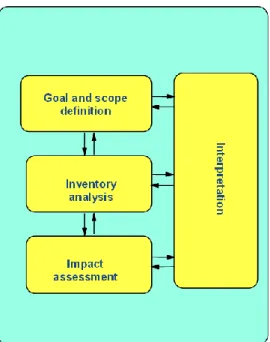
The first examples of LCA method were in the 1960s and 1970s in the USA but the interest in its application grew in the 1990s. In 1993 the Society of Environmental Toxicology and Chemistry (SETAC) defined as LCA as an objective assessment of energy and environmental impacts related to a product, process or activity, carried out by means of the identification of energy and materials consumption and waste released into the environment (SETAC, 1993). The evaluation includes the entire life cycle of the product, process or activity, including the extraction and processing of raw materials, manufacturing, transportation, distribution, use, reuse, recycling and final disposal (SETAC, 1993). In 1998 SETAC created a series of guidelines that were then included in the ISO 14040 standard. According to ISO 14040 standards (ISO, 2006a, b), it consists in the “compilation and evaluation of the inputs, outputs and the potential environmental impacts of a product system throughout its life cycle” (ISO, 2006a) and involves four main phases: the goal and scope definition, the Life Cycle Inventory analysis (LCI), the Life Cycle Impact Assessment (LCIA); and the Interpretation of results (Figure 3).
27
Figure 3. Four main phases of LCA method (Source: Personal elaboration adapted from ISO,
2006a).
LCA method shares with the circular economy the perspective connected to the consideration of the life cycle as a whole. LCA can thus support effectively the implementation of circular economy principles, because it allows to choose the solution with the lowest environmental impacts. More in detail, the application of this method can contribute to verify the hypotheses formulated in the business planning phase, highlighting for example any negative consequences due to a particular configuration. In addition, LCA can help to identify improvement opportunities by the evaluation of the possible alternatives and limits of the current scheme and then it could provide new ideas for the design phase. Finally, it can support the formulation of new objectives at a strategic level, by means of the creation and monitoring of specific performance indicators to encourage continuous environmental improvement (Chiavetta et al., 2017).
Circular economy offers a vision which can influence the way companies and governments operate. The support of a scientific method such as LCA can guarantee that this vision is translated into concrete benefits for people and for the natural capital. Ultimately, LCA provides substantial quantitative measures on which choices at product level are based, thus demonstrating its potential as a complementary tool for the circular economy (Chiavetta et al., 2017).
28
4.2 Water Footprint
Another life-cycle based tool developed in the last years and progressively used in the agri-food sector, also for communication purposes, is Water Footprint (WF), which is an assessment of the water use by products, individuals, companies or the entire population. Water is indeed a natural resource essential to support human life and activities, although the problem of water scarcity is recognized as one of the major environmental issues at world level (Manzardo et al., 2016). According to a recent FAO report (FAO & WWC, 2015), in the next decades agriculture will continue to be the major contributor to water use and water pollution, contributing on average for more than half of water withdrawals from rivers, lakes and aquifers. In fact, the quantity of global water used for irrigation purposes is estimated to increase from 2,600 km3 in 2007 to 2,900 km3 in 2050, with a great increase especially in developing countries (FAO &WWC, 2015). Moreover, the increasing water demands in urban areas and businesses will decrease the volume of water available for agricultural production (FAO &WWC, 2015).
In Europe, one third of the water consumption is utilised in the agricultural sector, which influences both the quantity and quality (i.e. pollution from pesticides and fertilizers) of water available for other applications (EEA, 2012). In the southern European countries, such as Italy, Greece and Spain, about 80% of water used in agriculture is for irrigation purposes, due to the semi-arid climate conditions (EEA, 2012). Italy is one of the European countries that mostly use irrigation (ISTAT, 2014). The volume of irrigation water used in Italy in 2009-2010 was 11,618 milion of m3. Most of the water use takes place in agricultural systems located in North-Western Italy (6,800 m3/ha) and in North-Eastern Italy (2,500 m3/ha), followed by Central and Southern regions (3,500 m3/ha). The problems of water scarcity and pollution occur locally, but the protection and efficient management of water resources must be pursued at national and transnational level, as implemented by the “Blueprint to safeguard Europe's water resources” (COM, 2012/0673). In this context, it is therefore essential to have tools and methods to understand how we are influencing the use of this resource with our production and consumption choices as well as to evaluate the results of companies and governments policies for sustainable water use (Ferrara et al., 2017).
29
In the last years, the WF concept has emerged, which is an assessment of the water use that has created a lively discussion within the scientific community (Pfister et al., 2017), because two methods, both based on a LCT approach, have been developed in parallel:
1) The Water Footprint Network (WFN) (www.waterfootprint.org) developed and published in 2011 the Water Footprint Assessment Manual (Hoekstra et al., 2011), which underlines the necessity to involve consumers and producers in the water management along the production chain;
2) The LCA community has developed methods to include the environmental impacts of water use throughout the product’s life cycle in LCA studies and has contributed to the definition of the underlying concepts of the ISO 14046 standard (ISO, 2016). The product WF developed by the WFN is defined as the volume of freshwater used throughout the production process. This indicator provides a measure of the amount of water available which is used by humans, dividing water into three components: blue, green and grey. The blue component refers to the consumption of water taken from a surface water body or groundwater; the green component expresses the consumption of rainwater that, once have reached the soil, does not flow or recharge the groundwater, but is used in the evapotranspiration process of the soil-plant system; the grey component is the volume of fresh water required to bring the concentration of a given load of pollutants below the maximum values established by legislation (Hoekstra et al., 2011).
The WF according to ISO 14046 is based on the LCA method (ISO 14044) and is defined as a measure that quantifies all the potential environmental impacts related to water used or influenced by a product, process or organization. According to ISO 14046, a WF evaluation means that all the potential impacts related to the use of water are taken into account, otherwise the indicator to which it refers must be specified (e.g. ”water scarcity footprint” or “water eutrophication footprint”). In the framework of the Life Cycle Initiative, the UNEP/SETAC WULCA (Working Group on Water Use in LCA) has dealt with the problem of harmonizing and achieving consensus around an impact assessment method for freshwater consumption. Currently, it has developed the midpoint indicator AWARE (Available WAter REmaining for area in a watershed), which represents the water available per unit of surface which remains in a basin after having satisfied the demand from humans and ecosystems (UNEP / SETAC, 2016). Characterization factors for this method have been developed per year and country, for agricultural and non-agricultural uses. This indicator only evaluates the blue water scarcity and it does not
30
consider rainwater (i.e. green water) (Boulay et al., 2013). Both methods have been applied to the agri-food production chain in the past 10 years (Zhang et al., 2017) and can be useful to support a sustainable management of water resources (Boulay et al., 2013) as well as the development and implementation of green marketing strategies addressed to both companies and consumers (Symeonidou & Vagiona, 2018). Moreover, some recent studies combine the use of WF Network method and ISO 14046 to compare the consistency of the obtained results and to evaluate both their strengths and weaknesses (Manzardo et al., 2016; Bai et al., 2018).
4.3 Application of LCA in the agri-food sector: main methodological
problems
LCA method has been increasingly applied to the agri-food sector for the evaluation of the environmental impacts of a wide variety of agri-food products, contributing to both identify the environmental hotspots of the supply chain and the improvement opportunities, thus supporting political and institutional decisions (Notarnicola et al., 2012). Nevertheless, when applying LCA to food and drink products, the practitioner has to deal with methodological problems which stem from the peculiarities and specific characteristics of the agri-food supply chain. In fact, differently from industrial production systems, these systems have complex relationships, which are difficult to be modelled in LCA studies, between inputs (for example nutrients and soil) and outputs (crops and emissions), between cultivation techniques and the maintenance of long-term soil quality and in general terms between biological and technological processes (Fantin, 2012). However, when LCA is used to communicate the environmental performance of agri-food products, the different scientific approaches used to deal with the methodological issues might lead to different LCA results, making it difficult to compare the environmental performance of products of the same category. The European Commission’ Product Environmental Footprint (PEF) recommendation, developed in 2013 (European Commission, 2013a), and the integrating documents aim to fulfil the need for harmonisation to calculate and communicate environmental footprint of products.
In particular, some critical issues on which different scientific approaches have been applied are the definition of the functional unit, the system boundaries and the allocation procedures, the calculation of on-field emissions from the use of fertilizers and pesticides at inventory level, the comprehensive assessment of toxicity impacts from the use of