Alma Mater Studiorum – Università di Bologna
DOTTORATO DI RICERCA IN
Oncologia e Patologia Sperimentale
Ciclo XXVII°
Settore Concorsuale di afferenza: 06/A2
Settore Scientifico disciplinare: MED/04
Data management and data analysis in the large
European projects GEHA (GEnetics of Healthy
Aging) and NU-AGE (NUtrition and AGEing):
a bioinformatic approach
Presentata da:
Dottor Dario Vianello
Coordinatore Dottorato
Prof. Pier Luigi Lollini
Relatore
Prof. Stefano Salvioli
Correlatore
Prof. Claudio Franceschi
P
Esame finale anno 2015
To all the people who put up with me in this very long journey.
Science may set limits to knowledge, but should not set limits to
imagination.
C O N T E N T S
1 introduction 1
1.1 Systems biology of aging 1 1.2 The NU-AGE Project 2
1.2.1 NU-AGE technical infrastructure 3 1.3 Genetics, a focus on 5
1.3.1 Humans as metaorganisms 5
1.3.2 Mitochondria & Mitochondrial genome 5 1.3.3 Mitochondrial genome 6
1.3.4 mtDNA and aging 7 1.3.5 The GEHA study 7
1.3.6 The interacting mitochondrion 7 2 aim of the study 9
3 materials and methods 11 3.1 Data 11
3.1.1 NU-AGE Data 11 3.1.2 GEHA Data 12 3.1.3 DbSNP Data 13 3.1.4 Eurostat Data 13
3.2 Programming Languages and Libraries 13 3.2.1 Python 14
3.2.2 Python Libraries and Packages 14 3.2.3 IPython Notebook 17
3.2.4 R 19
3.3 Databases and Web Interfaces 19 3.3.1 Text files 19
3.3.2 SQLite 20 3.3.3 PostgreSQL 20 3.3.4 Dbnp 20 3.3.5 LabKey 20
3.4 Programs and algorithms 21 3.4.1 Phred, Phrap and Consed 21 3.4.2 ClustalW2 and Clustal Omega 22 3.4.3 FastQC 22
3.4.4 Swiss-army knifes for genomics data management 23 3.4.5 GATK 23
3.4.6 HaploFind 24 3.4.7 EpiData Entry 24 4 results 25
4.1 NU-AGE - the data challenge 25 4.1.1 The wealth of data 26 4.1.2 Why we must fight errors 28 4.1.3 How to fight errors 28 4.1.4 Striving to document 29 4.2 NU-AGE - Validating the data 29
4.2.1 Data entry interface 29 4.2.2 The need of a new solution 34
4.2.3 NU-AGE Validator - a quick introduction 34 4.2.4 NU-AGE Validator - The implementation 35 4.2.5 NU-AGE Validator - How it works 47
4.2.6 Validating continuous data, without fixed boundaries 48 4.2.7 Crunching everything - document to rule them all 50 4.3 NU-AGE - The @Bologna database 51
4.3.1 Why? 51
4.3.2 Which database? 51
4.3.4 Database description 52 4.4 NU-AGE Systems Biology 52
4.4.1 Where to start the journey from 53 4.5 GEHA and the Epistasis 64
4.5.1 Obtaining the sequences 64 4.5.2 Analyzing them 65
4.5.3 Single SNP association 69
4.5.4 Multiple SNPs association - Epistasis 70 4.6 Ion Torrent Data Analysis, an excursus of 75 5 discussion 81
5.1 The Systems Biology challenges 81 5.2 The NU-AGE study 82
5.2.1 Data management 82 5.2.2 Preliminary data analysis 83 5.3 The GEHA Project 84
5.3.1 Background and methods setup 85 5.3.2 Single variants association 86
5.3.3 Multiple variants association - Epistasis 86 5.4 Next Generation Sequencing data analysis 89 6 conclusions 91
Author’s publications 93 References 95
L I S T O F F I G U R E S
Figure 1 Map of the subjects enrolled by NU-AGE 4 Figure 2 Mitochodrial DNA molecule 6
Figure 3 IPython Notebook folder 18 Figure 4 IPython Notebook screenshot 18 Figure 5 FastQC Screenshot 23
Figure 6 Validator repository size in line of codes in time 36 Figure 7 Example of test PDF report produced by
PDFWrap-per 46
Figure 8 Example of test Excel report produced by ExcelWrap-per 47
Figure 9 Probability density function plot of a parameter suf-fering from systematic errors 49
Figure 10 NU-AGE variables documentation file 50 Figure 11 NU-AGE main page in LabKey platform 52 Figure 12 NU-AGE menu in LabKey platform 53 Figure 13 NU-AGE docs in LabKey platform 54
Figure 14 NU-AGE study navigator in LabKey platform 55 Figure 15 NU-AGE Systems Biology - The ideal enrolled
sub-jects’ situation at T0 56
Figure 16 NU-AGE Systems Biology - The ideal enrolled sub-jects’ situation at T1 56
Figure 17 PCA on Nutrients Data - Fraction of explained vari-ance by each PCA component 58
Figure 18 PCA on Nutrients Data - First component. 59 Figure 19 PCA on Nutrients Data - Second component. 60 Figure 20 PCA on Nutrients Data - Third component. 61 Figure 21 PCA on Nutrients Data - Fourth component. 62 Figure 22 The NU-AGE Cloud. 63
Figure 23 Epistasis analyzed with an entropy-based approach. 67 Figure 24 Trend of 90+ people percentage in the whole
popula-tion 68
Figure 25 Bayes Factor versus Log Odds Ratio - non syn, aa level 70
Figure 26 Bayes Factor versus Log Risk Ratio - non syn, aa level 71
Figure 27 Bayes Factor versus Log Odds Ratio - all, nt level 71 Figure 28 Bayes Factor versus Log Risk Ratio - all, nt level 72 Figure 29 Manhattan plot based on Bayes Factor values - all, nt
level 72
L I S T O F T A B L E S
Table 1 NU-AGE questionnaires and assays schema 12 Table 2 GEHA sequence divided by Country and Status 13 Table 3 NU-AGE questionnaires and assays schema 26 Table 4 NU-AGE Centralized assays 27
Table 5 NU-AGE Validator Rules 40
Table 6 Threshold values for K interpretation 69 Table 7 Epistasis - Possible interaction models 74
Table 8 Results of epistasis analysis on mtDNA AA couples 76 Table 9 Comparison of variants detected by Sanger
sequenc-ing, Ion Torrent variant caller and GATK (against rCRS) 79
ant caller and GATK (against RSRS) 79
1
I N T R O D U C T I O N
I n d e x
1.1 Systems biology of aging 1 1.2 The NU-AGE Project 2
1.2.1 NU-AGE technical infrastructure 3 1.3 Genetics, a focus on 5
1.3.1 Humans as metaorganisms 5
1.3.2 Mitochondria & Mitochondrial genome 5 1.3.3 Mitochondrial genome 6
1.3.4 mtDNA and aging 7 1.3.5 The GEHA study 7
1.3.6 The interacting mitochondrion 7
Data management is the art of collecting, curating and properly storing data. It usually represents the introductory step to data analysis, which is the art of extracting meaningful results out of the high quality datasets obtained in the previous phase. Notwithstanding these two disciplines are commonly perceived as two faces of the same coin, they are in fact devoted to two consecutive but sharply separated tasks.
The work hereby described encompasses both these arts, applied in two different context: data management within the FP7 EU project NU-AGE (Santoro et al. 2014) and data analysis on the mtDNA data produced by the GEHA project (Franceschi et al. 2007a). NU-AGE aim is to assess if a fortified diet, tailored on elderly’s needs, may be involved in modeling the aging process. GEHA, on the contrary, focused on understanding the genetic determinants of longevity.
Both studies require an holistic approach to the data to reach meaningful results: longevity is well known to be a complex phenotype, where many, possibly independent, factors play a role in determining the final outcome. Systems biology represents the corner stone around which all analysis should be planned and developed.
1.1
systems biology of aging
Aging is characterized by a progressive decrease in the fitness of intercon-nected physiological systems at all the levels of physiological organization, from single molecules up to the entire organism. A strong relationship has been highlighted between chronic, low level inflammation and aging, a con-dition named "inflammaging" (Cevenini et al. 2013; Franceschi et al. 2000, 2007b). Inflammatory mediators involved in this condition was proposed as the "common soil" where age-related pathologies may develop and flourish (Blagosklonny et al. 2009; Salvioli et al. 2013). If from one side inflam-maging can be considered a physiological phenomenon, it is also true that it can rapidly become detrimental if the process goes out of control (De Martinis et al. 2006), causing an excess of local and systemic inflammatory response. Tackling inflammaging can thus be considered a priority, repre-senting an effective strategy to reduce the inflammatory status, a striking risk factor for elderly people, slowing down the development of all those harmful processes that have in the inflammatory response their main patho-genesis. Building mechanistic mathematical models describing how biolog-ical systems interact and eventually allow for the establishment of
maging, in response to internal and external stimuli altogether, will help in further dissect the mechanism behavior and possibly help to define effective interventions to counteract the chronic inflammation (Cevenini et al. 2008; Rattan 2014).
The modeling of the NF-κB pathway represents an outstanding example of this working hypothesis, where not only models help in fully understand pathways but also suggest were succeeding experiments should be aimed at (Basak et al. 2012; Tieri et al. 2012). In fact, while the original scope of the work by Basak et al. was to comprehend the roles different IκB isoforms play in the temporal response to inflammatory stimuli, it also propelled two other "side" achievements: first, a careful revision of the literature available on the topic, done to implement the model itself, and second, thanks to computational sensitivity analyses, the discovery that different degradation rates of free and bound pools of IκB are part of a cross-regulation mecha-nisms contributing to the robustness of the system response (O’Dea et al. 2007). Finally, it was also suggested that NF-κB response may also be influ-enced by intracellular available metabolic information, an hypothesis which is now under study (Tornatore et al. 2012).
Besides inflammaging, aging also causes the loss of the so-called metabolic flexibility (DiPietro 2010), the capacity of cells and tissues to adapt them-selves from lipid oxidation in fasting conditions to the increase of glucose uptake, oxidation and storage after a meal or in insulin-stimulated condi-tions (Galgani et al. 2008). Micronutrients imbalance, as well as overnutri-tion, may affect metabolic flexibility in several ways: glucose excess causes the production of ROS that in turn increases oxidative stress (Nunn et al. 2009; Ponugoti et al. 2012); Moreover, overnutrition impacts in the capacity adipose tissue has to cope with lipids in excess, eventually causing lipids ac-cumulation and lipotoxicity, and may cause cells to fail shifting towards glu-cose oxidation due to impaired translocation of GLUT4. Metabolic flexibility is also involved in system-wide metabolism dysregulation, for example in type-2 diabetes (T2d) (Corpeleijn et al. 2009).
Immunity and metabolism are deeply intertwined partners. Overnutri-tion, disrupting energy storage and utilizaOvernutri-tion, propels local inflammation and impairs metabolic function (Hotamisligil et al. 2008), whereas macronu-trients deficiencies are suggested to hamper the immune response, some-what removing the fuel needed to sustain it in terms of energy and sub-strate needed for proper immune defense. A precise, quantitative, mod-eling of these complex interactions may thus foster the development of a diet providing the proper nutritional income to avoid igniting any of these pathological and pre-pathological states (Calçada et al. 2014; Cevenini et al. 2010).
1.2
the nu-age project
NU-AGE, “New dietary strategies addressing the specific needs of elderly popula-tion for an healthy aging in Europe", (Berendsen et al. 2014; Santoro et al. 2014) is a FP7 European project that aims to fill the gap caused by the lack of an integrated approach in the field of nutrition as a mean to contrast, or at least slow down, inflammaging (Biagi et al. 2012; Claesson et al. 2012; Franceschi 2007; Jeffery et al. 2013; Ribari ˇc 2012).
Eurostat (http://epp.eurostat.ac.europa.eu) predictions forecast that the proportion of 65+ people will severely increase in the EU27 (the 27 Mem-ber States of the European Union) from 17% to 30% by 2060. A similar in-creasing trend is also predicted for 80+ people, with a 3-fold increase from 21.8 million in 2008 to 61.5 million by 2060. This dramatic rise has direct and important implications in terms of the health costs countries will be called to sustain while the proportion of elderly people progressively increases in the population. Any strategy able to slow down, reduce or, even better,
1.2 the nu-age project 3
postpone the onset of aging-related diseases, thus improving the health of elderly European citizens, would be warmly welcomed. A good measure of how EU considers this issue critical can be provided by the fact that the whole EU Horizon 2020 program for research and innovation funding is de-voted to increasing of two healthy years the life expectancy of EU citizens, based on interventions on physical activity and diet.
NU-AGE builds on the outcomes of previous studies focused on ana-lyzing single nutrients intakes (Bouwens et al. 2009; Guo et al. 2009) and pushes on to embrace the concept of "whole diet" as a mean of targeting the metabolism in its entirety and investigate the sophisticated interconnections that may exists among different nutrients and their impact on metabolism and, ultimately, to health status.
The project enrolled in total 1250 sex-balanced free living elderly people, ranging from 65 to 79 years, free of major overt diseases, in 5 European countries (Italy, United Kingdom, Netherlands, Poland and France). A map showing the geographical location of each subject is visible in Figure 1 on the following page. The trial is a 1-year randomized, single blind, controlled trial with two parallel arms (control vs "diet"). Subjects, after initial char-acterization, were randomly assigned to each arm in equal number. Five standardized questionnaires were then administered both before and after the trial, encompassing the following domains: dietary habits, life-style and physical activity, health and medication and other relevant data such as the functional cognitive status. Blood, urine and faecal samples were collected before and after the trial to allow for:
• the analysis of immune, inflammation, metabolic, genetic and epige-netic status;
• measures of the intake of sodium, nitrogen, creatinine and potassium;
• definition of microbiota composition.
Furthermore, NU-AGE will take advantage of "omics" analyses such as transcriptomics, metagenomics and HITChip arrays to investigate to the deepest possible level the cellular and molecular mechanisms underpinning the dietary effect and to identify specific nutritional targets in the elderly.
1.2.1 NU-AGE technical infrastructure
NU-AGE will collect (and in part already has) a massive amount of data that requires particular care to be efficiently exploited. My role within this project was to help building the technical infrastructure to support the col-lection process, from designing the data entry interface to validating the data and building the database and the needed documentation. Indeed, a nicely set data management plan represents the best achievement a research project can obtain to ensure long life to its data.
There are 4 tightly interconnected steps to be considered when talking about data management: data entry and transmission, data validation, data documentation and data storage. Failing to attain even one of them may pose the whole project at risk of failing its objectives in the long term. Each step, however, requires dedicated resources, i.e. databases and graphical interfaces, which all together can be, and should be, considered as a result of the project itself, given the amount of time that must be devoted to these tasks.
These challenges become more difficult to tackle as a function of the num-ber of involved recruiting centers. NU-AGE, with its 5 recruitment centers with different backgrounds, was thus in a critical position. Controlling this risk required a lot of preliminary work to harmonize how information was collected and the development of ad-hoc solutions to detect and address inconsistencies in the shortest possible time, to reduce their propagation within the data.
Figure 1:Map of the subjects enrolled by NU-AGE. Point width represents the number of subjects enrolled in each geographical location, data aggregated at municipality level. Map recon-structed with Google Maps API (https://developers.google.com/maps/) and Basemap (http: //matplotlib.org/basemap/).
1.3 genetics, a focus on 5
There is a last issue that, common in most of the data management steps, becomes predominant in the last one: data security. There is an innate di-chotomy here: security in first place means that information must be stored in protected repositories: data are the final result of the millions of eu-ros spent to obtain them. Second, but first from an ethical point of view, data must be secured to protect subjects privacy, which is the cornerstone around which clinical research is based upon. Missing to comply with this golden rule should represent enough evidence to sustain that involved par-ties weren’t able to cope with the challenges they were facing, even before being considered a matter to be discussed by attorneys in a court. NU-AGE took data security seriously and promoted all the technical and non-technical precautions to prevent data disclosure, a briefly sum of which you will see in later chapters.
Unfortunately, it is still too soon to draw conclusions from NU-AGE data. At the time of writing, a significant part of the data that will constitute the future database is still in the data entry phase. In spite of this, you will be able to get from this dissertation at least a feeling of the challenges that analyzing the data produced by the project will pose, some of which we are already discussing and, whenever possible, solving.
1.3
genetics, a focus on
While NU-AGE main goal is to understand how the diet will impact on subjects as a whole, the project is also laying strong foundations for less "diet-centric" genetics analyses. All subjects will be genotyped with an Il-lumina OmniExpress chip containing 750K probes, eventually building a remarkable database describing the european genetic variability, on which scientific hypotheses may be tested.
1.3.1 Humans as metaorganisms
However, limiting the analysis to a panel of mainly nuclear SNPs such as those comprised in OmniExpress chips may not be enough. In recent years, researchers started to think longevity as the result of three separate genet-ics, reflecting three separate genomes: the nuclear genome (nDNA), the mitochondrial genome (mtDNA) and the gut microbiome (GM), the last composed by the whole set of bacteria living inside our gut with their own set of genes (Garagnani et al. 2014). From this point of view, human be-ings should be consider not as a single organism, but as a ”metaorganism" in which three different microbial ecosystems act together in response of each other and of external stimuli. Moving from the same premises, the result of the aging process itself should be considerd as the final outcome of a complex interaction of biological and nonbiological factors, the latter further subdivided in environmental and stochastic factors. In developing this thesis we focused our efforts in investigating one of three genomes: the mitochondrial DNA.
1.3.2 Mitochondria & Mitochondrial genome
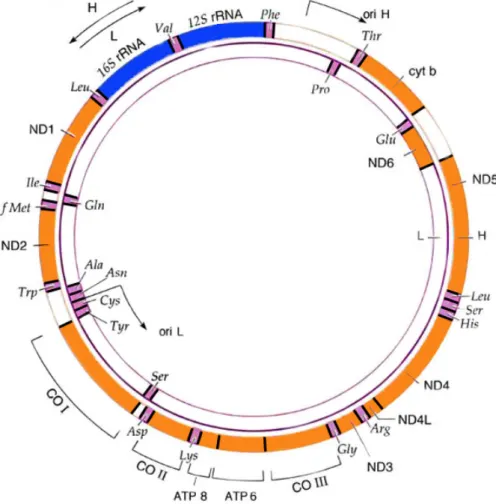
In the cell, mitochondria oversee several key functions: they produce energy in form of ATP by mean of oxidative phosporilation (OXPHOS), they are involved in most metabolic pathways and in the apoptotic process, of which they represent the first step through the release of cytochrome-c. Diseases such as Alzheimer, diabetes and most degenerative diseases, along with AIDS progression (Hendrickson et al. 2008) seem linked to this organelle. Finally, ROS production and mtDNA mutagenesis are the two solid links connecting mitochondria to the aging process (Lagouge et al. 2013), albeit
Figure 2:Mitochondrial DNA molecule.
recent studies suggested that increase of ROS production merely represents a consequence of the age-dependent accumulation of mtDNA damage, and not a cause of aging itself (Kennedy et al. 2013; Shokolenko et al. 2014; Trifunovic et al. 2004).
1.3.3 Mitochondrial genome
The mitochondrial genome is constituted by a single, circular, chromosome of 16569 base pairs, present in a variable number of copies in each mitochon-drion. At the time of writing, there’s a huge debate in the scientific commu-nity regarding the reference to be used in mtDNA studies (Bandelt et al. 2014), counterposing advocates of rCRS (Anderson et al. 1981; Andrews et al. 1999), the formerly undisputed reference, to researchers supporting the adoption of RSRS, a chimera sequence ideally placed at the very top of the mtDNA phylogenetic tree, as the new standard (Behar et al. 2012). In this thesis, whenever possible, we choose RSRS as our reference sequence, since we believe it represents a more "neutral" reference point, being it an ances-tral rather than a "phylogenetically peripheral" and modern mitogenome from Europe, a definition that instead perfectly fits rCRS.
Out of the ~1500 genes originally coded by the mtDNA, only 37 are still present: 12S /16S rRNAs, 22 tRNAs required in mitochondrial protein syn-thesis and 13 polypeptides belonging to the OXPHOS system (Wallace 2005). The remaining genes progressively moved to the nucleus, probably to reduce the risk of their degeneration caused by the Muller’s ratchet (Wal-lace 2007). However, this continuos flow of copies of mitochondrial genes, some of which are not under selective pressure in the nucleus, is the root cause of the most debated problem in sequencing and assembling mitochon-drial genomes: numts (Nuclear Mitochonmitochon-drial DNA sequences). Numts are sequences in the nucleus that show a very high similarity to mitochondrial
1.3 genetics, a focus on 7
sequences and represent a very good explanation for all the misidentifi-cations suffered by several studies focused on mitochondrial diseases and phylogeny reconstruction, and should be thus treated with particular care (Cannino et al. 2007; Hazkani-Covo et al. 2010; M. Li et al. 2012; Picardi et al. 2012).
1.3.4 mtDNA and aging
The progressive accumulation of mutations in the mtDNA causes an im-pairment of the energy production, which is in turn contrasted by the cell increasing the number of mitochondria. At the same time, studies suggest that mutated molecules do have a replicative advantage on wildtypes (Rear-don 2002). This phenomena, in combination with the progressive turnover of older mitochondria, provokes an enrichment of mutated forms due to the genetic drift. Sooner or later, the fraction of damaged mtDNA will reach a breaking point where the decrease in energy production causes an increase in ROS production that drives the cell toward the activation of the apoptotic process. At the tissue level, this prolonged cell loss will eventually disrupt functionalities, igniting pathological states (Wallace 2005). Neurodegen-erative diseases, such as Alzheimer, Parkinson and Huntington syndrome (Santoro et al. 2010; Yang et al. 2008), as well as sarcopenia (Kujoth et al. 2006), AIDS progression (Hendrickson et al. 2008) and aging (Salvioli et al. 2008) were all linked to mitochondrial inefficiencies caused by mtDNA damage. Recent association studies focused on age-related diseases identi-fied nuclear loci involved in mitochondrial bioenergetics (PPARγ, PGC-1α and UCPs), strengthening the evidences of a role of mitochondria in these pathological states (Capri et al. 2013; J. J. Jia et al. 2010; Raule et al. 2014; Wallace 2005, 2013).
1.3.5 The GEHA study
In recent years, results coming from the GEHA study (Franceschi et al. 2007a; Skytthe et al. 2011) emphasized the role recurrent and sporadic mtDNA mutations may have in longevity. The project sequenced the con-trol region of 3000 samples and the complete mtDNA of 1292 samples (646 ultranonagenarians, 646 controls) from subject enrolled in Denmark, Fin-land, Southern Italy and Greece (Raule et al. 2014). An initial haplogroup-based analysis detected an association between haplogroups H2 and T2 with longevity in females, while J2 resulted associated only with males, con-tradicting previous results (Domínguez-Garrido et al. 2009; Niemi et al. 2003). However, none of these associations reached the significance level after proper multiple testing correction was applied. To investigate if rare variants participate in determining longevity, a Rare-Variant association test-ing for sequenctest-ing data (Wu et al. 2011) was performed. Obtained results proved that the number of non synonymous mutations in mtDNA genes coding for subunits composing OXPHOS complexes I, III and V significantly differs between 90+ and controls. Going into details, mutations in complex I may be beneficial for longevity, while the cooccurrence of mutations on both complex I and III or on both I and V might be detrimental for lon-gevity. The really interesting finding of GEHA, until now, is this very last results: mutations do interact to determine the phenotype (long-lived or not).
1.3.6 The interacting mitochondrion
As stated above, more than the 90% of the components needed by mitochon-dria to work are nuclear-encoded. Thus, there’s a tight interplay between the two genomes, nDNA and mtDNA, to preserve biological function and
cell activities (Bar-Yaacov et al. 2012; Kenyon et al. 1997; Rand et al. 2004). This "communication" is bidirectional, with information travelling from the mitochondrion to the nucleus, and from the nucleus back to the mitochon-drion. The "channels" through which this communication can take place are multiple: protein-protein interaction, protein-RNA interaction in the mi-tochondrial ribosome and nuclear factors-mtDNA recognition sites interac-tions in the transcription and replication processes (Bar-Yaacov et al. 2012; Lung et al. 2006; Rackham et al. 2011). It is well established in literature that keeping these interactions stable and balanced is fundamental for the cellular homeostatis and even small alterations lead to stress and acceler-ated aging. However, little is known on how this communication channels are regulated.
The investigation of epistatic effects such as the ones described above represented a nearly-impossible challenge (Tranah 2011) until the advent of NGS techniques and the increase of available computing power. NGS provoked a steep fall in the cost of obtaining a sequence, both in terms of money and working time, at the same time skyrocketing the volume of data to leverage in the analyses. However, as the amount of informa-tion to process increases, it also mandatory to develop hardware and meth-ods able to cope with this tremendous amount of data to be processed in reasonable time. High performance computing (HPC) is now able to reach a computing power that was not even imaginable some years ago. In partic-ular, GPU (Graphics Processing Unit) computing is progressively revolution-izing the field, delivering groundbreaking performances when small but massively parallel calculations are needed. Indeed, this is the kind of com-putations required to perform epistasis analysis (Goudey et al. 2013; Pütz et al. 2013). An important drawback GPU computing has is the complexity of programming algorithms on these platforms, which requires dedicated – and complex – programming languages that are difficult to master without a pure computer science background. Additionally, dedicated and somewhat expensive hardware is needed, since using off-the-shelf cards may deliver performances way below those achieved with consumer-targeted CPUs.
It’s from these foundations that we moved to build our approach to in-vestigate epistasis. As you may have understood by now, GEHA possess all the data needed to perform this kind of investigation, which may provide useful insights on the mtDNA role in the longevity mechanism. Methods to analyze these interaction already exist (Cordell 2002; Emily 2012; Moore 2015; Moore et al. 2014; Ritchie 2015), but we preferred to develop a new method based on bayesian statistics that, in our opinion, was better suited to detect these subtle relations, helped in the job by carefully crafted priors, obtained by analyzing available sequences databases. Still, conducting these analyses is really complex: even analyzing a handful of mutations requires to evaluate all the possible interactions among them. Limiting the analysis to couples, the problem increases quadratically, n2, where n represents the number of mutations under analysis. For this reason, we initially tested our method to detect single variants associations in GEHA mtDNA sequences.
We then analyzed all the non synonymous variants at AA level, removing those position where more than two different AA were found. This expe-dient allowed us to avoid having the computational problem exploding in our hands, while retaining a good exploration of the possible epistatic in-teractions. While results of this pilot study will be explained in details in the following chapters, we would like to stress since now that this method, once further optimized in terms of computing time, will be ready to be used to investigate epistasis in the full set of mtDNA variability discovered in GEHA, as well as to be exploited to explore the very same phenomena including nuclear variants, finally shedding a bit of light on the nuclear-mtDNA crosstalk.
2
A I M O F T H E S T U D Y
Aging and longevity, as well as inflammaging, are complex phenomena re-quiring high quality data and cutting-edge analyses to be even partially understood. At the same time, there is a growing necessity to tackle these problems, given by the fact that they do have a severe impact on people’s health and, to be blunt, on the costs each country must sustain to maintain its own population healthy. The aim of this study is to build on previous knowledge to at least start unraveling the complex net tightly interconnect-ing these three phenomena, providinterconnect-ing both the components needed to solve the equation: data and analysis methods.
Data will be provided in the context of the NU-AGE study, which aims to understand the role diet has in regulating the inflammatory status. In partic-ular, we will design and implement the project data management pipeline. To be successful, this effort requires to combine several independent but tightly interconnected parts covering the whole life of the data, spanning from the very first moment of their creation, the data entry process, to their long term storage in properly configured and secured databases. Fulfill-ing these requirements, however, is far from beFulfill-ing easy: as we will see, it requires to mix together completely different backgrounds, ranging from software programming, to medicine and data documentation, down to web applications deployment and monitoring. We will also discuss some of the preliminary data the project has produced, with a particular focus on the nutrient intakes.
NU-AGE will collect a plethora of data encompassing several different fields, that will have to be combined together to provide a reliable and definitive answer to the scientific questions the project is based upon. As for all intervention studies, a critical part is represented by the evaluation of the subjects compliance. In our case, this compliance is extremely diffi-cult to measure: we’re not administering a new drug, we’re administering a diet that each subject may decline in his or her own way, eventually di-verging from the expected behavior. Moreover, controls may change their behavior while enrolled in project in response to external stimuli, adopting a healthier diet on their own. It is thus fundamental to precisely measure how each subject was compliant to its branch, to weight its data accordingly. To address this key need, in this study we will propose a way of obtaining a reliable index to measure compliance in diet-based intervention studies.
New analysis methods, on the contrary, will be provided in the form of new approaches to detect and measure the epistatic interaction in mito-chondrial DNA, an unanimously recognized player in the longevity arena. These methods, based on entropy analysis and Bayesian statistics, will be first tested on the GEHA mtDNA sequences to verify if they will be able to detect the association of single variants to the longevity phenotype, and then used on the very same sequences to understand the effects that interacting mutations may have in influencing the aging process, if any. Additionally, we will begin to pave the way to the analysis of the crosstalk that occurs between the mitochondrial and nuclear DNA, which was already hypothe-sized in literature but is yet to be proven. Eventually, we will also see how the obtained results, if meaningful, may be used to provide a direct feedback on the probability of a subject of becoming long-lived or not.
As a side topic, we will cover the realization of a pipeline to analyze NGS data coming from a Ion Torrent PGMTM platform, stimulated by the poor performances achieved by stock softwares provided by the manufacturer in calling variants harbored by the mitochondrial DNA, which is well known
to represent one of the most tough molecule to be sequenced and analyzed due to its innate peculiarities, such as the widespread presence of poly-n stretches.
3
M A T E R I A L S A N D M E T H O D S
I n d e x 3.1 Data 11 3.1.1 NU-AGE Data 11 3.1.2 GEHA Data 12 3.1.3 DbSNP Data 13 3.1.4 Eurostat Data 133.2 Programming Languages and Libraries 13 3.2.1 Python 14
3.2.2 Python Libraries and Packages 14 3.2.3 IPython Notebook 17
3.2.4 R 19
3.3 Databases and Web Interfaces 19 3.3.1 Text files 19
3.3.2 SQLite 20 3.3.3 PostgreSQL 20 3.3.4 Dbnp 20 3.3.5 LabKey 20
3.4 Programs and algorithms 21 3.4.1 Phred, Phrap and Consed 21 3.4.2 ClustalW2 and Clustal Omega 22 3.4.3 FastQC 22
3.4.4 Swiss-army knifes for genomics data management 23 3.4.5 GATK 23
3.4.6 HaploFind 24 3.4.7 EpiData Entry 24
Different data, languages, systems and programs were used in this PhD thesis, depending on the specific task to be accomplished.
Different programming languages may be differently suited to deal with certain type of data, and the same holds for the numerous Relational Database Management System (RDBMS) now in the wild. Usually, the final choice is driven by the attempt to reduce the overhead on the analyses due to the chosen infrastructure, being it a language or a database.
The aim of this chapters is to list and detail all the technologies and infor-mation used throughout this study.
3.1
data
As its title says, this thesis is pretty much a deep voyage in data management and analysis. In is thus important to note that the work described in the following chapters draws fully from years of efforts taken by several people in mainly two different European-funded project: GEHA (Franceschi et al. 2007a) and NU-AGE (Berendsen et al. 2014; Santoro et al. 2014).
3.1.1 NU-AGE Data
NU-AGE (Berendsen et al. 2014; Santoro et al. 2014) is a FP7 European project with the main task of understanding if the Mediterranean diet can influence, and to which extent, elderly’s health. The project recruited 1250 subjects in the age range 65-79, half of which followed a diet specifically tailored on the elderly’s needs for 1 year.
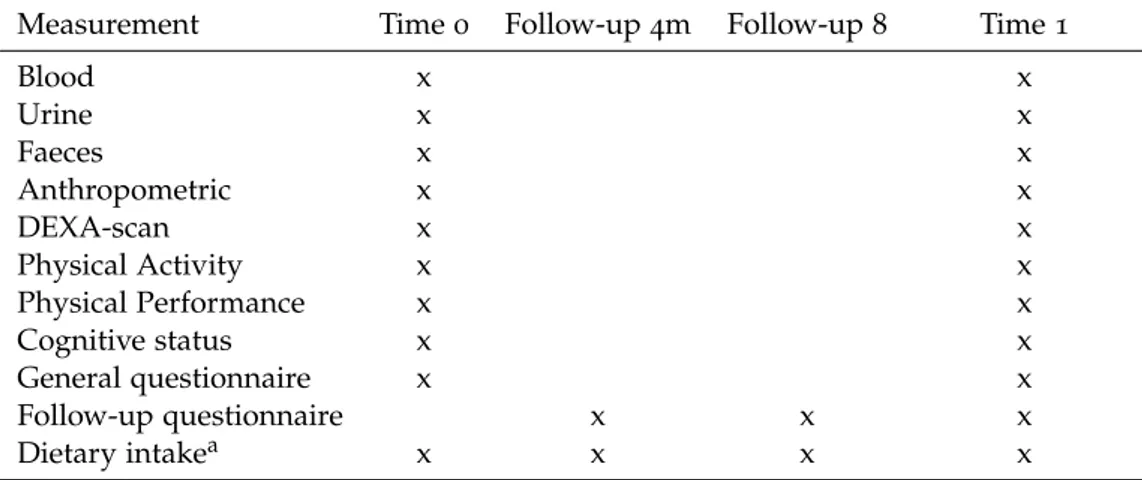
Table 1:NU-AGE questionnaires and assays schema
Measurement Time 0 Follow-up 4m Follow-up 8 Time 1
Blood x x Urine x x Faeces x x Anthropometric x x DEXA-scan x x Physical Activity x x Physical Performance x x Cognitive status x x General questionnaire x x Follow-up questionnaire x x x Dietary intakea x x x x
aDietary intake at month 4 and 8 is assessed only in participants in the diet group.
Understanding the effect that diet may have on the people’s health is a topic that clearly falls in the list of problems you must address with a System Biology approach: hundreds of parameters may play a small but significant role in this phenotype, and not considering even a small fraction of them may be detrimental for the study outcome. Moving from this premises, NU-AGE adopted the most comprehensive panel of questionnaires and assays that was technically feasible, a schema of which can be seen in Table 1.
As the reader may imagine, the amount of information produced with this setup is overwhelming: we’re talking about roughly 2000 variables, and that is just a small part of the whole database, since storing results of the planned "omics" analyses, such as
• genomics
• lipidomics
• metabolomics
• transcriptomics
• microbiome analysis via deep sequencing
will be the really groudbreaking challenge here.
Details on how we solved the data management problems will follow in the succeeding chapters.
3.1.2 GEHA Data
GEHA (Franceschi et al. 2007a) aim was to identify candidate genes in-volved in healthy aging and longevity. The consortium, composed by 24 Eu-ropean partners and the Beijing Genomics Institute from China, recruited in 5years 2650 long-lived 90+ sibpairs and 2650 younger, ethnically matched, controls from 11 European countries, of which DNA and healthy status was obtained.
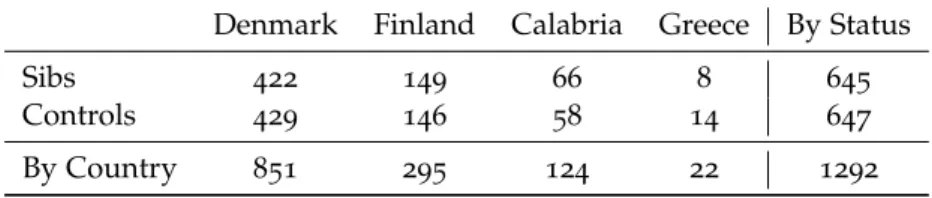
While further details about the study setup can be found in the cited article, for the sake of this thesis it is important to note that UNIBO was responsible for the mtDNA sequencing of the enrolled subjects, which was only in part carried out in our lab, with the biggest batch of samples sent to the BGI for sequencing. In total, GEHA obtained the complete mitochon-drial DNA sequence for 1292 subjects, subdivided as reported in Table 2 on the facing page, and ~2500 D-loop sequences equally subdivided in sibs and controls.
Additionally, a subset of the samples were genotyped with an Illumina Human OmniExpress chip containing ~730K probes. This batch originally
3.2 programming languages and libraries 13
Table 2:GEHA sequence divided by Country and Status
Denmark Finland Calabria Greece By Status
Sibs 422 149 66 8 645
Controls 429 146 58 14 647
By Country 851 295 124 22 1292
comprised 370 subjects from Bologna, of which we now have information about their nuclear variants.
Finally, in 2014 the phenotypical database (Skytthe et al. 2011) was trans-ferred to a secure server hosted in the UNIBO IT infrastructure. The data-base contains the questionnaire information gathered from sibs and controls, with ~200 and ~100 variables respectively.
3.1.3 DbSNP Data
Microarray results are as good as their annotation is sound and updated. GEHA microarray data dated back to 2011, and the mapping of the variants could have been changed significantly in this time interval. Thus, before proceeding with further analyses it was mandatory to update the original annotations. However, getting fresh data for 700K+ variants is not some-thing you can do by hand. DbSNP (Sherry et al. 2001) offers a "Batch sub-mission" system that accepts up to 30.000 rs codes per request and sends back the updated records after a time that varies between a couple of min-utes to 24 hours. In our case, using this approach would have meant to chop our list of variants in 25 batches, submit them separately and then glue the results back together. Luckily, Ensembl released in 2014 a brand new REST API (Yates et al. 2014) that allows to query their variants databases (that are mainly a mirror of DbSNP content) for updated information. We thus built a small script based on Python Request library (see 3.2.2) to automate this task, and retrieved the needed information in a couple of hours.
3.1.4 Eurostat Data
Dealing with data flowing in from different European countries poses sev-eral difficult to answer questions when you merge the information together: country is, obviously, a confounding factor you must consider when ana-lyzing the data. But how strong this factor is for longevity? To answer to this question we used Eurostat public data to estimate the proportion of 90+ subjects in the population of countries participating in the GEHA project.
3.2
programming languages and libraries
Programming languages are the language you can talk to be understood by a computer. There are many of them, developed in different times and to address different problems, but they are usually divided in two main categories: compiled and interpreted. The first approach is well known for its speed, which is usually order of magnitude faster compared to the second, while the latter allows for greater flexibility and platform independence (i.e. Java).
Compiled languages are much faster because the source code is first "com-piled" in machine language and then interpreted by dedicated hardware or software at time of execution. This distinction does not exist in interpreted languages, in which both processes are done on the fly. However, this speed gap can be partially filled by just-in-time compilation: the code is compiled
by the interpreted just before execution, with a gain in speed that can even-tually be considerable, depending on the program itself (Kluger 2008).
3.2.1 Python
The great part of the work described in this thesis was done in Python (Python Website), a language implemented by Guido van Rossum. Python is an interpreted, object-oriented language, which is thus interpreted on-the-fly by the Python Interpreter, usually referred to as CPython. A project, codenamed PyPy (pypy Website), is now developing a new implementation of the Python language that contains a Just-In-Time compiler, allowing pro-grams to run faster and with a lower memory footprint.
Python gained a considerable momentum in many fields, primarily be-cause of its easiness of use and low learning curve. It has an innate predilec-tion for strings (thus sequences) processing, making it a top choice adopted by bioinformaticians all around the world, but also allows to solve most tasks exploiting dedicated libraries: numerical calculus (Van Der Walt et al. 2011), data exploration and analysis (McKinney 2010; Pérez et al. 2007), advanced plotting (Hunter 2007), web development (Django Website) and biological data management (Cock et al. 2009).
3.2.2 Python Libraries and Packages
For most of the question you pose to it, Python has a library to answer with. That’s particularly true in the biology/bioinformatics world, thanks to the growing adoption Python has in these fields. Hereby follows a list of all the libraries used in this thesis, with a short description for each of them.
BioPython
BioPython (Cock et al. 2009) does all the heavy lifting of reading (a.k.a. parsing) biological formats such as FASTA, ClustalW or GenBank (Benson et al. 2013) and interacting with NCBI’s Entrez databases to download var-ious type of information, i.e. article abstracts, sequences or GEO datasets (Barrett et al. 2013).
In the context of this thesis, BioPython was used to pre-process GEHA mtDNA sequences, both at the quality-check step and before starting epis-tasis analyses.
SciPy
SciPy (SciPy Website) can be seen in two different ways:
• a package grouping together mathematical algorithms and conven-ience functions based on NumPy (Van Der Walt et al. 2011);
• an ecosystem of open-source Python packages devoted to science, math-ematics and engineering.
Most of the packages that follow in this list are indeed part of the SciPy ecosystem, which is every bit as good as the acclaimed R ecosystem.
Pandas
Pandas (McKinney 2010) is a python package that provides two fundamen-tal parts of the data processing equation:
• proper data structures, to load, filter and slice the data. The most no-table structure is the DataFrame, that closely resembles a R dataframe;
• highly efficient but basic tools for exploratory analysis, i.e. average, percentiles, grouping and so on.
3.2 programming languages and libraries 15
These two parts, merged together, allow for a quick exploration of new datasets, and provide a solid base for more advanced analyses. Pandas is build upon numpy (Van Der Walt et al. 2011), a Python library for scientific computing.
Mathplotlib
Matplotlib (Hunter 2007) , a 2D plotting library, aims to, as stated in the project website
”make easy things easy and hard things possible”
and usually fulfill this duty in a very elegant way. The library literally puts the most common plots (i.e. histograms) at the programmer fingertips, and more complex plots, such as hexbins, just a couple of lines of codes away.
All the scientific plotting contained in this thesis was powered by mat-plotlib, helped by libraries such as seaborn (Waskom et al. 2014) or basemap (Basemap Website), to improve plots appearance and for map projections, respectively.
Scrapy
If you need to extract – or scrape, to use the correct computer science term, information from a website automatically, Scrapy (scrapy Website) is the way to go. Python-based, Scrapy is an application framework to crawl web sites and extract structured data to be later processed for other task, i.e. for data mining.
The framework allows to build specialized crawlers that, starting from a set of url base addresses, dive deep in each website, following the links you instruct them to, selecting only the pieces of information you need and ex-porting them in an easy to use comma or tab delimited format. It also keeps track of already visited urls to avoid being stuck in a loophole and can auto-matically adjust the crawling speed to accommodate both the needs of the website you’re crawling and the computer you’re running the crawlers on. If more sophisticate processing and storage is needed, Scrapy can perform post-processing of the information, in form of pipelines, and directly store data into databases.
For the scope of this thesis, Scrapy was used to retrieve the Anatomical Therapeutic Chemical (ATC) nomenclature to validate the ATC codes entered by NU-AGE recruitment teams in the data entry process.
Requests
Request is, following the author’s claim,
"HTTP for Humans"
In other words, it’s a Python library to perform HTTP requests, the same type of request any browser, i.e. Firefox or Chrome, does every time you access a web page.
What’s the reason behind it in science, you may ask. We’re not visiting web pages, after all! The reason is that Ensembl (Cunningham et al. 2014) recently released its own REST APIs (Yates et al. 2014) (where API means Application Programming Interface and REST Representational State Transfer), eventually overcoming the long standing problem of the lack of supported APIs for any programming language, with the exception of Perl. REST APIs are instead language-agnostic, and can be interrogated via any program-ming language via HTTP request.
To do a "real life" parallel, you can think about REST APIs as a librarian you ask for a book (a dbSNP rs code, Sherry et al. 2001). If your request is semantically correct (you’re asking the right thing at the right address), he will reply with the book (data encoded in some format, i.e. JSON), or gently ask you to rephrase your question (something was wrong in your request). If you ask too many books together, he will gently tell you to come back later (too many requests together will be blocked).
A more bioinformatics-related example may be the following: you need to get updated information about a SNP of which you have only the rs code. You have many ways to do this, but the two main choices are:
• going to the dbSNP website, write the code in the search box, wait for the result, read throughout the record to find the information you need, and use it;
• ask to Ensembl the data via the REST APIs, have a program digest the reply and extract only the information you need, and then use it. If you need annotations for just a couple of rs codes, both processes are doable. On the contrary, if you need to update thousands of them there is really no choice: a programmatic way is the only approach you can follow.
To implement such a script you can use Python Request library to con-nect to the Ensembl Variation Endpoint, at the URL address "http://rest. ensembl.org/vep/human/id", and perform a POST request. POST request are request that asks the server to accept the payload in the message body, in this case a JSON-encoded list of rs codes, to be processed. The server will thus process the list of codes and send you back the requested information, encoded in JSON. You can then decode the data and extract the bits you need. All these steps can be successfully done in 2 lines of Python code:
1 r e q u e s t = r e q u e s t s . p o s t ( e n d p o in t , h e a d e r s ={" Content - T y p e ":"
,→ a p p l i c a t i o n / j s o n "} , d a t a = j s o n . d u m p s ({’ ids ’ : r s _ l i s t
,→ }) )
2 v a r i a t i o n s = r e q u e s t . j s o n ()
where line 1 asks for the data (rs codes are contained in the rs_list variable) and line 2 parses back the JSON contained in the reply to native Python data structures.
In this thesis Request was used to obtain gene annotations of a set of vari-ants contained in a OmniExpress Illumina chip containing ~730K probes.
Plumbum
Python has many built-in and external libraries to interact with external commands and redirect their output, but what makes Plumbum (Plumbum Website) outshine its competitors is the easiness of use.
Need to launch a complex-and-very-long command? Just shove all the arguments in the right order inside a list, and you’re ready to go. You need to launch the same command many times with different arguments? Save the root command separately and combine it on-the-fly with the arguments you need each time.
Finally, in a very long pipeline, such as the pipeline we built for NGS variants calling, it is fundamental to have an exact control on what’s going on, and this comes down to two things: logging, to have a clear trace of what happened, and exit code management, to halt the pipeline as soon as an error occurs, without losing time and resources processing dirty data. Well, Plumbum make this straight easy.
SQLAlchemy - The Database Toolkit for Python
SQLAlchemy (SQLAlchemy Website) is a Python library to connect to most DBMS, making easy to load and query data independently from the under-lining infrastructure. It consists of two main components: the Core and the
3.2 programming languages and libraries 17
Object Relation Mapper. The Core is a fully featured abstraction toolkit, which swiftly removes the problem to connect to different database implementa-tions and allows to map and query Python Objects to database types. At the same time the Object Relation Mapper, or ORM, allows to associate user-defined Python Classes to database tables and instances of these classes to rows in the corresponding tables, taking care of continuously syncing them. In this way, the programmer can store and retrieve data from the DMBS without performing additional conversion steps or leaving the comfortable Python language.
To give you an explicit example of how the ORM allows for such a level of customization, here is how we defined an object to store information about each recruiting center:
1 c l a s s R e c C e n t r e ( B a se ) : 2 """ 3 T a b l e to s t o r e i n f o on R e c r u i t i n g C e n t r e s 4 5 """ 6 _ _ t a b l e n a m e _ _ = ’ r e c r u i t i n g _ c e n t r e s ’ 7 8 id = C o l u m n ( Integer , p r i m a r y _ k e y = True , a u t o i n c r e m e n t = ,→ T r u e ) 9 cid = C o l u m n ( Integer , n u l l a b l e = F a l s e ) # C e n t e r ID 10 n a m e = C o l u m n ( String , n u l l a b l e = F a l s e ) 11 a d d r e s s = C o l u m n ( String , n u l l a b l e = F a l s e ) 12 c o u n t r y = C o l u m n ( String , n u l l a b l e = F a l s e )
This object is transformed in a SQLite (see 3.3.2 on page 20) table and instances automatically pushed to the database.
SQLAlchemy was adopted in this thesis to interact with the SQLite data-base at the basis of our validation pipeline.
3.2.3 IPython Notebook
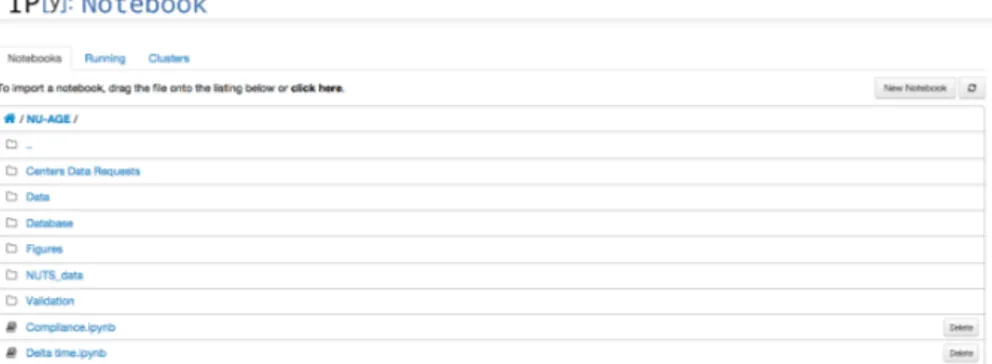
IPython Notebook (Pérez et al. 2007) can be easily seen as your data best friend: it allows to combine code execution, documentation, text and image visualization in a single, easily shareable, page. Notebooks files are text files you can move around on your computer, send to colleagues to double-check your analyses, or make freely available on the web, with just a couple of clicks.
The IPython Notebook Folder of NU-AGE, grouping together all the note-books used in this thesis, can be seen in Figure 3 on the following page. Notebooks are denoted by the ".ipynb" extension, while other rows refer to nested folders, containing both raw data or other notebooks. On the top, you can see buttons to access the running notebooks, or enable IPython cluster computing. You can also easily create a new notebook with the dedicated button.
An example of a running IPython Notebook can be seen in Figure 4 on the next page. Here you can appreciate IPython uttermost feature: an in-teractive experience nailing together code development and execution with image visualization and prompt access to libraries documentation. In the Figure you can appreciate at the top the code used to plot the violinplot shown just beneath it and also have a glimpse of how easy is to get help if, for example, you forget how to invoke a command: just write the command and append a "?" mark at the end, as shown in the last line, and IPython will fetch and display the help for you in no time!
All the plotting, and most of the data post processing, in this thesis was accomplished via IPython Notebooks, each time combining one or more of the previously described libraries.
Figure 3:IPython Notebook Folder - Screenshot of a IPython Notebook folder. Files with extension .ipynb are IPython Notebook, while other entries are fold-ers containing either Notebooks or data.
Figure 4:IPython Notebook screenshot. On the top we have the code used to pro-duce the central figure. The last line shows how easy is to obtain com-mands documentation: append a "?" mark at the end, and IPython will get it for you, displaying it a dedicated box.
3.3 databases and web interfaces 19
3.2.4 R
R (R Foundation for Statistical Computing, Vienna 2008) probably rep-resents the most acclaimed open source programming language for data exploration and statistics. A great part of its reputation derives from the im-pressive number of packages available to "easily" analyze the most disparate data, developed and maintained by scientists, or companies, all around the world. Accessing these packages is usually straightforward: many, if not all, of them are stored in the Comprehensive R Archive Network (CRAN, CRAN Website) and can be downloaded and installed with a single command. On the contrary, in biology and bioinformatics the reference archive is Biocon-ductor (BioconBiocon-ductor Website), which containing hundreds of packages de-voted to the analysis of high throughput data.
R was initially adopted in this thesis for the pre-processing and analysis of raw data coming from the Ion Torrent platform. However, used to the way higher flexibility of Python, we abandoned R after some initial test and moved the analysis to the IPython platform.
3.3
databases and web interfaces
Properly and efficiently store data is the first step to easy processing and advanced (and useful!) analyses.
There is no catch-all answer to which system should be adopted: the fi-nal decision must carefully weights the kind of data you’re storing and the overhead you can sustain to provide a higher performance storage back-end. Sometimes, a complex Database Management System coupled with an advanced web interface represents the way to go, in other cases a text file is more then enough to cope with the problem.
3.3.1 Text files
The reader may be disappointed to find text files within a section entitled "Databases and Web Interfaces". When talking about databases, the imagi-nation immediately skyrockets to extremely complex systems with terabytes of data ready to be queried with a single click. Sorry to say, this may hold strong in Google’s world, but biology, with some notable exception (i.e. high throughput raw data, image processing, and so on), usually flies at a much lower altitude. We’re not dealing with "big data" here.
That’s the reason why a text file can be enough to store whole databases and share subsets of them. The VCF Format (VCF Format Specification website), the mainstream format to store variants identified via Next Gen-eration Sequencing (NGS), is a text file format. You can compress it to save space, but it remains a (very well designed) text-based format. When several people need to access the same resource at the same time, or the curator fre-quently updates the data, that’s the case in which something more advanced is needed, and databases kick in.
There is also an innate benefit in text files: they are just - as the name says - plain old easy text files: even in a very distant future, a reader for this format will exist, probably the grandson of the notepad installed by default in all your computers. So, a scientist needing your data in 10 years from now will have no problem in reading them. If the same data are locked in a proprietary abandoned file format, that information would be lost. Think about it! Always use the easiest and most standardized format you can afford for your data.
This quite long introduction to say that most of the data used in this thesis were, at some point of the chain, contained in text files. NU-AGE pipeline for data management includes steps in which data are sent in text files: it’s indeed the main format we used to send data from recruiting centers and
labs to the central database. GEHA sequences were in FASTA format, that’s again a text-based format, while genotypes were stored in PLINK (Purcell et al. 2007) MAP and PED formats, and, imagine what? Text-based formats again!
3.3.2 SQLite
SQLite, citing the official website is
a software library that implements a self-contained, serverless, zero-configuration, transactional SQL database engine
In a nutshell, SQLite provides you with a fully functional relational data-base within a single file. Advantages are striking: you can have your data stored in a database supporting many SQL queries without the overhead of running a DBMS on a dedicated server and losing time configuring countless configuration files. This comes with the price of no concurrent access -only a single person or process can access the file at once - and limited sup-port to some SQL constructs. In conclusion, SQLite can be seen as a good compromise between text files and more complex DBMS.
For the scope of this thesis, SQLite was used to implement a small data-base to store information about NU-AGE to empower tracking and manage-ment of data failing the validation checks. You can easily convince yourself how this was the ideal situation to adopt SQLite: no need for concurrent access - a single process writes and reads the data - and for complex SQL constructs (i.e. certain kind of joins SQLite doesn’t support).
3.3.3 PostgreSQL
PostgreSQL (PostgreSQL Website) (a.k.a. Postgres) is an Open Source DMBS with more than 15 years of active development. It supports most of the SQL:2011 standard, is ACID-compliant and allows for complex SQL queries with indexing methods not available in other implementations. It also has a particular focus on scalability, with latest version supporting database replication to reliably share the workload on multiple servers.
In this thesis, Postgres was used as database for LabKey (see 3.3.5), a data integration platform we deployed to address NU-AGE data management needs.
3.3.4 Dbnp
The "Nutritional Phenotype database" (Dbnp) (Van Ommen et al. 2010) is an open source effort to produce an application suite to store biological studies. Although, as the name suggests, it was designed to store nutrition-related data, it’s module-based architecture allows for a very high degree of flexibility, allowing it to deal with other types of information such as phenotypical and omics data.
An instance of this application was (and is) used for long term storage of NU-AGE’s data, hosted at the TNO, The Netherlands, a NU-AGE partner.
3.3.5 LabKey
LabKey (Nelson et al. 2011) represents one of the best examples of plat-forms for data sharing and scientists’ collaboration. Implemented in Java, Labkey runs on multiple platforms (Windows, OS X and Linux), and re-quires:
3.4 programs and algorithms 21
• PostgreSQL (see 3.3.3 on the preceding page) as database backend;
A wiki page at the developers’ website guides throughout the installa-tion process that, unless particular configurainstalla-tions are needed (e.g. security requirements), doesn’t require advanced computer science skills. Its devel-oper team offers highly professional paid support, but the excellent user community forum gives a great way of troubleshoot common and uncom-mon problems for free.
After initial configuration, LabKey provides an easy and flexible system where to upload, store, analyze and plot biological data. Studies can be organized in nested folders, each one with specific modules enabled and customized permissions. Case/control studies are particularly well sup-ported by LabKey, which provides specific functions to manage data pro-duced within this type of projects.
Moreover, additional modules are available to improve the analysis and searchability of assays such as:
• Genotype data;
• Luminex data;
• Mass spectrometry data;
• Flow cytometry;
Finally, LabKey can also forward jobs to a Galaxy Server (Blankenberg et al. 2010; Giardine et al. 2005; Goecks et al. 2010), transforming it in a highly efficient genomics analysis platform.
In this thesis, LabKey was deployed on a server provided by the Univer-sity of Bologna’s IT Department to aid NU-AGE data validation process and act as a temporary storage for the data that, once finalized, will be transferred to the dbnp (see 3.3.4 on the facing page).
3.4
programs and algorithms
Implement something from scratch when somebody else already did the job is useless (and somewhat silly), and this concept holds both for pro-gramming languages libraries and for whole softwares. The development of this thesis took advantage from many freely available algorithms to ad-dress some of the tasks, and hereby follows a list of them.
3.4.1 Phred, Phrap and Consed
Building a consensus sequence out of tens of chromatograms coming out of a Sanger sequencer can be a tough work, even when the target is a small molecule such as the mtDNA. Many different suites exist to reduce the bur-den of this work, implemented by sequencers manufacturers or indepenbur-dent developers. Our lab adopted for this task SeqscapeTM(Applied Biosystems Inc. part of Life Technologies, Carlsbad, CA), but it lacks support for some chromatograms formats used in the GEHA project. This forced us to move to a different pipeline, based on Phred, Phrap (Ewing et al. 1998a,b) and Consed (Gordon et al. 1998).
The process is rather straightforward:
1. Phred loads and analyzes the raw files coming from the sequencer, calls the bases and computes a quality value for each of them, as a logarithmic function of the error probability.
2. Phrap reads Phred outputs and assembles the contigs using the mito-chondrial DNA reference sequence (Anderson et al. 1981; Andrews et al. 1999) as a scaffold.
3. problematic sequences can then be further manually refined with Con-sed, a graphical user interface (GUI) to view Phrap output, if needed.
Phrap strong point is represented by the calculation of additional qual-ity indexes that, supported by those produced by Phred, allows it to use a higher fraction of each read, as long as the quality is high enough to be aligned to the other reads. This helps increasing the throughput of the pro-cess, in turn lowering the need of human intervention: there’s no more need for an experienced operator to recover erroneously discarded fragments to link otherwise separated contigs, an common issue with other softwares where reads are trimmed aggressively. If needed, Consed GUI can help in finalizing particularly tricky sequences.
In this thesis, this suite was used to reconstruct GEHA sequences starting from raw data produced by the Beijing Genomics Institute (BGI), China.
3.4.2 ClustalW2 and Clustal Omega
A direct way to evaluate the quality of a consensus sequence, apart of the quality values produced by the assemblers, it’s comparing it to the reference sequence: the identification of many mismatches, far more than expected, is usually a very bright indication that something went wrong, possibly at the sequencing or assembling step.
However, to compare two sequences we must align them first. Aligning together many samples, usually against the reference sequence, in a single alignment would help the operator in assessing the quality of each of them in a single shot, dramatically reducing the time needed to check the whole batch. This kind of alignment is called Multiple Sequence Alignment (MSA), and, just to avoid overlapping, there are a very long list of softwares to do so, each one with its own advantages. After careful testing in terms of time and alignment accuracy, we eventually found that ClustalW2 (Larkin et al. 2007), albeit a little slower than Muscle (Edgar 2004), produced more consistent results. When ClustalW2 was officially no longer maintained, we switched to Clustal Omega (Sievers et al. 2011), an excellent implementa-tion of the next generaimplementa-tion of multiple sequence alignment algorithms.
ClustalW2 and Clustal Omega were used within this thesis to evaluate the quality of the GEHA mtDNA sequences produced in Bologna and at the BGI.
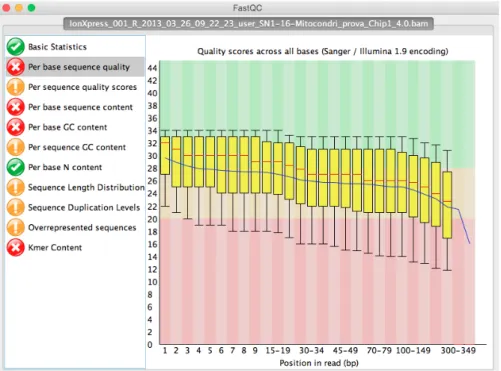
3.4.3 FastQC
The difficulty of evaluating the quality of sequences obtained via Sanger sequencing simply fades away when compared to the complexity of quality control in Next Generation Sequencing (NGS), when thousands – or hundreds thousands – small reads are at play. Luckily, with the progressive, in some way explosive, adoption of these technologies tools were designed to help researcher and technicians in evaluating the quality of this flood of data.
A very good example of this is FastQC (FastQC Website), which provides an integrated – and easy – way to perform basic quality control checks on the raw data coming out from the NGS sequencer. The user has just to load the file (usually a BAM file) and the program will compute common key statistics and display them in a friendly interface. An example of a (bad) run can be seen in Figure 5 on the next page, with quality values dropping low just few bases after the reads start.
FastQC was used to evaluate the quality of the data produced by an Ion Torrent platform while optimizing a protocol for complete mtDNA sequenc-ing.
3.4 programs and algorithms 23
Figure 5:FastQC screenshot. On the left we have the list of available statistics, with semaphore-based colors depending on the statistics results themselves. On the right a clearly bad run, with mean quality scores dropping below opti-mal values (green shadow) early in the reads.
3.4.4 Swiss-army knifes for genomics data management
Samtools (H. Li et al. 2009b), bedtools (Quinlan et al. 2010) and Picard (Pi-card Website) are toolkits to manage, view and analyze high-throughput se-quencing data. Combining them you get a fully-featured Swiss-army knife that can sort out many – if not all – the problems you may encounter in selecting, merging, splitting, indexing and viewing data in SAM and BAM, the most adopted formats for raw NGS data.
Detailing all the task they can perform will result in a 10 pages and count-ing long list. Eventually, only Picard was used in this thesis, but all of them were thoroughly tested.You will get a complete view of where we used Pi-card in the next chapter but, for the moment, just know that we used them in our quest of improving the variants called by an Ion Torrent platform.
3.4.5 GATK
Getting the data out of the sequencer and view them is the first step in a long pipeline. What you’re really looking for when sequencing are the variants each subject harbors in his or her genome. Technically speaking, you must call the variants in that genome. Given the very high number of reads NGS sequencers produce, the amount of information you must consider to call a single variant may turn out to be enormous. You clearly need advanced algorithms to condense all this information in a single nucleotide call.
The Genome Analysis ToolKit (GATK) (DePristo et al. 2011; McKenna et al. 2010) disentangles this problem combining complex statistical modeling with efficient implementations of the algorithms to increase the sensitivity and specificity of the calls, while also keeping low the CPU and memory footprint of the system. To help first-time users, the GATK development team published and constantly updates Best Practices for different use cases, with comprehensive examples on how to execute and master each command the pipeline is composed of(Van der Auwera et al. 2013).
GATK HaplotypeCaller was used in this thesis to perform variant calling on samples sequenced with the Ion Torrent Platform.
3.4.6 HaploFind
HaploFind (Vianello et al. 2013) is a web application developed at our lab to perform high-throughput SNP discovery and haplogroup assignment of complete mitochondrial DNA sequences. Implemented in the context of my master thesis, the web application is now gaining a small but significant momentum among researchers, with a constantly growing user base.
The application allows to load a set of mtDNAs in FASTA format that are then automatically aligned against the mitochondrial reference sequence (RSRS, Behar et al. 2012) to detect variants. Once the mutational signature of each samples is defined, HaploFind compares it to the Human mtDNA Phylogenetic tree (PhyloTree, van Oven et al. 2009) to find the best match between detected mutations and known variability. Results are then sent back to the browser and displayed in a Javascript-based web interface for navigation, refinement and exporting.
The whole process is usually very fast, with a lower bound of 0.09 second-s/sequence for the snp discovery and haplogroup assignment step, which increases to ~0.9 seconds due to the overheads caused by data insertion/re-trieval in the database and job queue management.
HaploFind carried out the SNP discovery and mtDNA haplogroup assign-ment on GEHA sequences.
3.4.7 EpiData Entry
Epidata Entry (EpiData Entry Website) is, citing the developers’ website, a software for
simple or programmed data entry and data documentation.
It allows to build complex yet easy to use interfaces for the data entry in the context of scientific projects and beyond. Validation of the data can be coded exploiting a dedicated programming language, that allows for the creation of advanced checks with relatively small efforts. It also has built-in function for data export and backup.
In this thesis we adopted EpiData Entry to build the data entry interface for the NU-AGE project.