Measurement and estimation of
seismic
attenuation
for
near-surface site characterization
DEPARTMENT OF CIVIL, CONSTRUCTIONAL AND ENVIRONMENTAL
ENGINEERING (DICEA)
Ph.D. course in Environmental and Hydraulic Engineering
PhD Candidate:
Ing. Francesco Saverio Desideri
Tutor:
Prof. Michele Cercato Coordinator
Summary
CHAPTER 1. INTRODUCTION ... 9
1.1 Problem outline and motivation ... 9
1.2 Objectives ... 11
1.3 Technical approach ... 11
1.4 Original aspects ... 11
1.5 Organization of the thesis ... 12
CHAPTER 2. PLANE WAVES PROPAGATION IN VERTICALLY INHOMOGENEOUS MEDIA 14 2.1 Seismic waves ... 14
2.1.1 Wave equations for an elastic medium ... 14
2.1.2 Potential functions ... 15
2.1.3 Types of body waves ... 16
2.1.4 Phase and group velocities ... 20
2.1.5 Surface waves ... 20
2.2 Attenuation theory ... 23
2.2.1 The quality factor Q ... 23
2.2.2 Attenuation in body waves ... 27
2.2.3 Attenuation in surface waves ... 29
CHAPTER 3. ATTENUATION MEASUREMENTS OF BODY AND SURFACE WAVES 32 3.1 Body waves methods ... 32
3.1.1 Review of methods ... 32
3.1.2 Time domain methods ... 33
3.1.3 Frequency domain methods... 36
3.2 Surface waves methods ... 38
3.2.1 Experimental dispersion curves ... 39
3.2.2 Review of methods for estimation of attenuation curves ... 40
3.2.3 Phase shift method ... 40
3.2.4 Spatial decay measurement of surface waves ... 44
3.3 Theoretical dispersion and attenuation curves by Direct Stiffness Matrix method 45 3.3.1 Halfspace stiffness matrix ... 46
3.3.3 Assembly global stiffness matrix ... 48
3.3.4 Trascendental eigenvalue problem ... 49
CHAPTER 4. APPLICATION OF DOWNHOLE MEASUREMENTS OF BODY WAVES IN SEISMIC ATTENUATION ESTIMATES AND SURFACE WAVES APPLICATIONERRORE.IL SEGNALIBRO NON È DEFINITO. 4.1 Site locations ... 57
4.2 Instrumentation and geometry ... 61
4.2.1 Instruments utilized ... 62
4.2.2 Survey layout ... 65
4.2.3 Select of pairs ... 66
4.3 Data processing ... 67
4.3.1 Choice of traces and vertical stacking ... 69
4.3.2 First break picking and travel times ... 70
4.3.3 Frequency content ... 71
4.3.4 Muting ... 74
4.3.5 Windowing ... 76
4.4 Data results ... 76
4.4.1 Spectral ratio results ... 76
4.4.2 Rise-time results ... 81
4.5 Experimental dispersion curves ... 85
4.5.1 Instrumentation and survey layout ... 86
4.5.2 Data processing ... 87
4.5.3 Extract dispersion and attenuation curves... 90
4.6 Experimental attenuation curves ... 95
4.6.1 Spectral analysis of surface waves ... 95
4.7 Comparison of theoretical and experimental dispersion and attenuation curves 97 CHAPTER 5. CONCLUSIONS ... 100
List of figures
Figure 2-1: Particle motion associated with compressional waves ... 17
Figure 2-2: Particle motion associated with shear waves ... 17
Figure 2-3: Particle motion associated with Rayleigh waves ... 21
Figure 2-4: Particle motion associated with Love waves ... 21
Figure 2-5: Displacement amplitude of Rayleigh waves versus dimensionless depth (Richart et al., 1970). ... 22
Figure 2-6: Distribution of compressional, shear and Rayleigh waves generated by a point load in a homogeneous, isotropic, elastic half-space (Woods, 1968). ... 22
Figure 2.7: Schematic illustration of several proposed aitenuation mechanisms for saturated and partially saturated rocks (Johnston, 1979) ... 27
Figure 3.1: Broadening and attenuation of two adjacent pulses as they travel along a fiber. ... 34
Figure 3.2: Rise-time 𝝉 of a pulse is in lectirature: a) from Gladwin and Stacey, 1974; b) from Kurtuluş and Sertҫelik, 2010; c) Wu and Lees, 1996; d) Zucca et al., 1996. ... 34
Figure 3.3: Example of a rise-time measurement of a single P-wave trace at 41 meter depths in Rieti site. ... 35
Figure 3.4: Slope estimation on reduced spectral ratio. The frequency band considered is 20-65 Hz for S-waves (Rieti site). ... 37
Figure 3.5: 24-channel shot gather obtained in the test site of Velino River in June 2018. ... 39
Figure 3.6: Fast fourier transform of 4 traces in the 24-channel record ... 43
Figure 3.7: Experimental dispersion curves obtained by using phase shift method (2-meters offset). ... 44
Figure 3.8: Total attenuation curve (in red), the two curves in grey is referred to two different pairs geometry. ... 45
Figure 3.103: examples of sparsity patterns of the matrices Am, Bm and Cm for a 100 Hz frequency ... 53
Figure 4.1: Map of borehole site location; a) large scale location; b) location of test site 1, in Rieti (Campomoro); c) location of test site 2, in INGV headquarter ... 59
Figure 4.2: Test site 1; Path of the seismic rays (Ray-tracing). b) Velocity trend with depth. ... 60
Figure 4.3: Test site 2; a) Path of the seismic rays (Ray-tracing). b) Velocity trend with depth. ... 61
Figure 4.4: Pictures of the Test site 1: a) Generation of P waves by vertically vibration shot on metal plate. b) Impact source for SH wave generation. c) and d) positioning of both the sources. ... 63
Figure 4.12: Example of comparing SH waves polarization, by means of the specular pulses we can find the first break (red markers). ... 71
Figure 4.13: Example of check of the low frequency content (data from Rieti site, MASW surveys). a) Raw data, b) data with low pass filter 60 Hz (OK), c) data with low pass
filter 20 Hz (partial OK), d) data with low pass filter 10 Hz (the signal in not dominant anymore and the wavefield is dominated by noise). ... 72
Figure 4.14: Example of Spectrogram (P and S waves) in the choice of frequency band. ... 73 Figure 4.15: Example of the choice of frequency band by means of FFT spectrum analysis (S-waves, Rieti site). ... 73
Figure 4.16: Example of muting applied to the seismic dataset. a) test site 1; b) test site 2. ... 75
Figure 4.17: Example of trace windowing with a Blackman-tapered time window function. ... 76
Figure 4.18: Amplitude spectra of the downgoing wavefield, we can notice the descrising in amplitude, increasing depth of investigation. ... 77
Figure 4.19: Spectral ratio between various recording pairs. ... 78 Figure 4.21: Test site 1; a) Interval Q estimation and Damping factor versus depth for P waves. b) Interval Q estimation and Damping factor versus depth for SH waves; Test site 2; c) Interval Q estimation and Damping factor versus depth for P waves. d) Interval Q estimation and Damping factor versus depth for SH waves ... 80
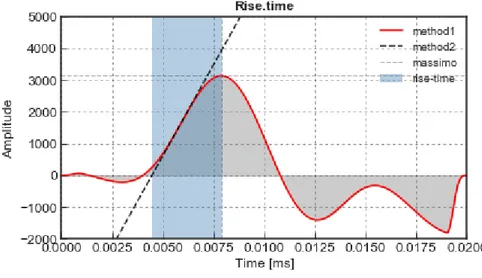
Figure 4.22: Qp/Qs and Ds/Dp ratios for the 2 test sites ... 81 Figure 4.23: 20 ms - isolated traces for rise-time estimation for the 2 test sites. ... 82 Figure 4.24: Example of rise-time estimates. In red the maximum slope of the first quarter-cycle of the seismic signal. ... 82
Figure 4.25: Experimental rise-time as function of travel times. ... 83 Figure 4.26: Interval 𝑸𝑷 and 𝑸𝑺 for Rieti site using rise-time method and comparison between the two methods used. a) Test site 1; b) Test site 2. The dashed lines indicates the layer boundaries. ... 85
List of tables
Table 2-1: Typical values of 𝑽𝑷 and 𝑽𝑺 ... 19
Table 2-2: Some examples of 𝑸 for longitudinal or bending excitation of various solids (Knopoff,1964), sorted by magnitude. ... 26
Table 3-1: Review methods to estimate seismic attenuation through borehole surveys ... 33
Table 3-2: Review methods to estimate seismic attenuation through borehole surveys ... 40
Table 4-1: Parameters for field data site location and drilling description ... 58
Table 4-2: Acquisition and design parameters used in the site of Rieti. ... 65
Chapter 1.
Introduction
1.1 Problem outline and motivation
Seismic attenuation is a fundamental parameter on the comprehension of the viscoelastic real behavior of the medium. Characterization of the ability of materials to transmit and dissipate seismic waves is even important for petrophysical descriptions of reservoir rocks.
From a physical point of view, seismic attenuation is due to three different phenomena:
intrinsic attenuation, that exists as a results of the energy loss due to internal friction and associated to the dissipative behaviour of the medium;
attenuation for scattering, that is the attenuation of the propagating waves in the inhomogeneous earth caused by diffraction, reflection and dissipation; geometrical spreading, that is the energy density decrease over the wavefront
of increasing size.
Compared with seismic velocities and densities, absorption and scattering are often more sensitive to clay content, pore fluids, gas, or fracturing (Klimentos, 1995).
The most common measuring parameter of seismic wave attenuation is the dimensionless quality factor 𝑄 and its inverse (damping or dissipation factor) 𝑄−1. The quality factor as a function of depth is of fundamental interest in groundwater, engineering, and environmental studies, as well as in hydrocarbon exploration and earthquake seismology (Morozov, 2015). The desire to understand the attenuation properties of the earth is based on the observation that the seismic wave amplitude reduces as the wave propagates. The classical approach to attenuation estimation is henceto measure the absolute spatial decay rate of wave amplitude in the time domain. The interpretation of the results is usually difficult and it lacks a standard procedure for attenuation measurements because many not well-understood problems such as source mechanism, wave scattering, and geometrical spreading of the wavefront, are involved in the phenomenon (Teng, 1968),. These problems have kept Q away from testing in professional practice, despite being a fundamental parameter to take into account for seismic characterization.
The reduction of the amplitude due to attenuation is generally frequency-dependent and, more importantly, attenuation can provide information about lithology, physical state, and degree of rock saturation (Toksoz and Johnston, 1981), so it can be used, besides or along the seismic velocity, to characterize the material of a geological structure using seismogram analysis.
Conventionally, energy dissipation properties are described by 𝑄-factor of the materials. However, 𝑄 can assume different meaning in different contexts. We need indeed to distinguish three different uses of 𝑄-factor: (1) the 𝑄−1as a measure of “internal friction” used in petrophysical interpretation, (2) many measured (“apparent”) 𝑄𝑆 arising from
observations, and (3) the “axiomatic,” mathematical Q used in viscoelastic theory and numerical modeling (Morozov, 2018).
The measured or effective 𝑄 is a combination of intrinsic attenuation, scattering and geometrical spreading, and it is generally referred to as apparent attenuation (Barton, 2007). In practical seismic data processing and inversion, the exact value of the 𝑄 values are sometimes unimportant. The attenuation modeling is generally used to correct the data for attenuation effects; to this end, an absolute 𝑄 is not strictly necessary. By contrast, in seismic modelling, it is important to ensure that the algorithms adequately represent the physical mechanisms of wave attenuation, adopting an accurate 𝑄 profile for the soil model, related to petrophysical properties and internal friction.
To fully understand seismic wave propagation in the earth, the quality factors are parameters that must be known. For example, high frequency Rayleigh waves possesses information of the shear (S)-wave velocity (VS) and the quality factors of near-surface materials.
Seismic modeling for seismic prospecting generally employs elastic wave simulations and most local site response studies take a standard damping factor of 0.05% for the entire soil column. An accurate knowledge of the quality factor (i.e. damping) profile can improve the quality of the results, like in local seismic response studies.
Attenuation can be estimated both from surface or borehole data. Most of the borehole studies conducted for attenuation measures are calibrated for large depths, with large receiver spacing and array length. Some others are calibrated on earthquake measures. The idea of producing attenuation measures from downhole investigations started with the downhole measurements conducted for the 2016 Microzonation campaign. Downhole tests represent the most used borehole surveys to provide an accurate velocity profile and if the measurements are carried out with appropriate equipment and the required precautions, attenuation can be reliably estimated even in the near-surface range.
In spite of the broad variety of methods available for 𝑄 estimation, only a few techniques, such as the rise-time method or the spectral ratio method, are widely accepted for borehole studies.
1.2 Objectives
The knowledge of 𝑄 is very desirable for improving seismic resolution (Wang, 2008), facilitating AVO amplitude analysis, better understanding the lithology of subsurface and providing useful information about the porosity and fluid or gas saturation of reservoir. Anelastic attenuation can be regarded as a disturbance of seismic waves that must be eliminated by inverse 𝑄-filters. Utilizing quality factors only as a disturbance to remove may be an underestimation error. Knowledge of large dissipation in the near surface layers is important for shallow seismic surveys and local observations of earthquakes because near-surface unconsolidated sedimentary layers or weathering materials may influence seismic records (Jongmans, 1990). The anelastic properties of earth materials have attracted the interest of many scientists in recent years, although great efforts have been made to determine it.
The purpose of this work is to investigate the reliability of the rise-time and the spectral ratio methods for 𝑄 estimation in a seismic downhole campaign, to obtain accurate 𝑄 profiles. The obtained parameters have been also compared through a study of surface waves dispersion and attenuation curves, adopting in-situ attenuation profiles for the forward modelling.
1.3 Technical approach
In this study, we applied two different methods to estimate attenuation. We used a standard spectral ratio technique to obtain the frequency independent𝑄 and then compared the results to 𝑄obtained in the time domain from rise-time measurements. These methods are unaffected by far-field geometric spreading. A review of the methods using borehole and surface waves studies is given in Chapter 3.
Additionally, we estimate dispersion and attenuation curves using parameters model using results coming from borehole study. A comparison between experimental and theoretical curves can give us an idea about the reliability of the approach.
P, SH-wave velocity and 𝑄 measurements were conducted in this study using an 8-receivers (10 Hz) 3 Channels seismic string in two sites, one located in Rieti and the other in the headquarter of INGV in Rome. In the Rieti site, it has been operated a MASW surveys with 24 vertical geophones (4.5 Hz) in order to obtain surface wave dataset.
1.4 Original aspects
Most of the borehole attenuation studies presented in literature are carried out for hydrocarbon exploration. The main contribution of the present work is to apply the two most used attenuation estimation methods to near-surface data. They include two
techniques to determine the material damping ratio of the soil based on the downhole (DHT) test, and other two for attenuation and dispersion curves from MASW testing.
For the downhole test have been adopted the spectral ratio and the rise-time methods, the last one has never been used in near-surface studies. Our purpose is to provide reliable measures of attenuation even from this method, comparing with the spectral ratio one. The processing used for the test can be adopted as a standard procedure for future studies in this sector, since there is not a standard procedure for this purposes yet.
Another original aspect of this work is the implementation of a new modelling algorithm, based on the direct stiffness matrix method, improved by the insertion of a detailed attenuation profile.
1.5 Organization of the thesis
Chapter 1: introduces the problem outline and motivation, including the importance of the seismic attenuation. A synthetic list of existing methods is given and further needs and objectives are explained. The approach and original contributions from the thesis are described.
Chapter 2: outlines the seismic waves propagation relations on viscoelastic media. The theoretical background of body and surface waves is presented. Attenuation theory is introduced for both body and surface waves.
Chapter 3: the chapter focus on the body and surface waves methods used for seismic attenuation measurements in terms of experimental and theoretical measurements. The first two section are accompanied by reviews of the most used methods for both body and surface waves datasets. The second explain the improved direct stiffness matrix method that has used to obtain theoretical dispersion and attenuation curves in order to compare the two set of data.
Chapter 4: study in deep the DHT test to determine the material damping ratio of near-surface layered soil. The spectral ratio method as well as the rise-time method are elaborated based on the Rieti and INGV dataset examples. The methods are compared each another to check the material damping values obtained. Deals with the phase shift method and the spatial decay to determine the experimental dispersion and attenuation curves of shallow soil layers for the Rieti surface waves dataset.
Chapter 5: summarizes the conclusions from the present research and gives recommendations for future work.
Chapter 2.
Plane waves propagation in vertically
inhomogeneous media
This chapter describes the theory of seismic wave propagation in linear elastic and in linear viscoelastic solids, several types of waves propagate within the earth and along its surface due to a mechanical disturbance. The waves that are generated can be divided into two main categories; body waves and surface waves (Aki & Richards, 1980). We will first give the basic notions on the theory of wave propagation and then focus on the characteristics and parameters that describe body and surface waves propagation.
2.1 Seismic waves
Many studies have been carried out in order to understand the characteristics of seismic attenuation through the quality factor 𝑄. These studies are based on the use of P waves (𝑄𝛼), S waves (𝑄𝛽).
To describe seismic attenuation, it is therefore necessary to go through a brief explanation on the propagation and composition of the seismic wave field.
When an earthquake occurs, the energy released is partly dissipated in the form of heat, developed due to the friction deriving from the sliding of the rock masses along the fault surface. The remaining energy is partially spent as work, resulting in the displacement of the masses involved, and partly propagates in the ground in the form of seismic waves. These consist of elastic waves that propagate in the ground and on the free surface with velocity, frequency and amplitude dependent on the elastic properties of the medium and the source. The energy carried by the seismic waves translates into stresses and deformations of the ground and therefore in displacements (seismic shaking). In relation to the type of stress and deformation to which the soil is subjected as well as to the way in which the waves are propagated, body waves (P and S waves) and surface waves (Love and Rayleigh waves) are distinguished.
2.1.1 Wave equations for an elastic medium
the displacements and the cubic dilation and rotation vector. These two equations may be easily transformed into wave equations.
In the first place, we apply the divergence operation to the Navier’s equation (Aki and Richards, 1980):
𝛼2𝛻𝜃 − 𝛽2𝛻 × 𝜔 = 𝑢̈ (2-1)
where 𝛼 and 𝛽 are parameters related to cubic dilation 𝜃 and the rotation vector 𝜔, and, in consequence, related to changes in volume and in shape without changes in volume, respectively. 𝑢̈ represents the second partial derivative of the displacement 𝑢.
The divergence of the gradient of 𝜃 is its Laplacian, that of the curl of 𝜔 is null and the divergence of the displacement 𝑢 is the cubic dilation 𝜃, given by the summation of longitudinal stresses (𝜃 = 𝜀11+ 𝜀22+ 𝜀33 ). Thus, we obtain:
𝛻2𝜃 = 1
𝛼2
𝜕2𝜃
𝜕𝑡2
(2-2)
To the same equation (2-1), we apply the curl operator. The curl of the gradient of the scalar function 𝜃 is null and that of the displacement 𝑢(𝑥, 𝑡) is the rotation vector 𝜔. The curl of the curl of 𝜔 is equal to the gradient of the divergence, which is null minus the Laplacian. The results is:
𝛻2𝜔 = 1 𝛽2
𝜕2𝜔
𝜕𝑡2
(2-3)
Equation (2-2) and (2-3) have the form of wave equations for the scalar function 𝜃 and vector function 𝜔. The solution of both equations represent waves that propagate in the elastic medium and the parameters 𝛼 and 𝛽 are their velocities. These velocities are functions of the elastic coefficients 𝜆 and 𝜇 and the density 𝜌.
Because 𝜃 represent changes in volume without changes in shape, solutions of equation (2-2) correspond to compressionala and dilational motion, or longitudinal waves, also called P-waves. Solutions of equation (2-3) represent shear waves that propagate with velocity 𝛽. The medium changes in shape, but not in volume, since the divergence of 𝜔 is null. These waves are called S-waves.
2.1.2 Potential functions
Displacement 𝑢(𝑥, 𝑡) in an elastic medium form a vector field. We can, therefore, apply Helmholtz’s theorem that allows their rappresentation in terms of two potential functions, a scalar potential 𝜙 and a vector potential 𝜓:
By defining the rotation tensor as 𝜔 = ∇ × 𝑢 and the cubic dilation as 𝜃 = ∇ ∙ 𝑢 it is easy to reduce the relations of the two potentials to the cubic dilation 𝜃 and the rotation 𝜔:
𝜃 = 𝛻2𝜙 (2-5)
𝜔 = −𝛻2𝜓 (2-6)
These relations indicates that 𝜙 is related to changes in volume and 𝜓 to changes in form. We can even rewrite the differential equation of motion in term of the wave potentials, by a scalar and a vector equation in a much more simply form:
𝛼2𝛻2𝜙 +𝜙 𝜌 = 𝜙̈ (2-7) 𝛽2𝛻2𝜓 +𝜓 𝜌 = 𝜓̈ (2-8)
2.1.3 Types of body waves
Body waves are transmitted through the interior of the earth, the medium of the wave, and consist of compressional waves (P-waves) and shear waves (S-waves). Body waves propagate inside the earth with spherical or hemispherical wave fronts (depending on the position of the source) increasing wider radius. The two main types are:
P-waves: The particle motion of compressional waves is parallel to the motion of the wave itself, causing dilatation and compression of elementary volume particles (Aki & Richards, 1980). P-waves are the first to reach the surface and recorded by seismographs, propagating in depth at a speed between 1.5 and 8 km/s, depending on the material density; they can propagate either through the solid rock, or through a liquid material (magma or water). They are compression waves, which originate from the hypocenter and propagate within the volume of the rocks by successive compression and dilation of the rocks themselves, causing volume changes. They are also called longitudinal waves (or compression waves) because the oscillations of the infinite planes in which one can imagine dividing the rocky body occur in the same direction of wave propagation (as in figure 2.1);
Figure 2-1: Particle motion associated with compressional waves
S-waves: The particle motion associated with shear waves is perpendicular to the direction of wave propagation and has therefore both a vertical (SV) and a horizontal (SH) component. The transverse particle motion causes shear deformations (distortional) of volume elements within the medium (Aki & Richards, 1980; Kramer, 1996). They are also called secondary because they are slower than the P waves that represent the first arrivals. The wave can be polarized in two different directions, in the vertical direction SV and in the horizontal direction SH. These two components are identical in the case of an isotropic medium while they are separate and travel at different speeds considering a non-isotropic medium (as in Figure 2.2).
Figure 2-2: Particle motion associated with shear waves
As regards to body waves, although both are usually generated, depending on the source mechanism, those of one type tend to prevail over the other. For example, in the case in which the source is represented by a deep explosion, compressive stresses will prevail and the waves generated are mainly P-waves, when, instead, the source is due to a deep flow, as happens for the earthquakes, then the stresses induced in the ground are mainly cut off and the S-waves prevail.
The same result of equations (2-2) and (2-3) can be obtained for the potentials 𝜙 and 𝜓 defined in (2-4). If in equations (2-7) and (2-8) we disregard the contribution of body forces 𝜙 and 𝜓, we obtain:
𝛻2𝜙 = 1 𝛼2 𝜕2𝜙 𝜕𝑡2 (2-9) 𝛻2𝜓 = 1 𝛽2 𝜕2𝜓 𝜕𝑡2 (2-10)
In the absence of body forces, the potentials 𝜙 and 𝜓 are also solutions of the wave equation. Since 𝛼 and 𝛽 are the velocities of P and S waves, 𝜙 is the potential of P waves and 𝜓 that of S waves. The total elastic displacement 𝑢 is the sum of the displacements of P and S waves and can be written as:
𝑢 = 𝑢𝑃+ 𝑢𝑆 (2-11)
By defining velocities 𝛼 and 𝛽 of P and S waves as:
𝛼 = √(𝜆 + 2𝜇) 𝜌 = √
𝑀𝑉
𝜌
(2-12)
where 𝑀𝑉 is the one-dimensional compression stiffness module, and 𝜌 is the mass
density.
𝛽 = √𝜇 𝜌
(2-13)
with 𝜇 stiffness shear modulus of the medium. The wave equation for P-waves can be rewritten as:
𝜌𝑑
2𝜙
𝑑𝑡2 = (𝜆 + 2𝜇)𝛻2𝜙
(2-14)
where 𝜌 is the density, 𝜙 is the potential of P waves, while 𝜆 and 𝜇 are the Lamè constants. 𝜇 is the stiffness modulus, while 𝜆 is defined as 𝜆 = 𝐾 − 2/3 𝜇, where 𝐾 is the compressibility module.
The study of the dynamic equilibrium of the ideal elastic medium shows that the volume of seismic waves associated with states of compression or volumetric expansion, i.e. the P-waves, propagates in a direction parallel to the displacement of the volume element hit by the wave and with 𝛼 velocity
Compressional waves are connected to distortional deformation phenomena, i.e. S-waves, are instead characterized by a perpendicular direction to the displacement of the volume element hit by the wave. S-waves are characterized by a wave equation equal to:
𝜌𝑑
2𝜓
where the term 𝛻 × 𝑢 represents the quantity being propagated.
Introducing 𝑢𝑃 = ∇𝜙 and 𝑢𝑆 = ∇ × 𝜓 we can write wave equations in terms of displacement 𝑢: 𝜕2𝑢2 𝜕𝑥12 = 1 𝛼2 𝜕2𝑢2 𝜕𝑡2 (2-16) 𝜕2𝑢 1 𝜕𝑥12 = 1 𝛽2 𝜕2𝑢 1 𝜕𝑡2 (2-17)
with 𝑢1 and 𝑢2 solutions of wave equations.
The ratio of 𝛼 and 𝛽 can be expressed solely as a function of the Poisson ratio 𝜈:
(𝛼 𝛽) 2 = 𝜆 + 2𝜇 𝜇 = 2(1 − 𝜈) (1 − 2𝜈)> 1 (2-18)
which shows that it is always 𝑉𝑆 < 𝑉𝑃.
For 𝜈 = 1/4 (a typical value for several materials), 𝑉𝑃 = √3 · 𝑉𝑆
Type of soil VP (m/s) VS (m/s)
Saturated clay 1500 100 – 150
Fine and medium sand 300 – 500 120 – 200
Dense sand 400 – 600 200 – 400
Gravel 500 – 750 300 – 600
Sandstone 1500 – 4500 700 – 1500
Marl 1500 – 4500 600 – 1500
Table 2-1: Typical values of 𝑽𝑷 and 𝑽𝑺
A typical solution of the wave equations (2-9) and (2-10) are a harmonic function as:
𝑓(𝑥, 𝑡) = 𝐴𝑒𝑖(𝑘𝑥−𝜔𝑡)+ 𝐵𝑒𝑖(𝑘𝑥−𝜔𝑡) (2-19)
Where 𝜔 represents the angular frequency and 𝑘 the wave number. The velocity of wave propagation is 𝑐 = 𝜔/𝑘. Another form of the solution can be represented by using sine and cosine functions:
𝑓(𝑥, 𝑡) = 𝐴𝑐𝑜𝑠(𝑘𝑥 − 𝜔𝑡) + 𝐵𝑠𝑖𝑛(𝑘𝑥 − 𝜔𝑡) (2-20)
2.1.3.1 Fourier Transform
Waves with an arbitrary dependence in time can be represented by the sum or integral of harmonic waves of different frequencies using Fourier’s trasform:
𝑓(𝑥𝑖, 𝑡) = 1 2𝜋∫ 𝐹(𝜔)𝑒𝑥𝑝 [𝑖 ( 𝜔 𝑐(𝜔)𝑆(𝑥𝑖) − 𝜔𝑡)] ∞ −∞ 𝑑𝜔 (2-21)
where 𝐹(𝜔) is a complex function that is called the complex spectrum of 𝑓(𝑥𝑖, 𝑡) and
can be representes as:
𝐹(𝜔) = 𝑅(𝜔) + 𝑖𝐼(𝜔) = 𝐴(𝜔)𝑒𝑖𝛷(𝜔) (2-22)
where 𝐴(𝜔) is the amplitude spectrum and 𝛷(𝜔) the phase spectrum.
2.1.4 Phase and group velocities
For wave trains containing more than one frequency, in a visco-elastic medium, the phase velocity is a function of the frequency 𝑐(𝜔) or wave number 𝑐(𝑘). This implies that the wave number is a function of frequency 𝑘(𝜔) and vice versa for 𝜔(𝑘). In this case, we have the phenomenon of wave dispersion and can define the group velocity as:
𝑣 =𝑑𝜔 𝑑𝑘
(2-23)
This velocity is referred to a packets or groups of waves. If we substitute 𝜔 = 𝑐𝑘, we obtain the relation between phase and group velocities:
𝑣 = 𝑐 + 𝑘𝑑𝑐 𝑑𝑘
(2-24)
2.1.5 Surface waves
Surface waves are generated in the presence of a free boundary, such as the surface of the Earth, or along the interface between two different elastic media, and propagate parallel to this interface.
Several types of surface waves exist and can be classified with respect to the polarization of the ground motion associated with the propagation: Rayleigh waves involve elliptical motion in the vertical plane containing the wave propagation direction (Figure 2-3); Love waves involve transverse motion (Figure 2-4); Scholte waves propagate at the earth/water interface, and should thus be used for underwater surface wave analysis.
Rayleigh waves result from the interaction of P-waves and SV-waves with the surface of the earth (Aki & Richards, 1980). The particle motion of Rayleigh waves has both a vertical and a horizontal component and is reminiscent of rolling ocean waves (Rayleigh, 1885; Aki & Richards, 1980; Kramer, 1996). The wave motion is retrograde (anticlockwise) closest to the surface, but becomes prograde (clockwise) at greater depths.
Figure 2-3: Particle motion associated with Rayleigh waves
Figure 2-4: Particle motion associated with Love waves
In a homogeneous half-space, the Rayleigh wave velocity is independent of frequency, i.e. Rayleigh waves are non dispersive in a homogeneous medium, whereas for a point load, the rate of spatial decay is proportional to the inverse of the square root of the distance from the source. Conversely, for a point source, the geometric attenuation factor of body waves propagating along the boundary of an elastic half-space is proportional to the inverse of the square of the distance (Ewing et al. 1957). Thus, at distances on the order of one to two wavelengths from the source, the contribution of body waves becomes negligible, and the wave field is dominated by Rayleigh waves (Figure 2-6).
In the direction orthogonal to that of propagation, the displacement field generated by a surface wave decays exponentially because no energy is propagated in the interior of the half-space (Figure 2-5). It can be shown that most of the strain energy associated with surface wave motion is confined within a depth of about one wavelength λ from the free boundary (Achenbach 1984). Hence, Rayleigh waves with long wavelengths penetrate deep into the interior of a medium. Because wavelengths are proportional to the inverse of frequency in harmonic waves, this statement can be interpreted as follows: high-frequency waves are confined to shallow depths within the medium, whereas low-frequency components involve motion also at large depths.
Figure 2-5: Displacement amplitude of Rayleigh waves versus dimensionless depth (Richart et al., 1970).
In vertically heterogeneous media, surface wave propagation is governed by geometric dispersion: harmonic waves of different wavelengths 𝑘 propagate within different depth ranges and, hence, for each wavelength the phase velocity 𝑣 depends on the elastic properties and density of the subsurface within the propagation depth range. Distribution of phase velocities as a function of frequency or wavelength is called a dispersion curve. In vertically heterogeneous media with increasing velocity (both 𝑉𝑆 and
𝑉𝑃) with depth, the velocity of propagation of surface waves decreases for increasing frequency (normally dispersive profiles).
Figure 2-6: Distribution of compressional, shear and Rayleigh waves generated by a point load in a homogeneous, isotropic, elastic half-space (Woods, 1968).
Typically, multiple phase velocities exist for a given frequency, making the dispersion curve multimodal. The mode with the lowest phase velocity (at each frequency) is referred to as the fundamental mode. at each frequency, larger than a well-defined cut-off frequency, different modes of vibration exist (Aki & Richards, 1970). Each mode is characterized by its own propagation velocity, which always increases from the fundamental to the higher modes (overtones).
The propagation velocity of Rayleigh waves is proportional to the value assumed by the S-waves and approximately given by the following relation (Viktorov, 1967):
𝑉𝑅 ≅ 0,87 + 1,12𝑣 1 + 𝑣 𝑉𝑆
(2-25)
2.2 Attenuation theory
The main focus of this section, is a general overview of the attenuation theory and then the constitutive models adapted in literature.
Mainly, seismic attenuation is caused by three physical phenomena:
Intrinsic attenuation: the energy dissipated in heat due to internal friction during the passage of the elastic wave;
Geometrical spreading: it is the decrease of the energy density that occurs in the expansion of the elastic wave front, due to the fact that the energy irradiation takes place on a greater volume at increasing distances from the source, Theory and numerical model studies (Haterly, 1986) show that in most cases geometrical spreading is a complicated phenomenon, especially near the source; methods like amplitude decay appeared to be very sensitive to geometrical spreading (Jongmans, 1990); accurate studies on geometrical spreading effects can be found on Morozov (2008, 2010);
Scattering: scattering phenomena are produced by reflection, refraction, and conversion of elastic energy due to the irregularities and discontinuities present in the medium.
2.2.1 The quality factor Q
Wave propagation, implies a variation of motion in space and time. Thus, attenuation of wave motion can be observed in time or in space. For a given location wave motion is attenuated with time and for a given time, it is attenuated with distance. For wave motion, we can define the damping ratio 𝐷(𝜔) as a function of frequency in the form:
𝐷(𝜔) = (1 4𝜋)
∆𝐸 𝐸
In this definition, 𝐷 represents the material damping ratio of the elastic energy ∆𝐸 dissipated during one cycle of harmonic motion of frequency 𝜔 due to imperfections in the elasticity of the material and the maximum or the mean energy 𝐸 accumulated during the same cycle.
Another parameter related to the material damping, which is largely used by geophysicists and seismologists is the quality factor 𝑄, that is related to the material damping 𝐷 as follows: 𝑄(𝜔) = 1 2𝐷(𝜔)= (2𝜋) 𝐸 ∆𝐸 (2-27)
The 𝑄 factor may also be defined as the tangent of the phase lag between stress and strain, which are linked by the modulus (Wang, 2006).
The measured or effective 𝑄 is a combination of intrinsic 𝑄 of the rocks and apparent 𝑄 by elastic scattering as follow (Lerche and Menke 1986; Spencer et al., 1986):
1 𝑄𝑒𝑓𝑓 = 1 𝑄𝑖𝑛𝑡+ 1 𝑄𝑠𝑐𝑎 (2-28)
The scattering attenuation 𝑄𝑠𝑐𝑎−1 (sometimes called extrinsic attenuation (e.g., in Virieux
and Operto, 2009)) and intrinsic attenuation 𝑄𝑖𝑛𝑡−1 are significant to interpret the geology and
tectonics of an area (Blair, 1990; White, 1992; Barton, 2007).
If we consider an harmonic wave of amplitude 𝐴 that is attenuated so that, after one period or one wave length, its amplitude is 𝐴𝑒𝑥𝑝(−𝜋/𝑄), then, since the energy is proportional to the square of the amplitude, the energy dissipated in one cycle is (Udías, 2017):
∆𝐸 = 𝐴2[1 − exp (−2𝜋
𝑄)]
(2-29)
By using the ratio ∆𝐸/𝐸, we obtain the equation (2-27). By using the amplitude ratio ∆𝐴/𝐴, we define for wave propagation:
1 𝑄 = 1 𝜋 ∆𝐴 𝐴 (2-30)
Since wave phenomena can be considered as a variation in time or space, we can define temporal (𝑄𝑡) and spatial (𝑄𝑒) quality factors. 𝑄𝑡 represents the wave attenuation with time
during one period for a fixed point in space and 𝑄𝑒 represents the attenuation at a given
time along wavelength distance.
Wave attenuation is usually indicated by assigning complex values to the frequency and wavenumber. For a harmonic elastic wave we have:
where the wavenumber and frequency are now complex quantities:
𝑘′= 𝑘 + 𝑖𝑘∗ (2-32)
𝜔′= 𝜔 + 𝑖𝜔∗ (2-33)
According to definitions of 𝑄𝑡 and 𝑄𝑒 we can easily deduce that:
1 𝑄𝑡= 2𝜔∗ 𝜔 (2-34) 1 𝑄𝑒 = 2𝑘∗ 𝑘 (2-35) 2.2.1.1 Frequency dependence
Many studies on body, surface and coda waves describe attenuation depending on frequency adopting the visco-elastic model, this bond is commonly represented in an exponential type of quality factor 𝑄:
𝑄(𝑓) = 𝑄0( 𝑓 𝑓0 ) ƞ (2-36)
where ƞ is a constant usually between −1 < ƞ < 1 (Li et al. 2016), 𝑓0 is a reference
frequency of 1 Hz, while 𝑄0 is the corresponding value of the quality factor (Aki and Chouet,
1975). The values of 𝑄 (considering a ƞ > 0, while very high values are not very common) tend to increase as the frequency increases. Another common hypothesis is that 𝑄 is independent of frequency at least in a limited frequency band (Johnston et al., 1979).
At the time of Knopoff’s review (1964) it was customary to assume that 𝑄 was substantially independent of frequency. His assumptions of ‘a homogeneous sample’ and ‘at low frequencies’ are clearly important in view of what is now understood about potential dissipation mechanisms in microcracked rock samples or in rock masses with sets of bedding planes and/or joints. Laboratory experiments on many homogeneous solids had shown that up to moderately high frequencies, the dimensionless quantity 𝑄 was virtually independent of frequency. This preliminary conclusion indicated that the mechanism by which energy has removed from elastic waves in solids was not the same as the mechanism for attenuation in liquids, where attenuation is frequency dependent (Barton, 2007). Some physical phenomena such as viscous relaxation, irregular saturation, squirt flow, scattering, etc., are related to 𝑄 dependence on frequency.
Some typical values of 𝑄 for longitudinal excitation of various solids, selected from Knopoff, (1964) are reported below:
Steel 5000 Copper 2140 Silica 1250 Glass 490 Diorite 125 Limestone 110 Lead 36 Sandstone 21 Shale 10 Celluloid 7
Table 2-2: Some examples of 𝑸 for longitudinal or bending excitation of various solids (Knopoff,1964), sorted by magnitude.
2.2.1.2 10 Hz Transition problem
Measurements of 𝑄𝑆 carried out at seismogenethic depths and using coda waves show
only a weak increase with the frequency between 10 and 100 Hz. Combining these results with those coming from near-surface studies at low frequency, a significant change in 𝑄𝑆
frequency dependence around 10 Hz in the active tectonic regions, passing from low values of 𝑄0 and high values of ƞ (> 1) to large values of 𝑄0 and moderate values of ƞ (ƞ~0.2 ÷
0.3), exceeded this value of frequency. This change is called by the authors the "10 Hz transition problem" (Abercrombie, 1998). It could be due to changes in the nature of the earth's crust in the most superficial layers (few hundred meters), or simply to a wrong hypothesis in the model used for the estimation of 𝑄. In Morozov (2008) the problem of the 10 Hz transition and the absorption band is substantially attributed to some deviations from the geometric attenuation law.
Alternatively, the variation observed in the 𝑄 frequency dependence is able to provide important information about the nature of the earth's crust itself according to different scales.
In Abercrombie (1998) a weak increase in 𝑄𝑆 is observed with frequency (from about 500 to
10Hz up to 1200 to 100Hz). Various studies (Abercrombie, 1997; Jongmans and Malin 1996), considering a near-surface analysis, show low values of 𝑄 (about 10 in the first 100 meters of land), which grow rapidly with depth, and independent or weakly dependent from the frequency, in the range 𝑓 ~ 2 ÷ 100. The attenuation in this case is rather independent even from the rock type (Abercrombie, 1998). These combined observations suggest that the main cause of surface attenuation is the opening of the microfractures with a consequent decrease in the lithostatic pressure.
2.2.1.3 Attenuation in rocks
As the wave propagates thorugh the material, the normal stress between the crack-faces increases, and thus the frictional shear stress also increases. As the wave passes, the direction of the frictional shear stress is reversed, and again work must be done against friction as the crack returns to its equilibrium position (Barton, 2007). Clearly, micro-scale deformations are implied here. Numerous mechanisms have been proposed to explain
attenuation of seismic waves in rock and in rock masses. Johnston et al., 1979 listed the following in their landmark paper:
Matrix anelasticity;
Frictional dissipation due to relative motions at grain boundaries and across crack surfaces (Walsh, 1966);
Fluid flow causing relaxation due to shear motions at pore-fluid boundaries; Relative motion of the matrix frame with respect to the fluid inclusions in the
case of fully saturated rock (Biot, 1956a);
Squirt phenomena (Mavko and Nur, 1975 and O’Connel and Budianski, 1977); Gas pockets squeezing when only partial saturation;
Geometrical effects due to small pores, larger irregularities, thin beds (this category obviously extends to major discontinuities, faults, rock boundaries, dykes etc.).
Figure 2.7: Schematic illustration of several proposed aitenuation mechanisms for saturated and partially saturated rocks (Johnston, 1979)
2.2.2 Attenuation in body waves
The attenuation in body waves can be expressed by taking complex values for velocities of P and S waves, namely 𝛼′= 𝛼 + 𝑖𝛼∗ and 𝛽′= 𝛽 + 𝑖𝛽∗. Since the attenuation of body waves is measured from amplitude at various distances, the imaginary part of velocities are related to the spatial quality factor 𝑄𝑒. For P and S waves we can define quality
factors in a similar way: 1 𝑄𝛼 = 2𝛼 ∗ 𝛼 (2-37)
1 𝑄𝛽 =
2𝛽∗
𝛽
(2-38)
The complex velocities can now be expressed in terms of the corresponding 𝑄 factors: 𝛼′= 𝛼 (1 + 𝑖 2𝑄𝛼) (2-39) 𝛽′= 𝛽 (1 + 𝑖 2𝑄𝛽) (2-40)
In most seismologic problems, it is assumed that the relation between P and S quality factors in similar to (Udías, 2017):
1 𝑄𝛼 = 4 3( 𝛽 𝛼) 2 1 𝑄𝛽 (2-41)
If 𝑣 = 0.25 and 𝛼 = √3𝛽 the relations gives 𝑄𝛼= 9/4𝑄𝛽.
Following the ray theory, the attenuation of the amplitude of a monochromatic P wave in the Earth’s interior, become in a dispersive wave equation, given by:
𝐴 = 𝐴0exp (−
𝜔𝑠 2𝛼𝑄𝛼
) = 𝐴0𝑒−𝜔𝑡
∗ (2-42)
Where 𝐴 and 𝐴0 are the amplitudes at the observation point and the focus, and s is the
distance traveled along the ray. For an homogeneous medium 𝑡∗ = 𝑡/(2𝑄𝛼), where 𝑡 = 𝑠/𝛼 is the traveling time of P waves. The path attenuation factor 𝑡∗ in the exponent of equation (2-42) is often used in body-wave analysis (Der and Lees, 1985). This equation can be expressed for S waves in a similar way, substituting 𝛽 and 𝑄𝛽.
Existence of 𝑡∗or 𝑄 as attenuation properties is based on common observations that the negative exponent in the amplitude-decay expression increases with 𝑓 and accumulates with 𝑡 (Morozov, 2015).
Following Johnston, (1979) the attenuation is determined from the amplitude ratios of waves observed at a different distance. For body waves, we need observations along similar ray paths, so that the attenuation of amplitude is referred to a certain distance ∆𝑠 along the ray inside the Earth. In an approximate form, the attenuation with epicentral distance between two stations may be found from:
ln (𝐴2(𝜔)
𝐴1(𝜔)) = ln 𝐶 − 𝛾(𝜔)∆𝑥
(2-43)
Where 𝛾(𝜔) = 𝜔∆𝑥/(2𝛼𝑄) = 𝜋𝑓/𝑄 is the overall attenuation of amplitude with horizontal distance and 𝐶 depends on the geometrical spreading. This equation illustates
the difference between the influences of Q geometrical spreading and anlelastic attenuation on the decrease in amplitude with distance.
The attenuation coefficient, 𝛾, is a quantity which measures energy absorption, and can be expressed in terms of wavelength 𝜆 as:
𝛾 = 𝜋
𝜆𝑄(𝑛𝑒𝑝𝑒𝑟𝑠 𝑢𝑛𝑖𝑡⁄ 𝑙𝑒𝑛𝑔𝑡ℎ) =
20𝜋
(𝑙𝑛10)𝑄(𝑑𝑏 𝜆⁄ )
(2-44)
which leads to the approximation mentioned above; that is, 27.3𝑄 𝑑𝑏 per wavelength (Johnston and Toksöz, 1979).
2.2.3 Attenuation in surface waves
Following equations (2-39) and (2-40), the frequency-dependent complex wavenumber 𝑘𝑛∗ defines the propagation of dispersive surface wave modes in linear viscoelastic media. As introduce in the equation (2-32), the phase velocity and the attenuation constant for the nth mode are related to the complex wavenumber by:
𝑘𝑛∗ = 𝑅𝑒(𝑘𝑛∗) + 𝐼𝑚(𝑘𝑛∗) = 𝑘𝑛− 𝑖𝛾𝑛 =
𝜔 𝑣𝑛
− 𝑖𝛾𝑛 (2-45)
The real part of the wavenumber is the physical wavenumber 𝑘𝑛, a function of the real
physical phase velocity 𝑣𝑛; the imaginary part of the complex wavenumber is the
attenuation constant, associated with the 𝑛𝑡ℎ mode of propagation (Aki and Richards, 1980. The asterisk indicates complex numbers.
. The frequency-dependent attenuation constant 𝛾𝑛 is the coefficient of the exponential
function describing the spatial decay of the spectral amplitude for a single mode in the far-field (Strobbia, 2014). The real and imaginary parts of the complex wavenumber are linked by the Kramers-Kronig relation, and have to be Hilbert transform pairs tosatisfy the principle of causality (Bracewell, 1965; Tschoegl, 1989). This is used in the solution of the forward problem (Lai and Rix, 2002).
𝐴𝑛(𝜔, 𝑟) = 𝐴𝑛,0(𝜔)
1 √𝑟𝑒
−𝛾𝑛(𝜔)𝑟 (2-46)
where r is the source to receiver distance.
The spatial decay of the wave amplitude, due to the geometrical spreading, is represented by the square root of the distance, for each mode.
In a medium with homogeneous velocity and intrinsic absorption, both wavenumber and attenuation coefficient are frequency dependent. A representation showing the relationship with the material properties can be obtained using two different parameters, derived from the real and imaginary part of the wavenumber.
𝑣𝑛 = 𝜔
𝑅𝑒(𝑘𝑛) (2-47)
It has a more intuitive and direct relationship with the layer velocities. The attenuation coefficient is a wave propagation parameter; it describes the spatial amplitude decay of the surface wave as it propagates in an anelastic medium. The intrinsic material energy dissipation can be measured using different parameters.
The second parameter is the Rayleigh modal phase damping ratio (Misbah and Strobbia, 2014), typically used in soil dynamics, which is defined using an analogy with the body wave damping ratio in a viscoelastic medium, as:
𝐷(𝜔) = 𝐼𝑚(𝑘
∗2)
2 ∙ 𝑅𝑒(𝑘∗2)
(2-48)
The Rayleigh phase damping ratio is a modal property, related to the damping ratio of the subsurface layers, that is more directly related to the material absorption.
As an alternative to the phase damping ratio, it is possible to define a phase quality factor 𝑄, related to the subsurface quality factor (Carcione et al., 1988), as:
𝑄(𝜔) =𝑅𝑒(𝑘
∗2)
𝐼𝑚(𝑘∗2)
Chapter 3.
Experimental and theoretical
attenuation measurements of body and
surface waves
3.1 Body waves methods
3.1.1 Review of methods
Two different methods are presented to estimate seismic attenuation from borehole surveys, other existing method that have used borehole surveys are listed in the table below (Table 3-1). The first one is the rise-time method which operates in time domain and the second is the spectral ratio methods which is defined in the frequency domain. Many reviews of such methods exist in literature, consisting in a comparison between these two or even more methods (Tonn, 1991; Janssen et al., 1985; Cheng and Margrave, 2012). In this chapter I have first attached a synthetic review (table 3-1) of the various methods appearing in the literature on seismic attenuation estimation using body waves, that can be allied on borehole or surface seismic surveys, giving the complete theoretical basis of the two methods which are used in the experiments presented later on in this thesis. In spite of the broad variety of methods available for 𝑄-computations, only a few techniques such as the rise-time method or the spectral ratio method are widely accepted for borehole studies. These methods are more robust and unaffected by far-field geometric spreading. My review does not cover the methods employing coda waves which are mainly based on seismological (earthquake) recordings (Aki and Chouet, 1975).
Method Code Domain Reference
Amplitude decay AD x-t -
Analytical signal AS x-t Engelhard et al. (1986) Wavelet modelling WM x-t Jannsen et al. (1985)
Phase modelling PM x-t -
Frequency modelling FM x-t -
Rise-time RT x-t Gladwin and Stacey (1974)
Beam Forming BF x-t White (1988) Matching technique MT x-ω Raikes and White (1984)
Spectral modelling SM x-ω Jannsen et al. (1985) Spectral ratio method SR x-ω Bath (1974), Teng (1968)
Centroid Frequency Shift
CFS x-ω Quan and Harris (1997) Peak Frequency Shift PFS x-ω Zhang ed Ulrych (2002) Dominant and Central
frequency shift
DCFS x-ω Li et al. (2015)
Table 3-1: Review methods to estimate seismic attenuation through borehole surveys
3.1.2 Time domain methods
3.1.2.1 Rise-time method
The rise-time method is a time-domain method based on the broadening of the pulse resulting from the attenuation of the high-frequency components. An empirical mathematical model for pulse broadening in an inhomogeneous medium has been suggested by Gladwin and Stacey (1974) and Stacey et al. (1975) and supported theoretically by Kjartansson (1979).
Gladwin and Stacey (1974) defined the rise-time (𝜏) as the “interval between the intersections of the steepest rise of a pulse onset with zero level and peak pulse amplitude”. Or, alternatively, the ratio of the maximum peak amplitude to the maximum slope of the first quarter-cycle of the pulse.
Gladwin and Stacey (1974) proposed a rise-time principle indicated by the following equation: 𝜏 = 𝜏0+ 𝐶 ∫ 𝑑𝑠 𝑣𝑄 = 𝜏0+ 𝐶 ∫ 𝑑𝑇 𝑄 𝑟𝑎𝑦 𝑟𝑎𝑦 (3-1)
where 𝜏 is the rise-time of the first arrival waveform, 𝜏0 is the origin pulse rise-time at
the source (Stacey et al. used zero for this term), 𝑣 is the velocity, 𝑑𝑆 is the segment along the ray path, 𝑑𝑇 is the travel time, 𝑄 is the quality factor and 𝐶 is a constant. The velocity and quality factor vary with the position 𝑟 of the receivers.
The rise-time, defined on displacement records, is approximately the pulse width used by Zucca et al. (1994) on recorded seismograms. The pulse width, or rise-time,𝜏, is the time difference from the onset of initial arrival to initial peak for displacement seismograms, or, equivalently, from on set to first zero crossing for velocity records or to second zero crossing for acceleration seismograms. In practice, the onset of a signal can be difficult to determine precisely in the presence of noise. Even for noise-free seismograms, bandwidth limitations can make picking the on-set difficult. For short pulse widths, the error introduced by mis-picking can be large and unacceptable (Wu and Lees, 1996).
As the seismic wave travels through the medium, dispersion causes pulse spreading, this process is well established for optical fiber studies, as in Figure 3.1.
Figure 3.1: Broadening and attenuation of two adjacent pulses as they travel along a fiber.
The same phenomena occur on a seismic wave travelling through the earth.
Kjartansson (1979) indicated several ways to measure the pulse widths, as showed in Figure 3.2:
In this study, we used a near-surface VSP (Vertical Seismic Profiling; Balch et al., 1982) data records; measurements based on the first quarter-cycle of the pulse should be used to avoid interference with the later cycles of the pulse. Suitable measures, therefore, are the pulse rise-time calculated as the maximum amplitude divided by maximum slope, as the separation between the first inflection point and the first peak. An example of one rise-time has showed in figure 3.3. The experimental procedure will be showed in detail in chapter 4.
Figure 3.3: Example of a rise-time measurement of a single P-wave trace at 41 meter depths in Rieti site.
Assuming a homogeneous 𝑄 = 𝑄0, equation (3-1) becomes a linear relation:
𝜏 = 𝜏0+ 𝐶𝑇 𝑄0
(3-2)
The constant 𝐶 in (3-2) was first determined experimentally (Gladwin and Stacey, 1974) for ultrasonic acoustic pulses in the kilohertz frequency band to be 0.5, and a rigorous theoretical justification was supplied later (Kjartansson, 1979). According to Kjartansson's (1979) theory of impulsive displacement sources, the rise-time of recorded displacement, velocity, and acceleration seismograms obey the relation (3-2), although with different constants 𝐶. For > 30 ,𝐶 will take on values of 0.485, 0.298, and 0.217 for displacement, velocity, and acceleration records, respectively (Blair and Spathis,1982). Blair and Spathis (1982) further suggested that 𝐶 can take on different values for different sources.
The main advantage of the pulse-broadening or rise-time method is that only a very short time-length of the seismogram is required for processing, by the time we use only the first quarter cycle, (Kurtuluş and Sertҫelik, 2010). Hatherly (1986) found that the measurement of the pulse width appears to be suitable even for use with shallow seismic refraction data.
3.1.3 Frequency domain methods
3.1.3.1 Spectral ratio method
The second method used in this study is the spectral ratio method. The method in the frequency domain has been used widely for estimating the seismic attenuation (Teng, 1968; Jongmans, 1982, Badri and Mooney, 1987; Sarma and Ravikumar, 2000; Abercrombie 2000; etc..). The method is based on the spectral amplitude ratio at two different distances.
Considering the wave propagation expression: 𝑈(𝑥, 𝜔) = 𝑈0(𝜔) exp[−𝛼(𝜔)𝑥] exp [𝑖𝜔 (𝑡 − 𝑥
𝑣(𝜔))]
(3-3)
And taking only amplitude attenuation we obtain:
𝐴(𝜔) = 𝐴0(𝜔) exp[−𝛾(𝜔)𝑥] (3-4)
where 𝐴(𝜔) is the amplitude spectrum of the trace at receiver depth , 𝑧 and 𝐴0(𝜔) at a
shallower depth 𝑧0. The amplitude 𝐴(𝜔) is decayed exponentially from a reference
amplitude 𝐴0(𝜔). 𝛾(𝜔) is the attenuation coefficient that can be expressed in different ways
as: 𝛾(𝜔) = 𝜋𝑓 𝑣𝑄= 𝜋 𝑣𝜆 = 𝜔 2𝑣𝑄 = 𝜔(𝑡 − 𝑡0) 2𝑄 (3-5)
where 𝑣 is the velocity, 𝜆 is the wavelenght, 𝑓 is the frequency in Hz, 𝜔 is the frequency in radiants and 𝜏 = (𝑡 − 𝑡0) is the time delay between two first arrival at two different
distance (depths) 𝑧 and 𝑧0.
In general case 𝐴(𝜔) can be expressed as a product of the source function 𝐴0(𝜔) with
a number of transfer functions, each for an appropriate portion of the transmitting medium. It includes: instrumental transfer function, crustal transfer function and geometrical transfer function. Considering only geometrical transfer function the equation (3-4) becomes:
𝐴(𝜔) = 𝐴0(𝜔)𝐺0(𝑡) exp[−𝛾(𝜔)𝑥] (3-6)
where 𝐺(𝑡) is the geometrical factor that includes spreading, reflections, etc.. Considering the ratio of the Fourier spectral amplitudes we obtain:
𝐴(𝜔) 𝐴0(𝜔)
𝐺(𝜔)
𝐺0(𝜔)exp[−(𝛾0(𝜔) − 𝛾(𝜔))𝑥]
(3-7)
and applying simple logarithmic properties we can obtain:
where the term on the left side of the equation is called reduced spectral ratio, the ratio ln [𝐺(𝜔) 𝐺⁄ 0(𝜔)] is frequency-independent. This simple result shows that the reduced
spectral ratio is a linear function of frequency (Teng, 1968).
For typical rocks where 𝑄 = 10 ÷ 100, the term ln [𝐺(𝜔) 𝐺⁄ 0(𝜔)] is negligible (Sarma
and Ravikumar 2000). Now, the decay of the amplitude at certain distance from source is measured using the simplified spectral ratio method:
ln [𝐴(𝜔) 𝐴0(𝜔)] = − 𝜔(𝑡 − 𝑡0) 2𝑄 = − 𝜋𝑓(𝑡 − 𝑡0) 2𝑄 (3-9)
Measuring the slope of the spectral ratio:
𝑚 = 1 𝜔ln [ 𝐴(𝜔) 𝐴0(𝜔)] = 2𝜋 𝑓 ln [ 𝐴(𝜔) 𝐴0(𝜔)] (3-10)
The slope 𝑚, is called differential attenuation, and contains all the information concerning the difference of wave attenuation along two different rays; can be found from the slope of the line fitted to ln [𝐴(𝜔) 𝐴⁄ 0(𝜔)] versus frequency 𝑓, as shown in the figure 3.4.
Figure 3.4: Slope estimation on reduced spectral ratio. The frequency band considered is 20-65 Hz for S-waves (Rieti site).
The 𝑄 value between 𝑧 and 𝑧0 is then estimated as:
𝑄−1(𝑧 − 𝑧
0) = −
2𝑚 𝜏
For in-situ measured seismograms, the method consists in calculating the Fourier transform of two signals and then the logarithmic ratio for each frequency. Since 𝑚 is independent of frequency, Q can be determined from the slope of the line fitted to 𝐴 vs. f The geometrical spreading factor, appearing only in the intercept b, must not be preliminarily known for Q determinations. The estimates of 𝑚 derived from this regression is a random quantity dependent on the sampling of the spectra and possess statistical errors (White, 1992).
In chapter 4, we attempt to improve the 𝑄 estimation by means of a near-surface VSP data, with an accurate determination of the time delay, processing, and finally a robust estimation of 𝑄 values for P and S waves in two different sites.
3.2 Surface waves methods
The main objective in surface wave testing is to extract information about the geometrical dispersion of surface waves from observations of particle motion at two or more receiver locations, associated with the intrinsic energy dissipation caused by material damping.
Attenuation and dispersion analysis of surface waves is generally performed like a standard MASW (Multichannel Analysis of Surface Waves) test, on multichannel measure-ments acquired using a linear array of receivers and an active source. The procedure requires accurate measurements of the amplitude of the surface wave particle motion because it contains information about attenuation and geometrical spreading. It is essential that the effects of noise are considered and that the amplitude perturbations are minimized. Verticality and physical coupling of each receiver should be checked carefully. Moreover, a previous accurate calibration of the receivers used in the shotgather is needed to guarantee a uniform array response.
The estimation of the intrinsic attenuation component can be used to assess the dissipa-tive properties of the medium, typically assuming a viscoelastic constitudissipa-tive model.
Such information is usually presented in the form of dispersion curves showing the variation of the attenuation coefficient versus frequency.
The purpose of our dispersion and attenuation analysis is to extract the information about geometric dispersion and spatial attenuation of the particle motion from acquired multichannel surface waves testing (an example is shown in figure 3.5). To this end, I implemented several analysis techniques in PYTHON to extract experimental dispersion and attenuation curves from recorded seismograms.
This chapter briefly summarizes the methods used to estimate experimental attenuation curves and focuses attention on the method proposed by Kudo and Shima (1970) and more recently by Xia et al. (2002). This method produces only the fundamental mode attenuation curve.
Figure 3.5: 24-channel shot gather obtained in the test site of Velino River in June 2018.
3.2.1 Experimental dispersion curves
In addition to the methods to estimate attenuation curves, the methods used to extract experimental phase velocity dispersion curves may be classified according to the procedure adopted (Foti et al., 2014):
Direct assessments of the propagation parameters, e.g., wavelength in the steady-state Rayleigh method or phase delay in the two-station spectral analysis of surface waves (SASW);
Regression methods, in which the propagation parameters are obtained by fitting the experimental data with the expected theoretical functions such as: multi-offset phase analysis (MOPA, Foti and Strobbia, 2006), spatial autocorrelation (SPAC, Aki (1957); Chávez-García et al. (2005)), transfer function;
Transform-based methods, in which the experimental data are transformed from the original space–time domain into a different domain in which the propagation parameters are identified as spectral maxima (e.g., frequency–wavenumber, frequency–slowness, frequency–velocity analysis).
For active MASW experiments I implemented a PYTHON version of the Phase shift method, that compute dispersion data using a transformation described in Park et al. (1998). Other methods utilized to compute dispersion curves are f-k method, that compute dispersion data using a standard frequency-wavenumber transformation (i.e., convert the data from space-time to frequency-wavenumber domain using a two-dimensional Fast Fourier Transformation), fdbf (Frequency Domain Beamformer), that compute dispersion data using frequency domain beamformer (Foti et al. 2014), and tau-p, that compute dispersion data using a slant-stack (linear Radon) transform (McMechan and Yedlin, 1981).
3.2.2 Review of methods for estimation of attenuation curves
In the case of surface waves testing, the Q structure cannot be estimated in a straightforward way, but we need to apply an inversion. This chapter is a quick review of the most utilized methods to estimate experimental attenuation curves (attenuation coefficients) from surface waves data. Kudo and Shima method (1970) has been adopted for our purposes, in order to extract experimental attenuation curves. For the experimental dispersion curves, as mentioned before, I implemented Phase shift method. It is proved that phase shift method is able to produce the best results in terms of accuracy and computation efficiency for the unconsolidated sediments considered in our work. Phase shift shows extremely stable results also when a reduced number of traces is considered and other methods fail due to spatial aliasing or severe noise content that prevents from unambiguous interpretation (Dal Moro, 1999).
Most of the methods have been optimized for SASW or MASW data testing.
Method Domain Reference
Tranfer function technique ω -x Lai et al. (2002) Amplitude regression versus offset ω -k Rix et al. (2000)
Half power bandwidth ω -k Badsar et al. (2010)
Multichannel multimode complex wavenumber estimation
ω -k Misbah and Strobbia (2014) Spatial decay of the Arias intensit r-x Badsar et al. (2011)
Circle fit method ω-k Ewins (1984)
Spatial decay of surface waves ω-x Kudo and Shima (1970), Park et al. (1998)
Table 3-2: Review methods to estimate seismic attenuation through borehole surveys
3.2.3 Phase shift method
According to Park et al. (1998) work, the phase shift method consists in a wavefield transformation that provides images of phase-velocity dispersion curves directly from the recorded wavefields of a multichannel shot gather. With this method, different modes are separated with higher resolution even if the shot gather consists of a relatively small number of traces collected over a limited offset range. It is a three-step transformation method:
Fourier transform and amplitude normalization; dispersion imaging;
extracting of dispersion curves.
In the transformation theory we consider an offset-time (𝑥 − 𝑡) domain representation 𝑢(𝑥, 𝑡) of a shot gather as in figure (Figure 3.4), so that the Fourier transformation can be applied to the time axis of 𝑢(𝑥, 𝑡) to obtain 𝑈(𝑥, 𝜔):