Scuola di
Ingegneria
Industriale e dell’Informazione
Corso di Laurea Magistrale in Ingegneria Biomedica
A COMPUTATIONAL FLUID STRUCTURE
INTERACTION STUDY IN INTERNAL JUGULAR
VEINS SUBJECTED TO GRAVITY
RELATORE:
Prof. Christian Vergara CORRELATORE:
Dr. Maurizio Domanin (Divisione di Chirurgia Vascolare Ospedale Cà Granda Policlinco di Milano)
TESI DI LAUREA DI: Verdiana Carini Matr. 850271
A mia madre e a mio padre, per il loro quotidiani sacrifici
v
Contents
Abstract ... xii
Sommario ... xv
1 Introduction ... 18
2 The Venous System ... 21
3 Mathematical and Numerical Methods ... 38
3.3.1 The Navier Stokes Equations in a moving domain ... 44
3.3.2 Mechanical wall model ... 48
3.3.3 The coupled fluid structure interaction problem ... 50
3.4.1 The treatment of the geometric coupling and discretization in time ... 53
3.4.2 Numerical solution of the geometrically linearized fluid-structure interaction problem ... 55
3.4.3 Galerkin Approximation and Finite Element Method ... 56
4 Numerical Results ... 60
4.1.1 Geometry reconstruction and meshing ... 60
4.1.2 Geometrical features ... 66
4.1.3 Gravity ... 67
4.1.4 Boundary conditions ... 69
4.1.5 Generalities on the numerical simulations ... 73
1.1 The role of posture in internal jugular veins ... 18
1.2 Computational haemodinamics ... 19
1.3 Objective ... 20
2.1 Physiology and pathologies of venous system ... 21
2.2 Anatomy of vessel wall and valves ... 26
2.3 Venous haemodynamics and gravitational force ... 28
2.4 The internal jugular vein (IJV) ... 32
3.1 General assumptions ... 38
3.2 Modeling and Numerical choices in the literature ... 40
3.3 Mathematical modeling of the fluid structure interaction problem ... 43
3.4 Numerical discretization ... 52
4.1 Settings of the numerical simulations ... 60
4.2 The role of absorbing boundary conditions... 75
vi
4.3.1 Pressure results ... 80
4.3.2 Velocity results ... 84
4.3.3 Wall displacements and fluid mesh area results ... 86
4.4.1 Pressure results ... 89
4.4.2 Velocity results ... 94
4.4.3 Wall displacements and fluid mesh area results ... 97
4.4.4 WSS results ... 101
5 Conclusions and possible developments ... 108
Ringraziamenti ... 110
Bibliography ... 111
4.4 Results for IJV of PATIENT_I and PATIENT_II ... 87
vii
List of Figures
2.1 Representation of the main veins of the systemic venous system . . . 21 2.2 Schematic representation of the heart-lung circulation. The deoxygenated blood
(blue) is pumped by the right ventricle in the lungs where it becomes oxygenated blood (red) and it comes back through the pulmonary veins in the left ventricle 22 2.3 Schematic representation of the alteration of the blood flow in vein with
consequent creation of stagnant region and formation of embolus in deep venous thrombosis . . . 24 2.4 Representation of the main differences in the vessel wall of veins and arteries 26 2.5 Stress-Strain plot of 10 jugular veins. For each vessel, it has been considered a
sample in longitudinal (thin line) and circumferential (thick line) direction [50]. 27 2.6 (Left) Values of arterial and venous pressure in the supine position. (Right)
Values of arterial and venous pressure in the orthostatic position. . . . 29 2.7 Schematic representation of the quantities that act on the vein vessel. The
transmural pressure determines the grade of distension of the vein and it is defined as the difference between the intra and extra vessel pressure. . .
30 2.8 (Blue arrow) Change in shape of veins below the level of “zero pressure”
moving from supine to orthostatic position. (Red arrow) Change in shape of veins over the level of “zero pressure” moving from supine to orthostatic position. . . . . . 31 2.9 Relationship of venous volume to transmural pressure. At low pressures, veins
are compliant and change shape easily to accommodate large increases in volume. At high pressures, they become stiff and cannot accommodate large changes in volume. . . . 32 2.10 Representation of the main sets of veins in the cerebral circulation. It can be
noticed the two families of jugular veins: the internal (IJV) and external (EJV) 33 2.11 Pattern of jugular venous pressure (JVP) . . . 34 2.12 Illustration of the cerebral venous outflow pathways primarily via the internal
jugular veins in the supine position (left) and the venous plexus in theupright position (right). . . 35 2.13 Illustration of the cerebral venous outflow pathways primarily via the internal
jugular veins in the supine position (left) and the venous plexus in the upright position (right).. . . 36 2.14 Simulation results of vertebral venous plexus flow and jugular segment flow and
volume, in supine and standing Valsava manoeuvres using an experimental data set of 10 healthy subjects. . . . . . 37
viii
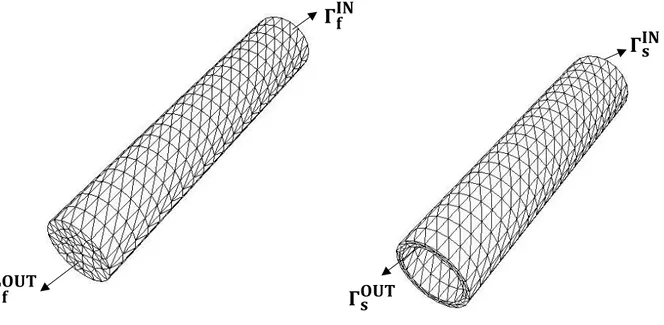
3.1 Cerebral venous network. The two vertical vessels are virtual exit veins since the work of Miraucourt [34] does not take into account the couple of internal jugular veins. . . 42 3.2 Representation of the fluid (left) and structure (right) domains. The fluid domain
here illustrated is that of an IJV reconstructed from CT images. The structure domain has been obtained by extrusion of the fluid one. . . .
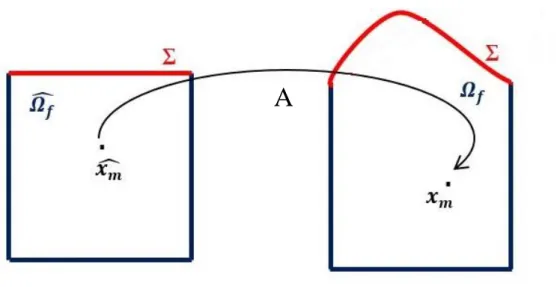
45 3.3 Schematic representation of the fluid mesh displacement problem. (Left) Fluid
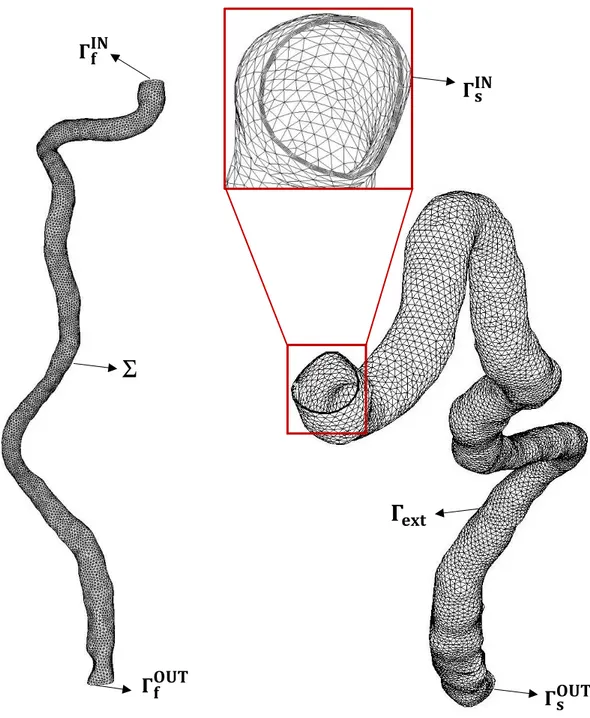
mesh at rest. (Right) Fluid mesh in the current configuration. . . . . . . 47 4.1 (Left) Cylinder fluid mesh (F_CYL); (Right) Cylinder solid mesh (S_CYL). . . 63 4.2 (Left) IJV_PATIENT_I fluid mesh (F_IJV_PATIENT_I); (Right)
IJV_PATIENT_I solid mesh (S_IJV_PATIENT_I). In the zoom the 3 layers of the solid mesh are highlighted. . . 64 4.3 (Left) IJV_PATIENT_II fluid mesh (F_IJV_PATIENT_II); (Right)
IJV_PATIENT_II solid mesh (S_IJV_PATIENT_II). In the zoom the 3 layers of the solid mesh are highlighted. . . 65 4.4 Schematic representation of the standing up configuration . . . . . . 68 4.5 Flow rate prescribed at the inlet of internal jugular vein (IJV). . . . . . 70 4.6 (Left) Detail of the fluid inlet section (𝛤𝑓𝐼𝑁) of IJV_PATIENT_I and the
inscribed circumference of radius 1.7 mm. (Right) Detail of the fluid inlet section (𝛤𝑓𝐼𝑁) of IJV_PATIENT_II and the inscribed circumference of radius
2.1 mm. . . . . . 71 4.7 Computational fluid domain for the CYL_absorbing_condition and
CYL_zero_pressure simulations. The two horizontal lines represent the two sections (𝛤𝐴,𝐶𝑌𝐿 and 𝛤𝐵,𝐶𝑌𝐿) where the average pressure has been measured. . . . 76 4.8 Average pressure in time on 𝛤𝐴,𝐶𝑌𝐿 of CYL_absorbing_condition (dashed line)
and of CYL_zero_pressure_condition (continue line). . . . . . 76 4.9 Average pressure in time on 𝛤𝐵,𝐶𝑌𝐿 of CYL_absorbing_condition (dashed line)
and of CYL_zero_pressure_condition (continue line). . . . . . 77 4.10 Average pressure in time on 𝛤𝐴,𝐶𝑌𝐿 for CYL_zero_pressure_condition(Top) and
CYL_absorbing_condition (Bottom) considering CASE_A and CASE_B. . . . .
78-79 4.11 Average pressure on 𝛤𝐴,𝐶𝑌𝐿 of CYL_supine (red), CYL_standing_up (blue),
CYL_orthostatic (black). . . 81 4.12 Average pressure on 𝛤𝐵,𝐶𝑌𝐿 of CYL_supine (red), CYL_standing_up (blue),
CYL_orthostatic (black). . . 82 4.13 Average pressure on 𝛤𝐴,𝐶𝑌𝐿 (blue) and on 𝛤𝐵,𝐶𝑌𝐿 (green) of CYL_standing_up.
ix
4.14 Average pressure on 𝛤𝐴,𝐶𝑌𝐿 (blue) and on 𝛤𝐵,𝐶𝑌𝐿 (green) of CYL_supine. The
black dashed line represents the flow rate in time. . . . . . . 83 4.15 Velocity streamlines of CYL_supine (left), CYL_standing_up (center),
CYL_orthostatic (right) at PEAK OF COLLAPSE (Top), SYSTOLE (Middle) and DIASTOLE (Bottom). . . . . . 85 4.16 Variation of 𝛤𝐴,𝐶𝑌𝐿 area of CYL_supine (red), CYL_standing_up (blue),
CYL_orthostatic (black). The dashed orange line represents the area at rest (A0). 86 4.17 Variation of 𝛤𝐵,𝐶𝑌𝐿 area of CYL_supine (red), CYL_standing_up (blue),
CYL_orthostatic (black). The dashed orange line represents the area at rest . . . 87 4.18 Computational fluid domain for the IJV_PATIENT_I (left) and
IJV_PATIENT_II simulations. The horizontal lines identify the sections 𝛤𝐴,𝐼𝐽𝑉_1 , 𝛤𝐵,𝐼𝐽𝑉_1, 𝛤𝐴,𝐼𝐽𝑉_2 and 𝛤𝐵,𝐼𝐽𝑉_2. . . . . . 89 4.19 (Top) Average pressure on 𝛤𝐴,𝐼𝐽𝑉_1 of IJV_I_supine (red), IJV_I_standing_up
(blue), IJV_I_orthostatic (black). (Bottom) Average pressure on 𝛤𝐴,𝐼𝐽𝑉_2 of IJV_II_supine (red), IJV_II_standing_up (blue), IJV_II_orthostatic (black). . . . 90 4.20 (Top) Average pressure on 𝛤𝐵,𝐼𝐽𝑉_1 of IJV_I_supine (red), IJV_I_standing_up
(blue), IJV_I_orthostatic (black). (Bottom) Average pressure on 𝛤𝐵,𝐼𝐽𝑉_2 of
IJV_II_supine (red), IJV_II_standing_up (blue), IJV_II_orthostatic (black). . . . 91 4.21 (Top) Average pressure on 𝛤𝐴,𝐼𝐽𝑉_1 (blue) and on 𝛤𝐵,𝐼𝐽𝑉_1 (green) sections of
IJV_I_standing_up. (Bottom) Average pressure on 𝛤𝐴,𝐼𝐽𝑉_2 (blue) and on 𝛤𝐵,𝐼𝐽𝑉_2 (green) sections of IJV_II_standing_up. In both graphs the black dashed lines represent the gravitational force. . . . . . 92 4.22 (Top) Average pressure on 𝛤𝐴,𝐼𝐽𝑉_1 (blue) and on 𝛤𝐵,𝐼𝐽𝑉_1 (green) sections of
IJV_I_supine. (Bottom) Average pressure on 𝛤𝐴,𝐼𝐽𝑉_2 (blue) and on 𝛤𝐵,𝐼𝐽𝑉_2
(green) sections of IJV_II_supine. In both graphs the black dashed lines represent the gravitational force. . . 93 4.23 Velocity streamlines of IJV_I_supine (left), IJV_I _standing_up (center IJV_I
_orthostatic (right) at PEAK OF COLLAPSE (Top), SYSTOLE (Middle) and DIASTOLE (Bottom). . . . 95
4.24 Velocity streamlines of IJV_II_supine (left), IJV_II _standing_up (center) IJV_II _orthostatic (right) at PEAK OF COLLAPSE (Top), SYSTOLE (Middle) and DIASTOLE (Bottom). . . . . . . 96 4.25 (Top) Variation of 𝛤𝐴,𝐼𝐽𝑉_1 area of IJV_I_supine (red), IJV_I_standing_up
(blue), IJV_I_orthostatic (black). (Bottom) Variation of 𝛤𝐴,𝐼𝐽𝑉_2 area of
IJV_II_supine (red), IJV_II_standing_up (blue), IJV_II_orthostatic (black). . . . 98 4.26 (Top) Variation of 𝛤𝐵,𝐼𝐽𝑉_1 area of IJV_I_supine (red), IJV_I_standing_up
(blue), IJV_I_orthostatic (black). (Bottom) Variation of 𝛤𝐵,𝐼𝐽𝑉_2 area of
x
4.27 (Left) Wall displacements responsible for collapse in IJV_I_orthostatic at the peak of collapse (0.062s). (Right) Wall displacements responsible for collapse in IJV_II_orthostatic at the peak of collapse (0.062s). In both plots the grey regions identify the portion of vein subjected to extension. . . 100 4.28 (Left) Wall displacements in IJV_I_supine at the systolic peak (t = 0.25 s).
(Right) Wall displacements in IJV_II_supine at the systolic peak (t = 0.25 s). . . 100 4.29 (Top) Representation of the WSS distribution at t=0.062 s in IJV_I_supine (left),
IJV_I_standing_up (centre) and IJV_I_orthostatic (right). (Botton) Representation of the WSS distribution at t=0.062 s in IJV_II_supine (left), IJV_II_standing_up (centre), IJV_II_orthostatic (right). . . . . . 101 4.30 (Top) Representation of the WSS distribution at t=0.25 s in IJV_I_supine (left),
IJV_I_standing_up (centre) and IJV_I_orthostatic (right). (Botton) Representation of the WSS distribution at t=0.25 s in IJV_II_supine (left), IJV_II_standing_up (centre), IJV_II_orthostatic (right). . . . . . 102 4.31 (Top) Velocity streamlines at the systolic peak in the sigmoid sinus of
IJV_PATIENT_I (left) and IJV_PATIENT_II (right). (Top) Velocity streamlines at the systolic peak in the sigmoid sinus of IJV_PATIENT_I (left) and IJV_PATIENT_II (right). . . . . . 106
xi
List of Tables
4.1 Number of tetrahedra and vertices of the cylinder fluid mesh (F_CYL) and the cylinder solid mesh (S_CYL). . . 63 4.2 Number of tetrahedra and vertices of the IJV_PATIENT_I fluid mesh
(F_IJV_PATIENT_I) and IJV_PATIENT_I solid mesh (S_IJV_PATIENT_I). . 64 4.3 Number of tetrahedra and vertices of the IJV_PATIENT_II fluid mesh
(F_IJV_PATIENT_II) and IJV_PATIENT_II solid mesh (S_IJV_PATIENT_II). . . . . . 65 4.4 Diameter, cross-sectional area, length and thickness of the reconstructed IJV of
PATIENT_I and PATIENT_II . . . . . . 66 4.5 Physical parameters used for simulations of both IJVs and cylinder. . . 74 4.6 Values of 𝜎𝑓 and 𝜎𝑠 used in the simulations. . . 74 4.7 Values of RR iterations and computational time required for CYL_supine,
CYL_standing_up and CYL_orthostatic . . . 80 4.8 Values of RR iterations and computational time required for
IJV_PATIENT_I_supine, IJV_PATIENT_I _standing_up, IJV_PATIENT_I _orthostatic, IJV_PATIENT_I_supine, IJV_PATIENT_II _standing_up and IJV_PATIENT_II _orthostatic. . . 88 4.9 Values of the mean pressure at the systolic peak on ΓA,IJV and ΓB,IJV of
IJV_PATIENT_I and IJV_PATIENT_II. . . 103 4.10 Values of the mean pressure at the peak of collapse on ΓA,IJV and ΓB,IJV of
IJV_PATIENT_I and IJV_PATIENT_II. . . . . . 104 4.11 Variations of fluid sections area ΓA,IJV and ΓB,IJV at the systolic peak measured
in IJV_PATIENT_I and IJV_PATIENT_II. . . . . . 104 4.12 Variations of fluid sections area ΓA,IJV and ΓB,IJV at the peak of collapse
measured in IJV_PATIENT_I and IJV_PATIENT_II. . . 105 4.13 Comparison between angles 𝜃 responsible for collapse in the standing up
position in IJV_PATIENT_I and IJV_PATIENT_II. . . 105 4.14 Comparison between velocity values at the systole and diastole in [56],
IJV_PATIENT and IJV_PATIENT_II. . . . . . 107 4.15 Comparison between Reynolds numbers at the systolic peak at the inlet of
IJV_PATIENT_I and IJV_PATIENT_II. . . 107
xii
Abstract
Background and purpose. The venous system is a large net of vessels characterized by low
values of pressure and velocity. Veins’ behavior is highly influenced by the presence of the gravitational force, indeed in the orthostatic position the major contribution of venous pressure is given by the hydrostatic pressure.
The internal jugular vein (IJV) is a paired vessel which originates at the level of the sigmoid sinus and travels down in the neck joining, at the end, the superior vena cava. Its major function is to carry oxygen-depleted blood from the brain and transport it to the heart. In the supine position (absence of gravity) the IJV represents the major and primary cerebral venous outflow pathway but moving to the orthostatic position (full presence of gravity) it undergoes to partial collapse generating alternative pathways for the drainage.
During the last years there have been an increasing interest in the physiology of cerebral venous return, (acted by IJV), due to the possible potential link between extracranial venous anomalies and neurological conditions.
In this context, the aim of this thesis is to provide a quantitative analysis of the collapse phenomenon in two IJVs subjected to the action of gravity through 3D fluid structure interaction (FSI) simulations. The first part of the work has been dedicated to the investigation of the problem through the use of a simple geometry (cylinder) and later the physiological case using real geometries has been studied.
Materials and methods. Fluid structure simulations based on the Finite Elements Method
(FEM) were performed with patient-specific geometries and boundary conditions. Two right internal jugular veins (IJVs) were reconstructed from MRI and CT images.
At the inlet of each IJV a parabolic velocity profile was prescribed in order to guarantee an appropriate flow rate at each time-step, while at the outlet an absorbing boundary condition was applied in order to avoid spurious reflection phenomena.
A preliminary numerical study was performed in order to understand the role of the absorbing boundary condition in presence of gravity performing a comparison with a homogeneous Neumann condition.
xiii
The FSI problem was solved using the Robin-Robin algorithm: an implicit partitioned scheme. Thus, the fluid and solid problems were solved separately, however satisfying the interface conditions.
In the numerical simulations, the blood was considered as a homogeneous incompressible Newtonian fluid, and it was described by the Navier-Stokes equations. The wall vessel was modeled with a linear Hookean law.
The FSI studies were performed in an idealized geometry (cylinder) and in two real IJVs simulating three and one cardiac cycles, respectively.
In order to investigate the role played by gravitational force three different posture scenarios were analyzed: the supine (absence of gravity), the orthostatic (full presence of gravity) and the standing up (an intermediate step where the subject moves from supine to orthostatic with constant angular velocity).
Quantitative changes in pressure patterns, velocity streamlines, wall displacements and WSS were analyzed in the three positions.
Results. The analysis of pressure patterns highlights a collapse phenomenon at the inlet
regions of both IJVs in the orthostatic position with peaks of pressure of the order of -11/-5 mmHg. At the collapse wall displacements of the order of 4∙ 10−3 cm with a reduction of
3%-5% of the rest area can be observed. Unlike the inlet region, the outlet regions of both IJVs never undergo to collapse independently of the posture.
In the supine position no collapse phenomena occur, showing positive values of pressure in both IJVs.
In the standing up position only one IJV undergoes to collapse with values of gravitational force greater than 600 cm/s2 corresponding to an angle 𝜃 =50°.
The study of velocity streamlines highlights no particular differences in the three different postures. The maximum values of velocity (59-51 cm/s) are reached at the systolic peak in the sigmoid sinus; at the same time instant the velocity in the outlet region of both IJVs don’t exceed the 25 cm/s showing a great agreement with values found in the literature. At the systolic peak, the WSS reaches its maximum (4 Pa) in the region of the sigmoid sinus.
Conclusions. This study allowed a quantitative evaluation of the collapse phenomenon in
xiv
of pressure values and wall displacements the entity of collapse in the IJVs. Although both IJVs undergo to collapse in the orthostatic position, some differences can be noticed in the two veins. A possible reason of these different behaviors can be found in the different geometrical features that characterize the two vessels.
xv
Sommario
Introduzione e obiettivo. Il sistema venoso è costituito da una rete di vasi caratterizzati da
bassi valori di pressione e velocità. La fisiologia venosa è altamente influenzata dalla forza gravitazionale, infatti in posizione ortostatica il principale contributo della pressione venosa è dato dalla pressione idrostatica.
Le vene giugulari interne sono vene che originano a livello del seno sigmoidale (cranio), percorrono il tratto del collo e si congiungono con la vena cava superiore.
La principale funzione della vena giugulare interna è quella di trasportare sangue povero di ossigeno dai tessuti cerebrali al cuore. Nella posizione supina (assenza di gravità), la vena giugulare interna rappresenta la principale via di drenaggio del sangue cerebrale ma muovendosi nella posizione ortostatica (totale presenza di gravità) è soggetta a un parziale collasso dando luce quindi a percorsi alternativi di drenaggio.
Negli ultimi anni si è assistito a un crescente interesse nella fisiologia del ritorno venoso cerebrale (attutato dalle giugulari interne) per possibili relazioni tra anomalie venose extracraniali e condizioni patologiche neurologiche.
In un tale contesto, l’obiettivo di questa tesi è quello di fornire un’analisi quantitativa del collasso venoso della vena giugulare interna soggetta all’azione della gravità attraverso simulazioni fluido struttura 3D. La prima parte dello studio è dedicata all’analisi del problema attraverso l’utilizzo di una geometria ideale (cilindro) mentre nella seconda parte è affrontato il caso fisiologico utilizzando geometrie reali di giugulari interne.
Materiali e metodi. Le simulazioni fluido struttura basate sul metodo degli Elementi Finiti
sono state eseguite su geometrie reali utilizzando opportune condizioni al bordo. Due vene giugulari interne sono state ricostruite da immagini MRI e CT.
All’ingresso di ogni giugulare è stato imposto un profilo di velocità parabolico garantendo in questo modo un opportuno flusso sanguigno ad ogni istante temporale, mentre sulla sezione di uscita è stata utilizzata una condizione assorbente al fine di evitare fenomeni di riflessione.
Al fine di comprendere il ruolo della condizione assorbente in presenza di gravità è stato eseguito un confronto con una condizione di Neumann omogenea.
xvi
Il problema fluido-struttura è stato risolto utilizzando l’algoritmo Robin-Robin: uno schema implicito partizionato, soddisfando comunque la condizione di interfaccia.
Nelle simulazioni numeriche, il sangue è stato considerato come un fluido omogeneo, Newtoniano e incomprimibile descritto dalle equazioni di Navier-Stokes. La parete del vaso è stata descritta con una legge elastica lineare.
Le simulazioni FSI sono state eseguite su una geometria ideale (cilindro) e su due giugulari interne reali simulando rispettivamente tre e un ciclo cardiaco.
Al fine di studiare il ruolo della forza gravitazionale tre diverse posture sono state simulate: la supina (assenza di gravità), l’ortostatica (totale presenza di gravità) e la standing up (una posizione intermedia dove il soggetto si muove dalla posizione supina a quella ortostatica con velocità angolare costante).
Nelle diverse simulazioni sono stati studiati i cambiamenti di pressione, di velocità, di spostamento della parete e di WSS (wall shear stress).
Risultati. L’analisi dei pattern di pressione ha evidenziato il fenomeno di collasso nella
regione di ingresso in entrambe le giugulari in posizione ortostatica con picchi di pressione dell’ordine di -11/-5 mmHg. Al collasso spostamenti della parete dell’ordine di of 4∙ 10−3
cm con una riduzione del 3%-5% dell’area della sezione sono stati osservati. Diversamente dalla regione di ingresso, in prossimità dell’uscita in entrambe le giugulari non si sono osservati fenomeni di collasso indipendentemente dalla postura osservata.
Nella posizione supina in entrambe le giugulari non sono stati rivelati fenomeni di collasso, la pressione in quest’ultimo caso è sempre rimasta positiva.
Nella posizione di standing up solo una delle due giugulari è collassata con valori di forza gravitazionale pari a 600 cm/s2 corrispondente ad un angolo 𝜃 =50°.
Lo studio delle streamlines di velocità non ha evidenziato particolari differenze nelle tre diverse posture. Il massimo valore di velocità (59-51 cm/s) è stato raggiunto al picco sistolico nel seno sigmoidale. Allo stesso istante temporale la velocità nella regione di uscita della giugulare non ha superato i 25 cm/s, mosrando un forte accordo con i valori trovati in letteratura.
Al picco sistolico il WSS ha raggiunto il suo massimo (4 Pa) nella regione del seno sigmoidale.
xvii
Conclusioni. Questo studio ha permesso una valutazione quantitative del fenomeno di
collasso in due vene giugulari interne soggette alla forza gravitazionale. In particolare questa analisi ha permesso di quantificare in termini di pressione e spostamento della parete l’entità del collasso. Sebbene entrambe le vene collassino nella posizione ortostatica, alcune differenze possono essere notate nelle due vene. Una possibile spiegazione a questo comportamento può essere trovato nelle diverse caratteristiche geometriche che caratterizzano i due vasi analizzati.
18
Chapter 1
Introduction
Contents
1.1 The role of posture in internal jugular veins
The internal jugular veins are a paired vessel which born at the level of the sigmoid sinus in the cranium, their function is to drain blood from brain, face and neck towards the heart [58,62,53].
It is well known that veins’ behavior is strong influenced by the presence of gravitational force, indeed in standing position the major contribution of venous pressure is given by the hydrostatic pressure [41].
In the supine position (absence of gravity) the IJVs represent the major and primary cerebral venous outflow pathway but moving to the orthostatic position (full presence of gravity) they undergo to partial collapse generating alternative pathways for the drainage [15]. Although this behavior is well known [56,73,14,67], the literature is scarce of modeling and numerical studies that provide a quantification of this phenomenon. A possible reason of this behavior is the low clinical interest in the venous system that has characterized the past [36]. However, during the last years there have been an increasing interest in the physiology of cerebral venous return due to the possible potential link between extracranial venous anomalies and neurological conditions [72,71], a prominent example is Chronic CerebroSpinalVenous Insuffiency (CCSVI)[2,59].
In a contest like this one, the IJVs play a key role and an accurate quantitative investigation of their behaviour “posture-dependant” is necessary.
1.1 The role of posture in internal jugular veins ... 18 1.2 Computational haemodinamics ... 19 1.3 Objective ... 20
1.2 Computational haemodinamics
Nowadays there is a growing interest in developing mathematical and computational models applied to the cardiovascular apparatus, mainly motivated by the fact that numerical models represent a noninvasive, fast and cheap tool to perform accurate quantitative investigations. We are in the era of “personalized” and “predictive” medicine where the main goals are performing tools and methods that will be able to predict pathological situations and provide a self-patient therapy [65,44]. In a contest like this one, computational haemodynamics, with the help of imaging techniques such as MRI and CT, plays a big role in the medical contest providing simulations of physiological and pathological situations with real 3D geometries. Literature is rich of mathematical studies in the cardiovascular system preferred the arteriosus side rather than the venous one. A possible reason of this choice can be found in the high impact that cardiovascular diseases have on the population in the industrialized society (around 40 % of deaths). Numerical methods and computational fluid dynamic (CFD) allows to perform quantitative studies on physical quantities like shear stress which are troublesome, if not impossible, to measure in vivo.
Recent years have seen a change in tendency and more and more scientist started to look at the venous system with curiosity. This net of vessels, for too much time neglected, presents peculiar features like: to be subjected at low gradient of pressure, to be very sensitive at gravity and to change shape depending on the posture.
1.3 Objective
The aim of this thesis is to provide, by means of numerical simulations, a quantitative analysis of the collapse phenomenon in two IJVs subjected to the action of gravity through 3D fluid structure interaction (FSI) simulations.
The first part of the work has been dedicated to the interpretation of the problem through the use of a simple geometry (cylinder) and later the physiological case using real geometries obtained through the geometrical reconstruction of MRI images and CT scans has been studied.
21
Chapter 2
The Venous System
Contents
2.1 Physiology and pathologies of venous system ... 21
2.2 Anatomy of vessel wall and valves ... 26
2.3 Venous haemodynamics and gravitational force ... 28
2.4 The internal jugular vein (IJV) ... 32
In this chapter, we provide a description of the essential aspects that characterize the venous system favoring the family of jugular veins (Section 2.4). Sections 2.1 and 2.2 are dedicated to a brief description of the veins physiology and anatomy of the systemic circulation taking into account some main pathologies. Section 2.3 addresses the hemodynamic problem with particular interest at the role of the gravitational force.
2.1 Physiology and pathologies of venous system
The aim of this section is to present a brief description of the main aspects that characterize the venous system and point out its critical aspects which can give rise to several pathologies. For a more detailed description the reader is referred to e.g [58] and [62].
The venous system is a large and complex net of veins that drains the blood from tissues to the right and left heart considering the circulatory and the pulmonary circulation respectively. (see Figure 2.1). Veins accommodate the 65% of the total blood that flows in our body and for this reason they are called as “capacitor vessels”.
The human venous system is made up of three main parts: the systemic, the pulmonary and the portal venous system.
The human systemic venous system refers to all the vessels that originate from a set of capillaries and drain the blood, abundant of carbon dioxide and waste substances, into the right atrium through superior and inferior vena cava [41]. The inferior vena cava is the largest venous segment of all the body with a length of 22 cm and a diameter of 30 mm, it is formed by the junction of the iliac veins at the level of L5 (fifth lumbar vertebra) and travels parallel to the aorta in the back-peritoneal space. Its task is to carry deoxygenated blood from the inferior part of the body (all tissues and organs that are under the diaphragm) towards the right side of the heart. The main tributaries of the inferior vena cava are: the parietal branch (lumbar and phrenic veins) and the visceral branch (renal, hepatic and genital veins). The superior vena cava is smaller than the inferior one (7 cm length). It arises from the union of brachiocephalic veins and receives blood from tissues above the diaphragm level (jugular and superior limb veins). (see Figure 2.1).
The pulmonary veins carry oxygenated blood from lungs to the left side of the heart and, with pulmonary arteries, generate the so called “heart lung circulation”. Its main function is take deoxygenated blood, pump it in lungs, recharge it of oxygen and nutritive substances and lastly, distribute it to organs and tissues. (see Figure 2.2).
Figure 2.2: Schematic representation of the heart-lung circulation. The deoxygenated blood (blue) is pumped by the right ventricle in the lungs where it becomes oxygenated blood (red) and it comes back through the pulmonary veins in the left ventricle.
The portal venous system refers to one or more veins that born from junctions of capillaries and pool in another capillary bed without going to the heart. This phenomenon takes place in organs such as liver (hepatic portal system) and hypophysys (hypophpyseal portal system) [53]. The main function of the venous system (systemic) is to lead back the deoxygenated blood from tissues to the right heart, which will pump it to the pulmonary circle where it will be recharged of oxygen. For this reason, it is necessary to consider the lungs as the interface between the arterious and venous circulation and think at the heart as a simple pumping system that allows to reach the tissue district where the gas exchange (oxygen and carbon dioxide) takes place.
Furthermore, other important venous functions are: preserve some pressure gradient suitable for proper tissue drainage, maintain an efficient thermoregulation and keep a suitable cardiac preload independently to the posture and the movement of the body [18].
The main requirement of the arterious system is to provide an adequate blood flow to the different body districts depending on their demand. On the other side, the venous system has to guarantee an appropriate blood outflow from the same body districts. Without this constant outflow, it would be not possible to maintain in the capillary district the right pressure to allow gas and metabolic exchange with tissues. It is well known for example that the flow between the plasma in the capillaries and the interstitial fluid is mainly driven by two gradients: the hydrostatic and the oncotic pressure. A poor venous outflow can generate a change in hydrostatic pressure resulting a loss of balance between the two previous forces causing several effects such as edema [8].
Venous insufficiency is a pathological condition caused by a difficult return of the blood to the heart, it includes a very wide category of diseases that affect the venous system such as: deep venous thrombosis (DVT), venous aneurisms and varicose veins. In order to understand the main features of these pathological conditions it is important to point out some critical aspects that characterized the physiology of veins.
Veins lie in a circle at low pressure and low velocity, their shape and dimensions are highly dependent on the transmural pressure (difference between the external and the intravasal pressure) and, apart from the veins that are over the level of the heart, the other ones work against the gravitational force: reason why the veins of lower limbs are equipped with valvulo-muscolar pump. The valvulo-muscolar pump ensures flow providing kinetic energy to the system through its systolic work, arranges for the fractionation of the hydrostatic
pressure column in the phase of muscular diastole and, thanks to the orientation of the valvular flaps, maintains the correct flow.
A loss of this equilibrium can cause pathologies such as the deep venous thrombosis (DVT): a condition in which the blood becomes stagnant in the valvular pouch generating little clots (see Figure 2.3). Another important role, strictly related to this, is played by hematologic factors (ipercoagulability). Although it is a very common pathology (it is estimated that affects 0.5% of males aged between 70 and 80 years old) it is at the same time very arduous to diagnose for its several ways of expression. A study performed by Lòpez et at. [32] try to create a solid and fluid mechanics model to understand how the formation of thrombi causes changes in fluid dynamic and behavior of the vessel wall.
Varicose veins are a pathological condition that affects the veins of lower limbs and consist of a deformation and an increase in volume of some segments of the vessels. Its etiology is very wide including congenital anomalies, post traumatic artero-venous fistula and not treated DVT. An epidemiologic study of some years ago [51] has shown that a key factor in the insurgence of varicose vein is the posture with a high correlation for people that stay in the orthostatic position for a lot of hours.
Even though the most common pathologies of the venous system are restricted to the lower limbs it is of equivalent interest focusing on the regions of venous system that are located over the level of the heart ascribed to the drainage of blood from the cerebral tissue to the heart.
Figure 2.3: Schematic representation of the alteration of the blood flow in vein with consequent creation of stagnant region and formation of embolus in deep venous thrombosis.
An improper working principle could provoke pathologies as the chronic cerebrospinal venous insufficiency (CCSVI) [72]. The CCSVI is a condition where people have obstructed the veins that drain the blood from central nervous system (the brain and the spinal cord). Patients with CCSVI show blockage of the veins generated by stenosis, abnormal valves, atresia, hypoplasia or agenesis [2]. Although there are several types of stenosis (e.g. collapse and twisting of the vein, ring-like narrowing), all are combined by an abnormal narrowing of the veins that restrict the blood flow.
The term CCSVI was coined in 2008 by Dr. Paolo Zamboni (University of Ferrara) who defined CCSVI as a pathological condition marked by the presence of several indicators, measured with ultrasonography, including the presence of reflux in the Internal Jugular Veins (IJVs). When the IJVs present some abnormal obstruction, the blood flow velocity is reduced and the drainage of cerebral blood is accomplished by the opening of collateral veins bypassing the obstacle. This phenomenon will cause an increase in lateral pressure, strain in the wall of IJVs, perfusion delay, reduction of catabolite drainage, and an intensive inflammatory activation of the small veins and the near tissues.
The main assumption of the theory of Dr. Zamboni is a possible correlation between CCSVI and multiple sclerosis (MS) [71,2,59]. For Dr. Zamboni stasis of blood in small venous vessels could be the initial cause of the generation of sclerotic plaques typical of the MS. This theory has been and continues to be at the center of a strong medical and clinical debate and its argumentations lies outside the objectives of this work.
In any case, the study of hemodynamics in the internal jugular veins is of great interest for the study of the venous system and of the corresponding pathologies.
This is the aim of the present study, where computational fluid-structure interaction models are considered.
2.2 Anatomy of vessel wall and valves
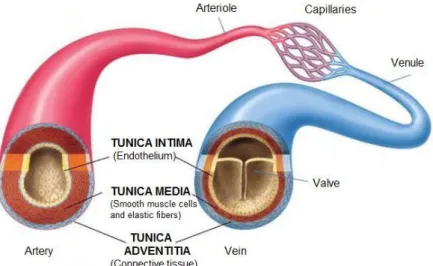
The veins are composed by three layers or tunicae: an inner, middle, and outer layer called, the tunica intima, the tunica media and the tunica adventitia respectively [50]. Unlike arteries, the veins show different mechanical behaviors depending on the region considered. (see Figure 2.4). Furthermore, even though both arteries and veins present the same cylindrical shape, the latter feature a larger diameter and thinner thickness than the arteries of the same districts.
The tunica intima is the innermost layer of a vein. It is made up of one layer of endothelial cells in direct contact with the blood flowing through the lumen. Its thickness is maintained constant in every type of veins independently of their location. In the propulsive veins, vessels of the venous system ascribed to the propulsion of the blood against gravity, the intima develops semilunar valves to avoid the reflux of blood.
The tunica media is made up of smooth muscle cells and elastic tissue. It lies between the tunica intima on the inside and the tunica adventitia on the outside. Differently from the arteries the veins present lower concentration of elastin (elastic tissue) and a higher level of muscle cells. This behavior can be particularly noticed in the propulsive veins.
The major difference between arteries and veins is the composition and structure of the tunica adventitia, also known as tunica externa. It is the outermost layer of blood vessel and
it is mainly composed by collagen. In the veins the ratio elastin/collagen is around 1/3 independently of the venous region considered, while in arteries it changes depending on the district. The tunica adventitia is thicker than the media and, in cavae veins, it is thicken by bands of smooth muscular tissues arranged in the longitudinal direction.
The main consequences of the prevalence of collagen are related to mechanical properties. The elastin is a structural protein with a very low elastic modulus (1 MPa), an elastic linear behavior, low hysteresis and modest relaxation. On the contrary, collagen presents a high response for moderate values of deformation, a modulus of elasticity three times higher than the elastin and a strong nonlinear trend. This last feature is determined by the progressive recruiting of its fibers. In addition, the elastin is responsible for the small deformation/strain while the collagen has a key asset in the large deformation/strain of the vein wall. [49] For all the aspects mentioned above the general mechanical behavior of veins can be well distinguished by that of the arteries. It is worth noting that (as shown in Figure 2.5), in the veins there is no a substantial difference between the maximum stress and deformation in the longitudinal and circumferential directions; on contrary, there is a significant discordant behavior for the elastic modulus: the longitudinal one is higher than the circumferential one. This last aspect, in a certain way opposite to the one of arteries, is a consequence of the different mode of operations of the two vessels. The veins lie in a low-pressure system and in order to avoid severe collapse caused by movements and change of postures they are subjected to an intense level of prestress in the longitudinal direction. Although the arteries recline in a circle at high pressure they present however a level of prestress lower than the ones present in the venous system.
Figure 2.5: Stress-Strain plot of 10 jugular veins. For each vessel, it has been considered a sample in longitudinal (thin line) and circumferential (thick line) direction [50].
2.3 Venous haemodynamics and gravitational force
The venous system is characterized by low pressures and velocities. The blood flow in veins can be assumed laminar and Newtonian everywhere independently of the region considered; regarding the last assumption contradictory points of view can be found (e.g. [49], [34]). Mean blood velocity reaches values equal to approximatively 0.05 cm/s in microvessels of cerebral venous drainage and does not exceed 10 cm/s (e.g. [57], [4], [33]); variation between 30 and 50 cm/s in the internal jugular vein are observed [56], however it is important to underline the highly variable topography of venous circulation that can lead to a very wide range of velocity and pressure values [3]. Pressure capacity of venous vessels depends on patient’s position, revealing the important role of position in central venous system (CVS). In cerebral sinus, venous pressure may be about +1 mmHg in the lying position and -3 mmHg in the up-right position [26].
The pressure regime in the venous trunk is determined by residuals of kinetic energy and potential energy. In order to comprehend more deeply the venous haemodynamic the introduction of two main concepts is required: the transmural and the hydrostatic pressure [41].
The hydrostatic pressure (gravitational energy) is determined by the weight of the liquid column contained in the system: the higher is the column and higher is be the hydrostatic pressure in terms of height of the column. Considering a body in the orthostatic position, the hydrostatic pressure at the top of the head is theoretically zero while, it takes values proportional to the height of the liquid column for each point between the head and the feet. In the living person, the point of “zero pressure” corresponds to the level of the right atrium, in the intercostal region along the sternal marginal line; all points over this level show negative hydrostatic pressure while positive values for the reaming regions.
Considering the supine and orthostatic position, it can be noticed a different behavior in terms of venous, arterious and hydrostatic pressure as shown in Figure 2.6. When the body is lied down the venous and arterial pressure result from the sum of the hydrostatic pressure and the residuals of kinetic energy generated by the action of the heart. Since the hydrostatic pressure in this last position is zero, the venous and the arterious pressure are approximately constant in every point of the body (see Figure 2.6-left).
In the orthostatic position, although the principle remains the same, venous and arterious pressures show different patterns. The value of both venous and arterial pressure result from the algebraic sum between kinetic and gravitational energy (hydrostatic pressure). This interaction could get negative values of venous pressure for regions over the point of “zero pressure” since kinetic energy is smaller than the gravitational one (which takes negative values as mentioned before).
This last phenomenon is not observed for points under the diaphragm because, even though the hydrostatic pressure is maintained greater than the dynamic one, both assume positive sign. In general, both venous and arterial pressure in the standing position are increased by a factor proportional to the height of the column of blood, between the considered point and the “zero pressure” level. This boost is particularly significant in the venous system, indeed, the major contribution of the venous pressure in the orthostatic position is given by the hydrostatic pressure. As shown in Figure 2.6 moving from supine to standing implicates an increase of approximately six fold the venous pressure at the foot level while no significant changes can be observed in the arterial side.
So far it has been taking into account only the physical quantities which act inside the vessels (hydrostatic and kinetic energy) neglecting what happens outside of them. It is well known
Figure 2.6: (Left) Values of arterial and venous pressure in the supine position. (Right) Values of arterial and venous pressure in the orthostatic position.
that, since vessels are surrounded by tissues, they are exposed to an external pressure; when this last is considered together with hydrostatic and kinetic the trans-mural pressure can be defined, see Figure 2.7. The trans-mural pressure expresses the difference between the intra and extra vessel pressure and it increases with the hydrostatic force. The main consequence of this is the generation of a compression stress on the vein wall proportional to the value of pressure in the tissues.
In physiological conditions, the trans-mural pressure, for venous regions that lie under the level of zero pressure, assumes low values for the supine position while it increases moving to the orthostatic one. When the subject is standing the hydrostatic pressure and so the trans-mural pressure reaches their maximum value causing a progressive distension of the vessel. Indeed, for upper venous districts, the behavior is exactly opposite. In the orthostatic position veins of the neck, as jugular veins, are marked out by negative values of hydrostatic pressure that corresponds to negative values of trans-mural pressure.
The main consequences of this last feature are the collapse of the vessels with negative value of venous pressure. Figure 2.8 shows the change of vein section moving from supine to
Figure 2.7: Schematic representation of the quantities that act on the vein vessel. The transmural pressure determines the grade of distension of the vein and it is defined as the difference between the intra and extra vessel pressure
standing for vessels over and under the point of zero pressure. The aim of the graphical representation is to point out the opposite behavior shown by the two families of veins. In supine posture, all veins present the same behavior: they are partially flatted as a consequence of the low values of pressure. On the contrary, they show a different behavior when moving in the standing position: veins over the heart proceed into a more collapsed stage while, the others one, experience a distension state: moving from flattened to cylindrical shape.
In the graph of Figure 2.9 is reported the relation between changes in pressure and venous volume of a lower limb. The plot shows that a minimal increase in transmural pressure for example from 0 to 15 mmHg, causes a large increase in venous volume up to 250%. It is worth noting that it exists a critical limit of distensibility: at high values of transmural pressure (60 mmHg) the change of it does not generate substantial variations of volume. This process coincides with a typical capacitive system, for that reason veins are considered as the capacitor vessels of cardiovascular system.
Figure 2.8: (Blue arrow) Change in shape of veins below the level of “zero pressure” moving from supine to orthostatic position. (Red arrow) Change in shape of veins over the level of “zero pressure” moving from supine to orthostatic position.
VEINS UNDER THE POINT OF ZERO-PRESSURE VEINS OVER THE POINT OF ZERO-PRESSURE
2.4 The internal jugular vein (IJV)
The internal jugular vein (IJV) is a paired vessel that drains blood from important body organs and parts, such as the brain, face and neck.
It originates at the level of sigmoid sinus and travels down in the neck near the trachea, beside the thyroid gland joining, at the end, the superior vena cava. Its major function is to carry oxygen-depleted blood from the brain and transport it to the heart. Because of its superficial location (near to the outside of the body), the IJV is quite susceptible to injury, trauma, or damage. It also lacks protection from strong structures, like bones or cartilages [43]. The family of jugular veins includes even the external jugular vein (EJV), a smaller vessel that runs parallel to the internal with similar task, see Figure 2.10.
The main peculiarity of EJV is that occasionally it presents a double structure as shows in the work of Snoj et al [61]. Both jugular veins are marked by the presence of pairs of valves placed about 2.5 cm above the termination of the vessel in the IJV while at the distance of 4
Figure 2.9: Relationship of venous volume to transmural pressure. At low pressures, veins are compliant and change shape easily to accommodate large increases in volume. At high pressures, they become stiff and cannot accommodate large changes in volume.
cm from clavicle in the EJV; their functions are to prevent regurgitation of blood and passage of injection from below upward.
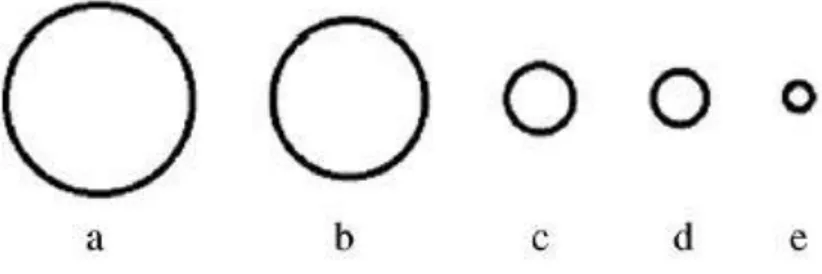
The IJV, as EJV, presents a very wide variation in terms of size, shape, or course in the Western population. A research of Bos et al [9] in 2015 underlines this last peculiarity focusing on the variability of diameter and cross-section area in the right and left internal jugular veins of 150 patients. The study shows a high range of variability in the diameter on both sides: left IJV 3.7-30.0 mm and right IJV 5.5-29.7 mm with median values of 13.7 mm and 16.1 mm respectively for the left (LIJV) and the right (RIJV) jugular veins. In addition, the authors provided a similar analysis for carotids vessel of the same patients and no substantial differences were found between the left and right side. An important aspect that is worth noting from [9] is the predominance (72% of patients) of RIJV over the LIJV in
Figure 2.10: Representation of the main sets of veins in the cerebral circulation. It can be noticed the two families of jugular veins: the internal (IJV) and external (EJV).
terms of diameter and cross section area, reason why cannulation of RIJV is preferable and less complicated than the LIJV, see Figure 2.11.
Cannulation, or catheterization, of IJV (especially the RIJV) is a practical clinical procedure used in medicine to measure jugular pressure or to administer fluids to carry medicine and nutrients when other peripheral vein lines are not available. Measurements of jugular venous pressure are used to evaluate the central venous pressure, which indicates how much blood is returning to the heart and how well the heart is pumping blood back into the arteries. Since the right heart and jugular veins are separated by a pair of valves, blood can flow back into the IJV when the pressure in the atrium is sufficiently high. The jugular venous pressure (JVP) is defined as the movement of expansion of the jugular vein due changes in pressure in right atrium and it provides valuable information to diagnose and/or prognosis many heart diseases [21]. The JVP pulse consists of three positive waves (a, c and v) and two descents, called, respectively x and y (see Figure 2.12). Wave a, synchronized with the P wave of ECG, corresponds to the atrial contraction, it is followed by x and c in relation to the closure of tricuspid valve; the third wave coincides with cardiac systole while the last one, wave y, represents the opening of tricuspid valve.
Figure 2.11: Mean cross-sectional area (CSA) of the right and left IJV and CSA of commonly used central venous catheters. (a) Median CSA RIJV corresponding to diameter of 13.5 mm. (b) Median CSA LIJV corresponding to diameter of 10.9 mm. (c) 14F catheter corresponding to diameter of 5 mm. (d) 12F catheter corresponding to diameter of 4.1 mm. (e) 12F catheter corresponding to diameter of 2.3 mm.
A research carried out by Sisini et al [60] demonstrates that the JVP regulates the IJV blood flow and that pressure waves are transmitted from the heart towards the brain through the IJV wall. Furthermore, it was pointed out the strong dependence of the instantaneous change in CSA of IJV during the cardiac cycle and the typical wave pattern of JVP.
The first study of the cerebral venous outflow pathway in relation to posture was provided by Holt et al. in 1941 [28]. In this paper, it was underlined that internal jugular veins are the major and primary cerebral venous outflow pathway only in the supine position. In sitting and standing position, the drainage of cerebral blood is performed by alternative pathways, via the vertebral venous plexus to the superior cava, as reported by Cirovic et al. [15]. This behavior is the result of a partially collapse of IJV caused by their location above heart level (point of “zero pressure) (see Figure 2.13).
On the basis of several studies performed by Zippel [73], Chaynes [14] and Toung [67] it can be affirmed that the pathway of the cerebral venous return is posture dependent. Although this area of study has been neglected and less thoroughly investigated than the arterial one in the past, in the recent years there has been a growing scientific interest in the physiology of cerebral venous return; particularly for the recent potential link discovered
between extracranial venous anomalies and neurological conditions [63]. A prominent example is Chronic Cerebrospinal Venous Insufficiency (CCSVI) and its possible connection to Multiple Sclerosis [71]. In a constest like this one there is the necessity to provide more deep study in the role of cerebral venous outflow and in particularly considering its dependency on the posture.
The research performed by Gisolf et al. [25], one of the few studies performed in this area, provided mathematical model of the cerebral venous outflow tract to study the distribution of cerebral blood flow to the IJV and to an alternative pathway.
They were able to reproduce the physiological drainage both in supine and orthostatic position through the choice of appropriate values of lumped parameters such as capacitors, resistances and inductances. In addition, it was considered and simulated the Valsava manovre as a procedure to re-opened the IJV in standing position. As it can be observed in Figure 2.14, in the supine position (on the left) the majority of the blood flows through the IJV and only a small part in venous plexus. On the contrary, in the standing position, after a first period (BL) during which IJV is collapsed, the Valsava manoeuvre re-opend the vessel and IJV returns to take the majority of the flow until the procedure is maintained.
Figure 2.13: Illustration of the cerebral venous outflow pathways primarily via the internal jugular veins in the supine position (left) and the venous plexus in the upright position (right).
Although that work neglects completely some critical aspects such as the real geometry of the system and the pulsatile nature of the JVP the results obtained can be considered an initial prominent point for future investigations.
Figure 2.14: Simulation results of vertebral venous plexus flow and jugular segment flow and volume, in supine and standing Valsava manoeuvres using an experimental data set of 10 healthy subjects.
38
Chapter 3
Mathematical and Numerical Methods
Contents
3.1 General assumptions ... 38 3.2 Modeling and Numerical choices in the literature ... 40 3.3 Mathematical modeling of the fluid structure interaction problem ... 43
3.3.1 The Navier Stokes Equations in a moving domain ... 44 3.3.2 Mechanical wall model ... 48 3.3.3 The coupled fluid structure interaction problem ... 50
3.4 Numerical discretization ... 52
3.4.1 The treatment of the geometric coupling and discretization in time ... 53 3.4.2 Numerical solution of the geometrically linearized fluid-structure interaction problem ... 55 3.4.3 Galerkin Approximation and Finite Element Method ... 56
3.1 General assumptions
In order to describe mathematically the blood flow in the internal jugular vein, some assumptions have to be made, regarding both the physical properties of the blood (i.e density and viscosity) and the physical problem itself (i.e flow regime, wall structure). These choices heavily influence the equations and the models that can be used and, although rigorously derived from physical assumptions, they have the purpose of simplifying, in relation to the specific objectives, the mathematical description of the problem.
In the context of this thesis, where internal jugular veins are considered (large medium size vessels), the following assumptions can be made:
• Homogeneous incompressible fluid. Blood is a body fluid that delivers necessary substances such as nutrients and oxygen to the cells and transports metabolic waste products away from those same cells. The average adult has a blood volume of 5 liters (7% of human body weight), which is composed of about 45% by volume of formed elements, or corpuscles, that are suspended in plasma (55%). For this reason, blood can be considered as a two-phase suspension of formed elements (red blood cells, white blood cells and platelets) in an aqueous solution (plasma). However, blood in large and medium size veins and arteries can be modeled as a homogeneous fluid (i.e. composed of a single phase), since the size of the formed elements is much
smaller than the vein caliber [34]. Moreover, the compressibility of blood, that is, the measure of the relative volume change (and, hence, density change) as a response to a pressure change, can be neglected. Thus, it is reasonable to assume a constant (in time and space) blood density of 1050 kg/m3.
• Newtonian fluid. In general, blood is considered as a non-Newtonian fluid, that is, a fluid in which the shear stress is not linearly proportional to the rate of shear. In particular, human blood exhibits a shear-thinning behavior [7]: at low shear rates, the apparent viscosity is high, whereas it decreases with increasing shear and approaches a minimum value of about 3.5 cP (1P = 10-3 Pa s) under high shear rates (i.e. greater than 100 s-1). Furthermore, viscosity of blood depends also on the diameter of the vessel: it has a very small value in small-diameter vessels and increases with the vessel diameter, approaching an asymptotic value at diameters larger than about 50µm. For these reasons, blood in jugular veins can be considered as a Newtonian fluid with constant viscosity of 3.5 cP. This choice is wellaccepted in literature even if there are some studies that prefer to model blood with a Casson law [52] obtaining results that are not so far from the Newtonian one [29].
• Laminar flow. The flow of blood in jugular veins can be modeled with a laminar model since the Reynolds number is always lower than 2000. This choice is highly adopted in literature even though it is important to point out that it is strictly patient dependent. The veins geometry, as underlined in Chapter 2, is highly variable in a population of patients; for this reason, cases may occur where the development of the jugular veins presents constrictions and curvatures with consequent high values of velocity. However, as a first study, laminar flow has been assumed avoiding the use of turbulence models or extremely fine space discretization or turbulence models maintaining, hence, reasonable computational costs.
• Fluid Structure Interaction.The walls of IJV will be not considered as rigid, indeed a fluid-structure interaction (FSI) modeling is considered. As mentioned in Chapter 2 veins behavior, unlike arteries, is gravity dependent: its presence, as in the orthostatic position, can cause events of collapse and partial occlusion. In order to study these phenomena, it has been necessary to provide simulations in which vessel wall, thus the vein structure, was free to move under the interaction with blood and
change shape depending on the simulating posture (e.g supine, orthostatic). FSI simulations allow to analyze displacement fields of vessel wall and understand how these can influence fluid dynamic quantities such as velocity and pressure. Adopting a rigid wall vessel model would have restricted this study on the fluid-dynamics solely, neglecting the key role played by the wall vessel.
In particular the wall vessel it has been modeled with a linear Hookean law. This choice is not completely in accordance with what happens in reality; it is well known that the elastic model cannot adequately address the mechanical properties of the IJV tissue, and only a hyperelastic (e.g. Mooney-Rivlin) material models of the vein wall can capture its mechanical features [29,30]. However, as a first study, the choice of an elastic model can be considered a big step forward to the so used rigid wall model to describe the haemodynamic problem. Thus, it has been assumed to model the structure behavior of IJV a Young modulus of 1.75 MPa [54,70] and a Poisson modulus of 0.49.
3.2 Modeling and Numerical choices in the literature
As mentioned in Chapter 2, so far the venous circulation has been rarely object of modeling and numerical investigations; on the contrary the literature is rich of computational studies for the arteries, focusing on large arterial vessels such as: aorta, carotids, coronaries and circle of Willis [23]. The main reason of this choice is strictly correlated with anatomical venous features such as: asymmetry, high variability between-subject architecture and behavior [56,63,38]. In addition at these physiological aspects, a big role is played even by the difficulty in detection and acquisition of clear medical images of the venous vasculature. Furthermore, as mentioned in Chapter 2, only recent years have been characterized by an increasing clinical interest in the venous system. The main consequence of these issues is the scarcity of numerical investigations based on real geometry of the venous districts. The few works present in the literature avoided the above critical points adopting reduced order models considering thus, either zero-dimensional (0D) lumped-parameter models, exploiting the electric circuit analogy for the circulatory system, or one-dimensional (1D) distributed parameter models, thereby dealing with large vasculature networks.
A research performed by Ursino et al. [68] in 1997, provided a simple 0D mathematical model that was able to simulate interaction between intracranial pressure (ICP), cerebral blood volume and autoregulation; in that study, the venous circulation was modeled using Starling resistors. This last choice is highly used in the literature, indeed a Starling Resistor is an experimental device in which a collapsible tube is connected to two rigid tubes at its extremities and located in a chamber of fixed volume with variable ambient pressure (Conrad,1996 [16]). The change of inlet, outlet and chamber pressure (often called external pressure) can causes collapse and flow limitation phenomena.
The adoption of Starling Resistors is even used by Toro et. al in some of his works [36,60]. In particular in [36] a closed-loop 1D model of the human circulation is provided, focusing on the cerebral venous blood flow; the role played by intracranial veins is considered the leading mechanism of all the cerebral drainage and their join with the dural sinuses is modeled with a set of Starling resistors. Furthermore, the description of blood flow in vessel wall is described by a system of non-linear, first order hyperbolic equations with the addition of a tube law that relates the pressure to the area.
The critical points of the adoption of a 1D model are the neglection of the real shape of the vessel, its geometrical features that vary in space, the mechanical properties of the wall vessel and its variable thickness. Furthermore, a 1D model study does not allow to perform a detailed fluid dynamic analysis taking into account for example the generation of secondary flow. Despite the limitations above mentioned, 1D studies can be a major starting point for forthcoming 3D works. Indeed, the computational results obtained in [60] show a good validation in terms of pressure and flow measurements with MRI-derived acquisition. A 1D model is adopted even in [60] where it is demonstrated that jugular venous pulse (JVP) regulates the IJV blood flow and the pressure waves are transmitted from the heart toward the brain through the IJV wall. Thanks to that preliminary study it has been possible to have information about the variation of the cross sectional area (CSA) of IJVs during the cardiac cycle focusing on the influence of JVP on it.
An advantage of 1D model is the restrained computational costs that allows to simulate entire circulation loop, on contrary this last aspect is determinant for 3D studies.
In order to overcome these critical aspects “hybrid” solutions can be taken into account; the latter consist in performing 3D models of a specific region and connect them with the remaining vasculature through 1D models. A similar approach was adopted by Caiazzo et
al. in 2015 [10] where a 3D blood flow simulation with rigid walls in the jugular vein coupled with a 1D model in major intracranial veins was performed and by Chabannes et al. in 2015 [13] where the coupling of a 3D model with a simplified three-elements Windkessel model was provided.
Another example of 3D modeling and simulation of cerebral venous system based on real geometry is provided by Miraucourt et al. [34]. The structure, shown in Figure 3.1, was obtained through reconstructions of images acquired by magnetic resonance angiography (MRA). The main limitations of that work are the neglection of the vessel wall displacements adopting a rigid wall model, model IJVs with 1D model and exclude body forces (e.g. gravity). However, that study provides relevant information in terms of pressure and velocity field in the fluid domain. In that work some well-accepted modeling assumptions have been done such as: considering blood flow as an incompressible, homogenous, isothermal and Newtonian fluid.
A similar choice has been adopted by Razaghi et al. [49], where, unlike the previous one, a 3D fluid structure interaction (FSI) study of healthy and varicose vein is performed using an idealized geometry (e.g. cylinder). In addition, in that study some important mechanical features are provided in terms of Young modulus, Poisson coefficients and mechanical wall model (hyperelastic Mooney-Rivlin law). The moving fluid domain was handled using the
Figure 3.1: Cerebral venous network. The two vertical vessels are virtual exit veins since the work of Miraucourt [34] does not take into account the couple of internal jugular veins.