POLITECNICO DI MILANO
Scuola di Architettura Urbanistica Ingegneria delle Costruzioni Corso di Pianificazione Urbana e Politiche Territoriali
Analysis of Urban mobility practices based on Big data:
An explorative study in Chengdu, China
Supervisors: Prof. Paola Pucci and Prof. Fabio Manfredini
Master Graduation Thesis by: Gao yuyao
Student number: 852118
Academic Year 2017/2018
ABSTRACT
Starting from the idea that mobility practices can be well acquired with Big data, and we explore citizens' mobility characteristics in Chengdu using digital data, in order to validate planning policies and theories. Firstly, this study will demonstrate the spatial-temporal characteristics of mobility practices based on Baidu heat map in the city scale. Then it explores urban functions and land use by POIs (Point of interests), which has a strong correlation with between mobility practices. Besides providing inspiration to research and plan in the field of practice mobility, this dissertation is also a valuable attempt for six applications of Big data approach to validate the urban policy and theory. The first application aims to inspect planning by superimposing urban facilities(expressed as POIs)to mobility practices derived by crowd source data in order to highlight vibrant commercial districts in Chengdu center. The second application analyzes land use around metro stations based on dynamic data from Baidu Heat Map. The third application uses digital data in two one-hour walking buffers to investigate the effects of mix land use to show urban mobility. The fourth application explains the reasons for the implementation of the latest purchase housing policy and its impacts on the study of “Jobs-Housing Balance” in central urban areas. In the fifth application, urban vibrant which expressed by means of gathering of people, activities of groups or individuals is observed on Mid-autumn Festival 2017 in Chengdu. In the last application, taking 20th Chengdu International Automobile Exhibition as a sample, we can investigate the variability of mobility practices during a Big event.
Abstract in Italiano
La tesi si interroga sulla efficacia dei Big data nel descrivere le pratiche di mobilità in un contesto specifico quale Chengdu, città nel sud-ovest della Cina, capoluogo della provincia del Sichuan, e su come tali dati possano essere utili a indirizzare le politiche urbane. In primo luogo, questa ricerca descriverà le caratteristiche spazio-temporali delle pratiche di mobilità basandosi su dati di traffico telefonico che restituiscono alla scala urbana le densità di presenze come “mappe di calore” (Baidu Baidu heat map ). Quindi esplorerà la distribuzione delle funzioni urbane e l'uso del territorio attraverso l’approccio POIs (punti di interesse) che ha una forte correlazione con le pratiche di mobilità. Oltre a fornire elementi utili per la ricerca e la pianificazione nel campo della mobilità, questa tesi propone anche sei applicazioni di Big data utili a orientare le politiche urbane nel campo sia della mobilità che degli usi del suolo. La prima applicazione ha lo scopo di verificare correlazioni tra presenza di attrattori e generatori di mobilità (desunti dall’approccio POIs) e mobilità, sovrapponendo le strutture urbane (espresse come POIs) alle densità di presenze desunte dai dati digitali, al fine di evidenziare la diversa vivacità dei quartieri urbani di Chengdu in diverse ore della giornata. La seconda applicazione analizza l'uso del territorio intorno alle stazioni della metropolitana sulla base di dati dinamici desunti dalla Baidu Heat Map. La terza applicazione utilizza i dati digitali in due diverse soglie temporali per indagare gli effetti del mix funzionale sulle pratiche di mobilità urbana. La quarta applicazione cerca di valutare l’impatto di una politica di sviluppo di residenza in ambiti prevalentemente terziario-commerciali (centro città) al fine di garantire "Job-Housing Balance". Nella quinta applicazione, si analizza la variabilità spazio temporale della densità di presenze durante un importante evento urbano quale il Mid-autumn Festival 2017 a Chengdu, mentre nell’ultima applicazione si utilizzano i dati digitali per restituire la variabilità delle pratiche di mobilità durante il 20 ° Salone Internazionale dell'Automobile di Chengdu.
Parole chiave: pratiche di mobilità, Big Data, Baidu “mappa di calore”, POIs (punti di interesse)
ACKNOWLEDGEMENT
I would like to express my deepest gratitude to my supervisors Prof. Paola Pucci and Prof. Fabio Manfredini for their full support, expert guidance, understanding and encouragement throughout my study and research. Without their incredibly patience and timely wisdom and counsel, my thesis work would have been a frustrating and overwhelming pursuit. Thanks also go to my fellow graduate students at the Department of Architecture and Urban Studies and staffs at Polimi. Special thanks go to my numerous friends who helped me throughout this academic exploration and with some specific problems. I would also like to thank the anonymous specialists on the Internet for their technical support. Finally, I would like to thank my family for their unconditional love and support during this two years; I would not have been able to complete this thesis without their continuous support and encouragement.
CHAPTER 1. INTRODUCTION
1.1 RESEARCH CONTEXT ... 1
1.1.1 Urban mobility practice: a big data drive analysis ... 1
1.2 RESEARCH QUESTIONS AND APPROACH ... 2
1.3 STRUCTURE OF THE RESEARCH ... 3
CHAPTER 2. MOBILITY PRACTICES IN URBAN RESEARCH
2.1 INTERPRETATION OF THE MOBILITY ... 52.2 MOBILITY AS AN ANALYTICAL TOOL ... 6
CHAPTER 3. BIG DATA TO DESCRIBE MOBILITY PRACTICES:
AN OVERVIEW IN THE LITERATURE
3.1 THE RISE OF BIG DATA ON URBAN STUDIES AND PLANNING ... 83.1.1 From “Small data” to “Big data” in urban research ... 9
3.2 CLASSIFICATION AND APPLICATION OF DIGITAL DATA IN MOBILITY PRACTICES 3.2.1 FOCUS ON FOUR ASPECTS IN THE STUDY OF MOBILITY PRACTICES THROUGH THE USE OF DIGITAL DATA ... 11
3.2.1.1 Individual commuting behavior ... 11
3.2.1.2 Transportation connections between different locations in cities ... 12
3.2.1.3 Jobs-housing sites and commuting corridors ... 12
3.2.1.4 Community structure ... 13
3.2.2 MOBILITY PRACTICES AND DIFFERENT DATA SOURCE ... 14
3.2.2.1 Mobile Phone data describing mobility practices ... 14
3.2.2.2 Floating car data describing mobility practices ... 14
3.2.2.3 Baidu Heat Map to describe mobility practices ... 15
3.3 LIMITATION OF THE USE OF BIG DATA APPROACH IN URBAN RESEARCH 3.3.1Validity and quality of data ... 17
3.3.2 Representativeness of data ... 17
CHAPTER 4. METHODOLOGY
4.1 QUESTIONS IN FOCUS ... 19
4.2 THE RELEVANCE OF THE CASE STUDY: CHENGDU IN CHINA ... 19
4.2.1.Urban spatial structure in Chengdu ... 20
4.2.2.Spatial distribution of economic activities ... 21
4.2.3.Transportation in Chengdu ...24
4.3 DATA SOURCE AND COLLECTION ... 26
4.3.1 Baidu Heat Map ... 26
4.3.2 POIs (Point of Interests) ... 28
4.3.3 Census data ... 29
4.4 ANALYSIS APPROACH ... 30
CHAPTER 5. DAILY MOBILITY PRACTICES IN CHENGDU FROM BAIDU
HEAT MAP
5.1 BSERVATION OF URBAN RHYTHMS IN A WORKDAY ... 315.1.1 Analysis of mobility practices from each hour ... 31
5.1.2 The Marco Scale: Geographical distribution of the population and the Monocentric urban structure Model ... 33
5.1.3 The Micro Scale Analysis and Its Relevance ... 33
5.2 OBSERVATION OF URBAN RHYTHMS PRACTICES DURING THE WEEKEND 5.2.1 Analysis of mobility practices from each hour ... 38
5.3 COMPARE AND CONCLUSION ... 41
CHAPTER 6. MOBILITY PRACTICES DISPLAY A CORRELATION WITH
POIs (POINTS OF INTEREST)
6.1 ANALYSIS THE DISTRIBUTION OF POIs ... 436.1.1 Basic information from raw data (points of interest) ... 43
6.1.2 Spatial distribution of pois ... 44
6.1.4 Kernel Density analysis ... 48
6.2 CORRELATION BETWEEN THESE DATASETS ... 49
6.2.1A strong correlation between Baidu heat map and POIs ... 50
6.2.2 Mobility practice show a correlation with POIs in the day ... 50
6.2.2.1 Mobility practices show a correlation with economic activities ... 50
6.2.2.2 Mobility practices show a correlation with other activities ... 51
6.2.3 Mobility practice show a correlation with POIs at night ... 53
6.2.4 Mobility practices show correlation with transportation facilities ... 54
CHAPTER 7.IMPLICATION FOR URBAN AND MOBILITY POLICY
7.1 APPICATION1: INSPECTION PLANNING AND IMPLEMENTATION GUIDANCE 55 7.1.1 Interpretation of the official plans ... 567.1.2 Identify Using status of commercial space through Baidu Heat Map ... 57
7.1.3 Identify the static service from POIs ... 61
7.1.4 Implementation guidance ... 63
7.2 APPLICATION2: ANALYSIS OF LAND USE AROUND METRO STATIONS ... 64
7.2.1 Identify the role of metro stations ... 64
7.2.2 Analysis of Station Usage from Baidu Heat Map ... 65
7.2.3 Analysis of land use from POIs ... 67
7.2.3.1 Identify urban functional area based on POIs data ... 67
7.2.3.1.1 Data Manipulation... 67
7.2.3.1.2 Identify the single functional and mixed functional area in Chengdu ... 69
7.2.3.1.2.1 Deep analysis of single functional area in Chengdu ... 70
7.2.3.1.2.2 Deep analysis of mixed functional area in Chengdu ... 71
7.2.3.4 Analysis of the land use around the metro stations ... 73
7.2.4 Conclusion ... 74
7.3 APPLICTION3: INVESTIGATE THE EFFECTS OF MIXED LAND USE ... 74 7.4 APPLICATION4: RESEARCH ON JOBS HOUSING BALANCE
IN CHENGDU CENTER ... 77
7.4.1 The origin of jobs housing research ... 77
7.4.2 The latest house purchase policy in Chengdu ... 77
7.4.3 Jobs housing balance research based on Baidu Heat Map ... 79
7.4.4 Thinking on Jobs housing balances: increase residential density ... 80
7.5 APPICATION5: MONITORING URBAN VITALITY ON 2017 MID-AUTUMN FESTIVAL IN CHENGDU ... 81
7.5.1 Urban vitality ... 81
7.5.2 Mobility Practices on 2017 Mid-Autumn Festival in Chengdu ... 81
7.6 APPICATION 6: OFFER GUIDE FOR A LARGE AND SPECIAL EVENT : learn from 2017 20th Chengdu International Automobile Exhibition ... 83
7.6.1 Mobility practices on 20th Chengdu International Automobile Exhibition ... 83
7.6.2 Learn from Mobility policy on 20th Chengdu Automobile Exhibition ... 85
CHAPTER 8.OPEN ISSUES AND CHALLENGES
8.1RESEARCH SUMMARY ... 868.2 DRAWBACK AND LIMITATION ... 88
8.2.1 Limitation by data source ... 88
8.2.2 Limitation by quantitative analysis ... 89
8.2.3 Further to be discussed ... 89
TABLES FIGURES REFERENCE ... 91
APPENDIX APPENDIX A.REPORT OF AVERAGE NEAREST NEIGHBOR ... 97
APPENDIX B. RECLASSIFICATION OF POIS FOR IDENTIFY THE URBAN FUNCTIONAL AREA (7.2) ... 105
TABLES
Table 2.1 Comparison between Traditional Data and big data ... 10
Table 5.1 The Summary of area with crowd gathered for each hour in a working day ... 34
Table 6.1 Classification of POIs ... 43
Table 6.2 Confidence level ... 46
Table 7.1 Summary of the popularity of the business district on one weekdays, one weekends and one public holidays ... 59
Table 7.2 Classification of POIs on Commercial activities ... 61
Table 7.3 Function-oriented classification for metro stations ... 65
Table 7.4 Summary the population density for each station ... 66
Table 7.5 Weigh coefficient for POIs ... 68
Table 7.6 Count of the number of single function cells ... 70
Table 7.7 Description for each mixed category ... 71
Table 7.8 Count of the number of mixed function cells ... 72
FIGURES
Chapter 3Figure 3.1 Connections between different stops in weekdays in Shenzhen ... 12
Figure 3.2 Job-housing balance in Chongqing and Beijing ... 13
Figure 3.3 Trip links at the TAZ (Traffic Analysis Zone) scale illustrating dominant commuting patterns in Beijing ... 13
Figure 3.4 Congested area in Shanghai center during different periods on working days ... 15
Figure 3.5 Congested area in Chengdu center during different periods on working days ... 15
Figure 3.6 Challenges in considering cloud computing ... 18
Chapter 4 Figure 4.1 Evolution of Urban spatial morphology in Chengdu ... 20
Figure 4.2 Master plan in Chengdu Center 2020 ... 20
Figure 4.3 Planning Area of Tianfu New District ... 21
Figure 4.4 The relationship between Tianfu New District Inner city center in Chengdu ... 22
Figure 4.5 The industrial space distribution during the Planned Economy period ... 23
Figure 4.6 The road network in Chengdu ... 24
Figure 4.7 Planning of metro lines in Chengdu ... 25
Figure 4.8 Baidu Heat Map ... 27
Figure 4.9 POIs on AMAP ... 28
Figure 4.10 Distribution of the people over 65 years old and the people younger 15 years old ... 29
Chapter 5
Figure 5.1 Baidu heat map in a workday from 7am to 11 pm ... 32
Figure 5.2 Size of area with different population density in a working day ... 32
Figure 5.3 Heat map on average population density on a working day ... 33
Figure 5.4 Mapping the selected urban situations in Chengdu Center ... 35
Figure 5.5 Population distribution on He Hua Chi , 7am-8 August ,2017
... 36
Figure 5.6 Average population density of South Axis from 8 am -7 pm,8 August ,2017
... 36
Figure 5.7 Average population density of Chunxi Road and Yanshikou from 8 am -10pm, 8 August ,2017
... 37
Figure 5.8 Population distribution on, Hua xi hospital, 9am-8 August ,2017
... 37
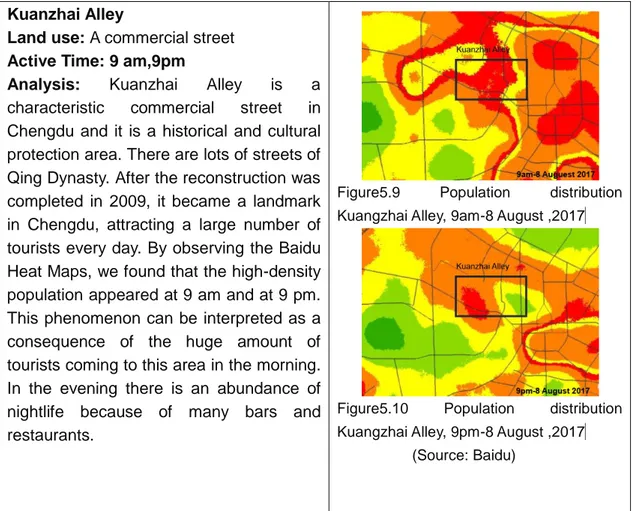
Figure 5.9 Population distribution Kuangzhai Alley, 9am-8 August ,2017 ... 38
Figure 5.10 Population distribution Kuangzhai Alley, 9pm-8 August ,2017
... 38
Figure 5.11 Baidu heat map during the weekend from 7am to 23 pm ... 39
Figure 5.12 Size of area with different population density during the weekend ... 39
Figure 5.13 Population distribution on 9am- 13 August, 2017 ... 40
Figure 5.14 Population distribution on 12am- 13 August, 2017 ... 40
Figure 5.15 Population distribution on 15pm- 13 August , 2017 ... 40
Figure 5.16 Population distribution on 19am-13 August , 2017 ... 40
Figure 5.17 Population distribution on 23pm-13 August , 2017 ... 41
Figure 5.18 Comparison on the average population density between weekdays and weekends ... 41
Chapter 6
Figure 6.1 Geographical of the of all urban facilities ... 45
Figure 6.2 Geographical distribution of the each category ... 45
Figure 6.3 HTML report of average nearest neighbor for all urban facilities ... 41
Figure 6.4 kernel Density Analysis for all urban facilities ... 47
Figure 6.5 kernel Density Analysis for each category ... 48
Figure 6.6 Correlation coefficient between Baidu Heat Map and POIs kernel Density ... 50
Figure 6.7 Comparison between map of average population density in day and POIs for economic activities ... 51
Figure 6.8 kernel Density for 4 economic clusters ... 51
Figure 6.9 Comparison between map of average population density in day and 5 categories of POIs ... 53
Figure 6.10 Comparison between Heat maps at night and POIs density for night activities ... 53
Figure 6.11 Heat map on average population density on a working day ... 54
Figure 6.12 kernel Density Analysis for transportation facilities ... 54
Chapter 7 Figure 7.1 Mind map for Application1 ... 55
Figure 7.2 Chengdu commercial network planning 2003-2020 ... 57
Figure 7.3 A heat map shows the average of population density on a workday ... 58
Figure 7.4 A heat map shows the average of population density on Sunday 13th August, 2017 ... 58
Figure 7.5 A heat map shows the average of population density on Mid-Autumn Festival 2017, October 4 ... 58
Figure 7.6 Commercial area with heightest population density based on a workday sample ... 62
Figure 7.7 Radar graph for the percentage of five functional activities in Chunxi Road ... 62
Figure 7.8 Radar graphs for the percentage of five functional activities in 8
commercial districts... 62
Figure 7.9 Mind map for Application2 ... 64
Figure 7.10 2339 grid cells in the Chengdu Center ... 67
Figure 7.11 Mind map for data manipulation ... 67
Figure 7.12 Single Function, Mixed Function area and No construction area in the Chengdu Center ... 69
Figure 7.13 Distribution of Single Function Area ... 70
Figure7.14 Distribution of Mixed Function Area in the Chengdu center ... 72
Figure7.15 Single Function, Mixed Function area and No construction in metro line 1 ... 73
Figure7.16 Single Function in metro line 1 ... 73
Figure7.17 Mind map for Application2 ... 74
Figure7.18 Practice Walking buffer in the old city center ... 75
Figure 7.19 Land use the old city center ... 75
Figure7.20 Heat map the old city center ... 75
Figure 7.21 Practice Walking buffer in the Tianfu New district ... 75
Figure 7.22 Land use in the Tianfu New district... 75
Figure7.23 Heat map in the Tianfu New district ... 75
Figure 7.24 Distribution of single function area in the 1 hour walking buffer... 75
Figure7.25 Mind map for Application4 ... 77
Figure 7.26 Research on Jobs housing balance in Chengdu center ... 80
Figure7.27 Mind map for Application5 ... 81
Figure 7.28 Comparison on the average of population between a working day and the Mid-Autumn Festival ... 82
Figure7.29:Mind map for Application5 ... 83
Figure 7.30 Comparison on area with highest population between a Big event and a working day ... 84
CHAPTER 1. INTRODUCTION
1.1 Research context
1.1.1 Urban mobility practices : a Big data drive analysis
With the development of the information technology, our life is changing dramatically by smart phones, the Internet and other information technologies, which have impact on urban society and space. Nowadays, each Internet user not just receives information, but also products it. In the 21st Century, the data in the virtual space is associated with the physical space. City planners can interpret cities from huge amounts of data, so as to analysis the planning theory and policy. With the popularity of mobile phones, mobile Internet has become an important source of Big data. Every user is involved in the delivery of information.
In the context of information technology revolution, with the development of Location Based Service (LBS) and Global Positioning System (GPS), technology has expanded the geographical space of human activities. Mobile phones can record people's activities very accurately, such as shopping, sports and entertainment. Mobility patterns can be recognized from personal dynamic behaviors. The data of virtual city is connected with the real city, and their interaction can promote the development of urban activity space and create rich materials for academic urban research. Geographers, architects and urban planners are trying to provide new perspectives for interpreting cities by exploring the connection between the virtual city and physical one.
A “digital skin” of city is coming into being (Chirag and Michael, 2014).
“The urban world is becoming a platform for generating data on the workings of human society, human interactions with the physical environment and manifold economic, political and social processes. The digital skin of city opens up many questions for urban theory and research.”---Chirag Rabaria and Michael Storper,2014
The “digital skin” of city based on Information Age is present offering strategy or analysis to the social, economical or political problems for the cities. Nowadays, sustainable planning pays more attention to the human and human activities. Park(1925),a scholar form Chicago School, introduced “Mobility is one of the main factors of ecological organization of the city”. Mobility can present both a fact-find tool and a policy tool for understanding the process of transforming the contemporary city (Pucci, 2014). Analysis of urban practices is difficult to achieve with the traditional method, Big data provides a huge number of individual mobility, so as to make an effective interpretation for mobile pattern.
- 2 -
By combining social and spatial theory, urban researchers can make a policy decision based on an analysis of mobility practices. With digital methods, people’s mobility pattern can demonstrated by Baidu Heat Map, so as to propose six applications to validate urban policies and theories.
1.2 Research questions and approach
Starting from the idea that mobility practices can be well acquired with Big data, and we explore citizens' mobility characteristics in Chengdu using digital data, in order to validate planning policies and theories. The case-study choice is Chengdu (China), which is the capital of Sichuan located in southwestern China.
According to the "Chengdu Chongqing Urban Agglomeration Development Plan" approved by the State Council in 2016, Chengdu has become the sixth National Central City after Beijing, Shanghai, Tianjin, Guangzhou and Chongqing. In terms of “the National Urban System planning (2006-2020)” reported by the former Ministry of Construction to the State Council in 2007, "National Center City” is interpreted as a financial center, a center of trade, management, and culture, and a transportation hub for China. The development of these cities will promote the export-oriented economy and strengthen international cultural exchange in China , so as to be characterized by a central city in China. The study of Chengdu is related to the development of the western region and even the whole country.
This study aims to check the validity and the effectiveness of Baidu heat map, digital data proved by Baidu, in describing spatial-temporal characteristics of mobility practices in the city scale.
According to this aim, the research explores urban functions and land use by POIs (Points of Interests), which has a strong correlation with mobility practices.
Besides providing inspiration to research and plan in the field of practice mobility, this dissertation is also a valuable attempt for six applications of Big data approach to validate the urban policy and theory. The first application aims to inspect planning by superimposing urban facilities (expressed as POIs)to mobility practices derived by crowd source data, in order to highlight vibrant commercial districts in Chengdu center. The second application analyzes land use around metro stations based on dynamic data from Baidu Heat Map. The third application uses digital data in two one-hour walking buffers to investigate the effects of mix land use to show urban mobility. The fourth application explains the reasons for the implementation of the latest purchase housing policy and its impacts on the study of “Jobs-Housing Balance” in central urban areas. In the fifth application, urban vibrant which expressed by means of gathering of people, activities of groups or individuals is observed on Mid-autumn Festival 2017 in Chengdu. In the last application, taking 20th Chengdu International Automobile Exhibition as a sample, we can investigate the variability of mobility practices during a Big event.
1.2 STRUCTURE OF THE RESEARCH
To address our research, this thesis is organized in 8 chapters.
Chapter1 includes this introduction, briefly glancing at the context of the research.
Chapter2 is organized in two parts: interpretation of mobility and mobility practices as an analytical tool. Firstly, the concept of mobilities as offered in social sciences opens to new perspectives and challenge also in the socio-economic of transport and in geography. Secondly, the mobility practices can be used as an analytical tool for describing space-time variability in the rhythms of the city. The efficiency of urban policy and mobility service depends on the ability to grasp mobility practices mobility which can highlight urban rhythms and in doing so also mobility demand .
Chapter3 focus on Big data dimension. Compared with traditional data, big data has many advantages, such as more acquisition modes, bigger data capacity and greater timeliness. That's why we can use big data to identify the complex mobility practices. This chapter is mainly composed by three parts. First, it introduces the emerging background of big data and its advantages. Secondly, it shows how Big data describes the mobility practices and it introduce classification and application of data in mobility practices. Finally, there is still some limitation of use of big data approach in mobility practices are introduced.
Chapter4 introduces the methodology used in this research and experimented in the
last three chapters. Besides, main dynamic and features of research scope will be introduced firstly. And then, there is an explanation of research question and all the data sourced used in this study. Finally, a brief introduction for the approach of the analysis will be described, with the aims to guide for next three chapters.
Chapter5 aims to explore the spatial-temporal characteristics of mobility practices by Baidu Heat Map in large scale which means Chengdu Center. As the first stage of research, with data caught from Baidu Map, this chapter will include two samples: working days and weekends and there is a result of comparison on these two scenarios.
Chapter6 analyzes the distribution of POIs (points of interest) and correlation study.
The static urban service will be demonstrated based on POIs in order to study the correlation between mobility practices and urban facilities. Firstly, this section introduces the basic information of the raw POI points obtained from AMAP. Besides, geographical distribution of each category will be analyzed respectively. Thirdly, with “spatial proximity tools “ in ARCGIS, Z-score and P-value are used to illustrate the confidence level for statistically significant clustered or not. And then, we propose to use a kernel Density Analysis for each category to show the degree of POIs
- 4 - service.
Chapter7 presents the applications based on Baidu heat map and POIs. The applications are finalized to show the effectiveness of digital data in describing different urban patterns and orienting planning policy. Six different applications are proposed for processing digital data, so as to validate their use. The first application aims to inspect planning by superimposing urban facilities(expressed as Point of interests, POIs)to mobility practices derived by crowd source data in order to highlight vibrant commercial districts in Chengdu center. The second application analyzes land use around metro stations based on dynamic data from Baidu Heat Map. The third application uses digital data in two one-hour walking buffers to investigate the effects of mix land use to show urban mobility. The fourth application explains the reasons for the implementation of the latest purchase housing policy and its impacts on the study of “Jobs-Housing Balance” in central urban areas. In the fifth application, urban vibrant which expressed by means of gathering of people, activities of groups or individuals is observed on Mid-autumn Festival 2017 in Chengdu. In the last application, taking 20th Chengdu International Automobile Exhibition as a sample, we can investigate the variability of mobility practices during a Big event.
Chapter8 summarizes the full research, mainly composed of two parts. The first part is a summary of the analysis results that the mobility practices found through Baidu heat map and land use based on POIs in the city of Chengdu. We proposed six applications of the research based on Big data and we discussed them. Secondly, we highlight some drawbacks and limitations existing in this work.
Chapter 2 MOBILITY PRACTICES IN URBAN RESEARCH
This chapter has two parts: interpretation of mobility and mobility practices as an analytical tool. Firstly, the concept of mobility originated from the social science and it was later explained in the socio-economic of transport and the geography. Secondly, the mobility practices can be used as an analytical tool. The efficiency of urban policy and mobility service can be increased in terms of practices mobility which can demonstrate urban rhythms and mobility demand .
2.1 Interpretation of Mobility
Before we interpret mobility, let us introduce the importance of mobility in the contemporary society. The mobility studied in this article is a kind of urban practices, in other worlds, urban rhythm which are “the coordinates through which inhabitants and visitors frame and order the urban experience”(Amin and Thrift 2002, p. 17). Mobility can help us to “read” city which is as an analysis tool (Kaufmann 2014). In the following explanation of movement, we begin with the concept of spatial mobility, involving social dimension of it. Then, the concept will shift from the “flows” to “derived demand” (Gallez and Kaufmann, 2009). Finally, mobility is associated with practices which can reflect the dynamic change in the city, so as to an analysis tool for urban researchers (Pucci 2014). Through screening the conception of mobility from three dimensions, such as social science, transportation and geography, we can better understand the conception of mobility and its significance in the contemporary society.
First, start with the origin of the concept of mobility. Mobility emerged form the social science, Sorokin(1927) mentioned the concepts of “social mobility”. He defines social mobility as “the phenomenon of movements of individuals in the social space”. According to his explanation, the mobility is not only the physical movement in the spaces, but also involves the change of social status or class. In term of the definition from Wikipedia, the interpretation of social mobility is similar.
Describing social mobility, Wikipedia writes:
“Social mobility is the movement of individuals, families, households, or other
categories of people within or between social strata in a society. It is a change in social status relative to one's current social location within a given society.”
Besides the social science, mobility is a social-spatial phenomenon. Mobility also defined in the transportation engineering. Mobility is as the flows from an origin to a destination firstly. In terms of Gallez and Kaufmann (2009), they shifted the concept from flow into “derived demand”. In the field of the transportation, from the “flows” to the notion of displacement, researchers are more concerned with the individual mobility in order to analyze the mobility demand. The individual mobility is closely related to the actual conditions, such as social-economic characteristics and home
- 6 -
Third, because "derived demand" is relative to some restrictive conditions, such as the means of transportation and the form of spatial organization, the mobility has the dynamic characteristic. Because the spatial-temporary change produce various mobility patterns, there is a concept of the “mobility biography” (Joachim Scheiner, 2007). Different mobility demand effect the different mobility patterns, so as to have “active biographies" (Nuvolati 2003, p. 71).
Fourthly, mobility is both relative the physical and social practices. Kaufmann (2002) propose a concept of mobility as:
“the intention and realization of an act of movement in physical space that involves social change”.
We need to pay attention to two keywords: physical space and social change. Cresswell (2006) proposed the role of mobility is as a “social product”. In another
worlds, the space-temporal mobility practices involves lots of social issues (Järv et al. 2014, p. 122).
In the context of Big data, with new data, such as mobile Phone data or floating car data, we can capture temporal variability for mobility through the real-time position, so as to analysis of social element behind it, such as urban rhythms or mobility practices. Nowadays, Big data can get the latitude and longitude information of the each users. We can “interpret” or “read” the city through accurate location information and statistics of the dynamic variability based on digital data.
2.2 Mobility as an analytical tool
Rhythms of the city are “the coordinates through which inhabitants and visitors frame and order the urban experience” (Amin and Thrift 2002, p. 17). We can observe the urban rhythms through mobility practices. According to the Paola Pucci (2015, p5), we can identify three interpretive keys to interpreter mobility in contemporary city:
“Mobility as a social-spatial phenomenon; Mobility as social capital and a common good; Mobility as a project.”
The social-spatial phenomenon is closed related to urban rhythms. Urban rhythms: A chronotopic approach to urban timespace (Ondrˇej Mulı´cˇek et al, 2014)
If mobility can be interpreted as a knowledge tool (Pucci 2015, p5),thanks for the knowledge of mobility practices we can support and increase the efficiency of urban polices and mobility services (Manfredini, Tagliolato, Pucci ,2015, p253).
Mobility can present both a fact-find tool and a policy tool for understanding the process of transforming the contemporary city (Pucci,2014). Pasqui (2008) mentioned that the “time of urban population oscillates and is comprised of cyclical temporalities intertwined with a plurality of used of spaces and places”. Mobility is a fact-finding tool because it is able to describe urban rhythms (Pucci ,2015). With the users’ practices and spatial mobility, urban researchers can interpreter the complexity of human activities, and indeed of the urban spaces (Cressweel, 2013). Nuvolati recognized the tools and data serve to describe different patterns of mobility in the forms of “active biographies”.
Nowadays, traditional sources are unable to describe the mobility in terms of new forms of mobility in the contemporary city (Edensor, 2011). New, mixed forms of travel mobility is the mobility practices result from combination of physical and virtual mobility (Flamm and Kaufamann, 2006).
Since the mobility practices are complex which include activities in space and time, we will try to analyze based on Baidu heat map for the investigation on real-time monitoring of mobility practices in this dissertation. In the next chapter, we will introduce an overview of the literature for how big data describes mobility practices.
- 8 -
Chapter 3 BIG DATA TO DESCRIBE MOBILITY PRACTICES:
AN OVERVIEW IN THE LITERATURE
In the Information Age, we live in digital cities and we have many digital data that increase our knowledge on urban condition. Compared with traditional data, Big data has many advantages, such as more acquisition modes, bigger data capacity and greater timeliness. That's why we can identify the complex mobility practices through Big data. Working in this chapter is mainly composed by three parts. First, it introduces the emerging background of big data and its advantages. Secondly, it describes how Big data describes the mobility practices demonstrating classification and application of data in mobility practices. Finally, some limitation of use of big data approach in mobility practices is introduced.
3.1 The rise of big data on urban studies and planning
The Information Age is coming.
After agricultural society and industrial age, Information age which recognizes “computers” as core (Wikipedia). Since 20th century, information communication technology represented by the Internet has a rapid development in the international background. It does not only has far-reaching impact for human society or global economical structure and it also reconstructs the real and virtual space (Steve Graham,1996). Actually, the new urbanization age is coming in China under the context of the Information Age. In 2014, there was rapid increase of Big data in urban studies and planning practices in China (Jinwei Hao et al, 2016). Under the information age, based on ICT to promote smart city is the new method for new urbanization. At the same year, the Sate Council promulgated National new urbanization plan 2014-2020 that strengthens the construction on smart city, including information network, infrastructure construction on planning public service and so on. According to the actual planning processing in China, urbanization is under multiple guidance. Urban planning meets some problems which restricts development on urbanization (Zhen feng, 2017). Besides the these difficulties, another new characteristic is more frequent interaction between traditional research institutes and IT companies, such as Baidu, Alibaba etc (Jinwei, 2016).
What is Big data?
According to the explanation from Wikipedia, Big data is not only has large volume but also complex that traditional data processing application software is inadequate to deal with them. Big data challenges includes capturing, data storage, data analysis, sharing, transfer, updating (Wikipedia).
In the "Big Data Age" written by Victor Mayr-Schoenberg and Kenneth Cookey, the Big data is without random analysis (sample survey) but choose all data to analysis
and process.
The significance of strategy of Big data is not just only masters the massive data, because it is most importance working on how to deal with these information and transfer it into significant value.
3.1 The rise of big data on urban studies and planning
3.1.1 From “Small data” to “Big data” in urban research
Nowadays, Big data can be applied in urban development such as: public health, transportation or security and soon. Big is relevant for the construction of smart cities. Why people attach importance to Big data applied in urban planning and other industries? The reason is the characteristic of it. Before information age, all the survey just based on the “simple data” but now information technique can mining data close to “complete sample”. Data can be more complex and relative relation behind (Viktor Mayer-Schönberger,2013).
For a long time, traditional data, such as censuses, government records and geomatic surveys provided information about cities and their citizens. In addition, businesses also generate a lot of data about their operations, markets and customers. However, these datasets generally rely on samples because they are generated on a non-contiguous basis and the number of variables is very small in terms of limited
access (Kitchin R, 2013). As a result, these just has "small data" research. The generation of big data is based on the Information Age. Big data is, essentially, everything captured or recorded digitally by modern information and communications technologies such as networked sensors, ‘smart’ objects and devices, the web and social media. It can take the form of text, web data, tweets, sensor data, audio, video, click streams, log file, banking and purchase data, social network chatter, traffic flow sensors, mobile phone GPS trails and smart energy meters (Eaton et al, 2012). As the ultimate complex and the noisy human system, cities have been the focus of many of these claims. Big data are proposed as an important new source of insights into the management, governance and experience of urban life, through their applications to transportation systems, resource distribution and operations or emergency services, among many others (Rabari C, Storper M, 2014). Many researchers expect big data-driven urban analytics to occupy a greater role in the practice of urban management, planning and policy design.
-Governance and participation
In the context of the information technology revolution, citizens are increasingly involved in urban governance by participating in public decision-making platforms provided by public agencies.
- 10 -
Internet. The second element is more interactive: non-governmental users are free to comment, feedback, and discuss. This is a process of public participation in policy-making and it is an effective two-way between the government and non-governmental users (individuals, companies or organizations).
-Real city, virtual city
Information technologies provide inputs from sensors, mobile devices and databases to enable mapping and locating. There is a digital representation of the city, which is virtual in the form of maps and images. Many city governments now use real-time analytics to manage aspects of how a city functions and is regulated (Kitchin R, 2013). Perhaps a common example relates to urban environmental conditions, where data from a sensor network distributed throughout the city and sensors are fed back to a central platform to measure air pollution, water levels or and so on. Similarly, many other researches in other urban field through the data to analysis or reading the city, with the aims to make a better urban police-making.
The traditional basic data and Big data has a great difference in data capacity, timeliness and so on (as shown in Table 2.1). Planners proposed that traditional data be re-recognized, reorganized, combined with big data, so as to comprehensively utilize them in the urban planning. To increase the value of data is the development trend of the urban planning.
Table 3.1 Comparison between Traditional Data and big data (Source: Wang, 2015)
Since the mobility practices are complex which include activities in the space and time, we will try to analyze based on Baidu heat map which gathers data based on real-time position from smart phones with Baidu Maps and other apps using its location-based platform to create the heat map (Paul Bischoff,2014) for the investigation on mobility practices. With analysis of the mobility practices based on Baidu Heat Map and land use through POIs, we propose six applications to describe different urban patterns and orient the planning policy under the “digital skin” of city.
3.2 Classification and application of digital data in mobility practices
3.2.1 Focus on four aspects in studies of mobility practices through the use of digital data
According to the research from Hao et al (2016), the study of “commuting and transportation structure” could be divided into 4 types as follows:
-The first type is recognition and simulation of individual commuting behavior.
-The second one is the analysis of transportation connections between different locations in cities.
-The third one is the identification of jobs-housing sites and commuting corridors according to residents’ presence in hotspots, as well as the analysis of jobs-housing balance in cities at structural level.
-The fourth one is the identification and analysis of community structure.
Study on Mobility practices also relates to these four aspects.
3.2.1.1 Individual commuting behavior
Mobility practices focus on the spatial-temporal characteristics of individuals. Behaviour Geography Research Group led by Pro.Yanwei CHAI in Peking University use GPS Log Data to study the individual mobility (Hao et al, 2016). Actually, scholars found the impact of gender, education, occupation and income on individual behavior in several Chinese cities by GPS Log Data (Chai, Zhang, Zhang, Yan, & Zhao, 2009; Shen, Chai, & Kwan, 2015). About the research scope, researchers want the research fields more widely like spatial pattern of individual behavior in suburbs, suburban spatial structure and suburbanization, etc in China (Chai et al., 2013; Shen, Chai, & Kwan, 2015; Ta & Chai, 2015).There is a case from the Pro. Paola Pucci. She studied on the Mobility behavior in peri-urban areas and takes the Milan Urban Region as a case study. The research investigated the relationship between urban sprawl and forms of mobility and lifestyle.
- 12 -
3.2.1.2 Transportation connections between different locations in cities
There is an example for transportation connection between different locations in cities. According to the study from Liu et al.(2009), they identified the locations which had close connection by metro cards data in Shenzhen in terms of classified passenger flow volume between stops. They analyzed the spatial and temporal mobility patterns at large scales, so as to find out the regularity of mobility practices which can provide decision support for the mobile policy in Shenzhen.
Figure 3.1. Connections between different stops in weekdays in Shenzhen (based on Smart Card Data) (Source: Liu et al., 2009).
3.2.1.3 Jobs-housing sites and commuting corridors
Mobility practices can observe the jobs-housing sites and commuting corridors according to residents’ presence in hotspots in terms of the mobility practices based on working hours and rest time. This study is also the analysis of jobs-housing balance in cities at structural level. In 2005 , based on smart cards data, Long and Thill (2015) used one-week Beijing data to identify jobs-housing sites and commuter travel trajectory in Beijing. In recently 2 years, Baidu Heat Map provides new data for researchers to study on jobs-housing space. Tan et al, used Baidu Heat Map to measure the ratio of job–housing balance in Chongqing and also compared it with Beijing. According to the Baidu official legend for heat map, estimating the number of people in the active space. From the result, Chongqing is good at jobs-housing balance in the central district area (Showing on the left Figure3.2). The heart of Beijing is unbalanced in inner city since where has more people in day than night (Showing on the right Figure3.2).
Figure 3.2 Job-housing balance in Chongqing and Beijing (Source: Tan et al, 2016)
3.2.1.4 Community structure
Commuting has its own hierarchical property (Hao et al, 2016). If people’s mobility practices are mainly inside some communities, this type of communities can be recognized as the relatively independent communities. If all these communities can be identified, which will promote the mobile policy and the plan for urban spatial structure. Planners can provide a guide for promoting internal traffics rather than trans-community, so as to decrease the commuting of single-center megacities (Zhou, Wang, Li & Cao, 2015).
Figure 3.3 Trip links at the TAZ (Traffic Analysis Zone) scale illustrating dominant commuting patterns in Beijing (Source: Long & Thill, 2015).
Note: Arrows denote the commuting direction from home location to jobs location.
Besides content of study, in a smart city, mobility practices can be observed by different digital data. The next section will introduce some cases study based on
- 14 -
different data , such as mobile phone data, car floating data and Baidu Heat Map.
3.2.2 Mobility practices and different data source
3.2.2.1 Mobile Phone data describing mobility practices
In 2015, Paola, Manfredini and Tagliotatol used mobile phone data provided by Telecom Italia in the Italian region of Lombardy to describe spatialized urban practices and origin-destination flows of daily movements. They studied the complex temporal and spatial patterns from three different types of mobile phone data. According to their study, mapping urban practices through mobile phone data can offer information on temporary populations and city usage patterns (daily/nightly practices, non-systematic mobility).
“Public transportation policies could benefit from the identification of regular mobility practices: it could offer an insight into the actual catchment area of an urban context, to which regulation measures and appropriate rates of public transportation service should correspond.”(Pucci et al,2015)
Among the many researches conducted with mobile phone data (Ahas and Mark 2005; Ratti et al. 2006; Kwan et al. 2007; Reades et al. 2007….), we present a research based on mobile phone data by Yang (2015) that used the temporal and spatial information of the mobile phone signaling data to analyze rail passengers’ travel characteristics. According to her study, the rail-time dynamic traffic information could be collected. The results demonstrated the travel characteristics of transfer passengers, matching with land use situation around the subway station and it can be obtained by using phone signaling data accurately.
3.2.2.2 Floating car data describing mobility practices
Taxi is a special kind of public transport, with all-weather operations, real-time data, running routes and times determined entirely by the passengers and other characteristics. Therefore, taxi-based trajectory data may better reflect the time and space laws of residents travel and commuting behaviors (Cheng hongli, 2016).
According to the research from Tong Xiaoju et al (2012), the study uses taxi GPS trajectory data to identify the main mobility behavior of urban residents in working days and rest days. The result demonstrates that the morning peak hours is from 7:00 am to 9:
30 am and the evening peak hours starts from 17:00 pm to 19:30 pm in Shenzhen, China.
Fu xin et al (2017) investigated the mobility behaviors by Taxi GPS devices and temporal-spatial distribution characteristics of urban residents’ mobility practices in Xi’an. The result shows that traffic flow in rush hours on Monday and Tuesday are
relatively stable, with a slight increase from Wednesday to Friday. The number of commuters by taxis is the largest. They also identified workplace and residence, which provides basis for commuter services in the city.
3.2.2.3 Baidu Heat Map to describe mobility practices
More and more technological companies are involved in urban research in China, such as Baidu and Tencent. Every season, Baidu releases an urban research based on it collected data. The report will cover urban vitality, road transportation, public transport, and sharing travel.
Baidu has more than 200 million users and over 40 million merchant data, which covers 400 cities and a thousand counties. The average of location requests from daily users is more than 3 billion 500 million times. Wang Ying, a senior analyst at iResearch, believes that the map products of Baidu Big Data can serve as a reference for relevant government departments and provide reference for enterprises and individuals, which has great social value (Cui Jing, 2014).
Baidu gathers data based on real-time position from smart phones with Baidu Maps and it has more than 200 million registered users (Paul Bischoff,2014). According to the data Baidu have obtained, they analyze the practices mobility for lots of cities in China.
There are two figures show the congestion in Shanghai center and Chengdu center on a working day, using Baidu data. In the second season in 2017, the figures show the result of comparison of the traffic tram on 3 different scenarios:7:00-9:00, 11:00-13:00 and 17:00-19:00 respectively. Red area is congested according to the measure from Baidu.
Figure 3.4 The Congested area in Shanghai center during different periods on working days (Source: Baidu)
Figure 3.5 The Congested area in Chengdu center during different periods on working days (Source: Baidu)
- 16 -
Actually, besides the research from the Internet companies, many urban researchers had used Baidu heat map for interpretation of city. Currently, the urban research based on Baidu Heat map including urban space spatial structure, Jobs-housing balance research, analysis of China Polycentric Cities and the correlation between environment and mobility behavior. Next, we will introduce the applications on these four aspects respectively.
1.Research on urban spatial structure: Wu Zhiqiang and YE Zhongnan (2016) used the real-time advantages of Baidu heat map to establish a spatial research method based on space use intensity. Taking Shanghai center as an example, the study shows some indexes, such as the population agglomeration intensity, the agglomeration location and movement of population in Shanghai Center during a week. The result indicated that, compared with weekends, the people aggregation on workdays tends to be more durable in time and more dispersed in space on workdays. The research shows that the Baidu heat map can provide more dynamic perspectives and methods for urban space research after appropriate mining and processing.
2.Jobs-housing balanced study: as we have mentioned in last section, Tan Xin et al (2017) study on jobs-housing balance in Chongqing metropolitan area based on Baidu heat map. Compared with Beijing, the research shows Chongqing has an balanced spatial characteristics on analysis of Jobs-housing, however just some areas has obvious concentration on jobs or residential place.
3.According to the research from Li Juan et all (2016), analysis of China Polycentric Cities based on Baidu heat maps identify that there area 69 polycentric cities in all urban centers of 658 cities. They further analyze areas based on the data, average distance and activity intensity of all polycentric cities on the basis of these three categories. According to their analysis, Chinese big cities perform significant polycentric city, while development of small cities (especially county-level city) are extremely lagging.
4.In terms of the study from Zhang Xiaofan et, al (2016), combining the Baidu heat Index and air quality index analyzes the environmental issue of the relationship between mobility behavior and air quality index. They found out that environmental factors, such as fog, has an impact on mobility practices. Finally, they proposed some suggestions for the policy.
3.3 Limitation of the use of big data approach in urban research
3.3.1 Validity and quality of data
One of the characteristics of Big data is the volume is huge, but not all data are useful.
- Data noise
Although Big data contains information itself in a finer grained and detailed manner, they also record random variations, fluctuations, and even noise during the measurement (Liu et al, 2016). As the number of data increases, garbage data will become more and more. In this way, the important data or objective truths that we seek will be drowned by the noise, thus reaching erroneous conclusions. We need to pay attention to the validity and quantity of the data (Elwood, 2008; Goodchild and Li, 2012). Mark-Twain, Rodgers and Charles et all, "what leads us into the dilemma is not that we don't know anything, but what we know that is less real.” Internet is one of the most important sources of Big data, but there is a huge amount of fake information. Sometimes, it is difficult for us to identify false information.
-Bias
The sources of big data can be roughly divided into two categories: one is scientific data, such as experimental data and sensing data; another is about human social activities, including social relations, behavior trajectories and other personal information. However, there are errors or bias for the data. Therefore, using some data to represent “the full sample” will be deviant or even wrong. In order to reach a more an accurate result, we need to find suitable methods to clean data in order to eliminate the deviation.
3.3.2 Representativeness of data
Many traps hidden behind Big data, even though it has a big number of samples. Researches have tried to examine the biases regarding representativeness (Teng yuwei, 2016). In this research we introduce the Baidu Heat map to observe the urban rhythm. Baidu gathers data based on real-time position from smart phones with Baidu Maps and it has more than 200 million registered users (Paul Bischoff, 2014). However, who uses the Apps from Baidu. The answer is the young people. According to the report from China Internet Network Information Center(2014),nearly 70% of social media users are under 30 years old in China, so there is an age bias. It means that mobility practices of a large proportion of people can not be analyzed by Baidu heat map, which is far from being representative of the entire population.
- 18 -
3.4.3 Data security and privacy protection issues
Big data collection and use processing are most likely to involve personal privacy, business secrets, public interests and national information security. Therefore, the problem of security and legitimacy constitutes is one of the factors which limits the value of Big data. Taking cloud computing as an example, this Information Technology service offer to users over the web on a rented base (Osama Harfoushi et al, 2014). There is result for a survey which shows the importance of the challenges for cloud computing. In figure 1.1, the security is the utmost concern.
Chapter 4 METHODOLOGY
This chapter will introduce the methodology used in this research with last three chapters representing the analysis for framing the way. Firstly, main dynamic and feature of research scope will be introduced. And then, the explanation of research question and all the data sourced used in this study will be demonstrated. Finally, a brief introduction to the approach of the analysis will be described, with the aim of guiding for next three chapters.
4.1 Questions in focus
Urban mobility practice is a good urban rhythm indicator. Planners acquire the urban rhythms, which can be defined as “the coordinates through which inhabitants and visitors frame and order the urban experience” (Amin and Thrift 2002, p. 17). It can better interpret city and provide the guideline for urban policy or apply experiences from other places to it. To address this issue, the key question in this thesis is: how can big data help to describe the space-time variability of the urban practices? How can they help to identify factors which are relevant with different mobility pattern, and then making an application on good mobility model and land use in urban planning. Base on this question, the aim of this thesis is to deal with the following questions:
1. Which kind of data can explain or show mobility practices? What are mobility practices in Chengdu?
2. What are the relevant factors that affect the practices of mobility? With the support of big data, how to explore the relevance between land use and mobility pattern? 3. what are the applications of big data in urban planning and mobility policy?
In order to better understand the significance of mobility practices in Chengdu, we introduce this city firstly.
4.1 The relevance of the case study: Chengdu in China
To introduce the main relevant features of Chengdu, firstly, there is an introduction on the urban spatial structure of Chengdu as well as the current urban and mobility policy for solving the problems caused by a monocentric urban structure model. Then, the development of industrial structure and land use planning will be presented, with the aim to better understand the reasons behind current jobs housing research for chart 7. Finally, because mobility practices are closely related to traffic, there is a summary of the urban transportation supply, including the road network and metro lines .
- 20 - 4.2.1. Urban spatial structure in Chengdu
The Classical Monocentric Model
Chengdu is a typical plains area that expands equidistantly in the course of its development, so its spatial structure is the classical monocentric model. The following figure 4.1 shows the evolution of urban spatial morphology in Chengdu from 1949 to 2002, which shows the morphology as follows: massive---star-shaped---monocentric and ring-shaped. The most obvious feature of urban spatial form development is that the urban space extends from the traditional core area to different circles. The city is expanding rapidly and urban functions gather in the central, forming a single-core urban spatial structure which can be demonstrated in Figure 4.2.
Figure 4.1 Evolution of Urban spatial morphology in Chengdu (Source: Zhu wei,2005)
Problems
However, when the urban development reaches a certain stage, the monocentric model is no longer applicable, and it’s easy to trigger “urban problems”, such as disorder, traffic congestion and so on. Firstly, in the past 20 years, urban service, such as commercial facilities, government agencies, public service facilities, have been highly concentrated in the inner nuclear zone, thereby causing overcrowding and dysfunction in the core urban areas. Besides, there is a rapid growth of population and unbalanced distribution of citizens in urban areas, leading to traffic congestion. In the morning and evening travel peak, some areas appeared serious congestion. According to the Chengdu City Traffic Management Bureau statistics, the average speed in downtown area dropped from 22km in 2005 to 18km/hour in 2013.
New strategy
In order to solve the adverse effects brought by the monocentric model, Chengdu proposed a dual-core space structure and put forward a planning for Tianfu New District in 2009. In November 2011, the People's Government of Sichuan Province approved Tianfu New District Master Plan submitted by the Department of Housing and Urban-Rural Development of Sichuan Province. Tianfu New District involves the High-tech South District, Longquanyi District, Shuangliu County, Xinjin County, Pengshan County in Meishan, Jianyang in Ziyang (Figure 4.3). There are 3 cities, 7 counties, 37 towns totally and the planning area is 1578 square kilometers(Chengdu Planning Institution). The construction of it are divided into three steps: short-term, median-term and long-term. The short-term period was from 2011 to 2015, and its new urban construction land was 160 square kilometers. Based on High-Tech South District, the infrastructure was implemented first, and the modern manufacturing industry was promoted, thus promoting the dual core
spatial structure in Chengdu.
Figure 4.3 Planning Area of Tianfu New District (Source: Chengdu Planning Institution)
- 22 -
Figure 4.4 The relationship between Tianfu New District and Inner city center in Chengdu
(Source: Chengdu Planning Institution)
From the perspective of economic, Tianfu New District and Chengdu central city are both independent districts, with relatively perfect functions and own core. In the future, these two cores will form complementary functions of cities and promote the development of surrounding areas.
The case of High-Tech South District in Tianfu New District as well as the inner city of Chengdu will be analyzed in the later application, processing Baidu Heat Map and POIs data to compare the development of these two districts in terms of the mixed land use.
4.2.2 Spatial distribution of economic activities
In the urban growth of Chendu, an important role is played by industrial development. In doing so, we analyze the spatial distribution of economic activities.
There are two important stages for spatial distribution of economic activities in Chengdu.
Under Planned economic system: heavy industry development and centralized layout (Before 1992 )
The spatial growth of Chengdu mainly centered on the old city and expanded slowly and compactly to the periphery during planned economic period. Based on the old city, It mainly developed administrative offices and expanded outward. The industrial areas were mainly located in the eastern and northwestern suburbs. Besides, there were many colleges and universities in the western and southern suburbs. Actually, residential areas were mainly within the Second Ring Road, which laid the basic pattern of working in the East and living the West. The following table shows the industrial space distribution during the Planned Economy period.
Figure 4.5 The industrial space distribution during the Planned Economy period (Source: Zhou, 2013)
Under Market economy system: the combination of centralization and decentralization(after 1992).
The most striking feature of this period is that the tertiary activities form agglomeration effect in the center of the city, and industry shifts to Urban periphery. Chengdu industrial spatial distribution gradually creates a multi-center development, which can disperse the population and industry to reduce urban pressure.
The adjustment of industrial structure affects the changes of urban land use. An increase in the number of tertiary activities in entral areas will result in a growth of the number of jobs per unit area, thus affecting the study of urban jobs housing balance that mentioned in the chapter 7.
- 24 - 4.2.3 Transportation
The traffic in the city directly affects the travel behavior of the residents. Therefore, we introduce the traffic in Chengdu. There is a summary of the traffic mainly including the urban road network, the Second Ring Road and the relationship between the metro lines and urban development.
The Road network
After years, the structure of the road system to support urban development has formed a ring and radial road network. The disadvantages of this network are as follows: central area of the road network needs to meet high traffic demand, resulting in increased traffic pressure in downtown urban area. At present, the congestion area is mainly within the Second Ring Road .However, there has been a trend from point to line and from a local area to a large area.
Figure4.6 The road network in Chengdu (Source: Zhong Min)
Set up the BRT system on the Second Ring Road
In 2013 Chengdu focuses on urban public transport development, so as to give priority to public transportation policy, establishing a Bus Rapid Transit on the Second Ring Road to meet the increasing travel demand. Besides, the Second Ring Road has a special position in Chengdu. It is an important symbol of urban development and the area within the Second Ring Road can be regarded as the old city.
Metro lines and urban development
The following map shows Chengdu's subway plan and all metro lines will form a grid in the future. There are already five subway stations in operation. From the perspective of long-term planning, Chengdu Municipal Government proposed that the eastward and southward developments have priority.
Metro Line 1 is the earliest subway in Chengdu, from north and south. On the south axis, there are many office buildings; the most intensive star rated hotels; Tianfu Software Park and Incubation Park, so that the South City has become a gathering place of high-tech industry. The south district will be the center of politics, economy, culture, commerce, finance and life in Chengdu.
Figure4.7 Planning of metro lines in Chengdu (Source: ccddt)