Treball Final de Grau
Analysis of polyphenols in agri-food wastes
Anàlisi de polifenols presents en residus agroalimentaris
Anna Segués Codina
Aquesta obra esta subjecta a la llicència de: Reconeixement–NoComercial-SenseObraDerivada
http://creativecommons.org/licenses/by-nc-nd/3.0/es/
new ideas and playing around with things.
Stephanie Kwolek
A les meves companyes de laboratori, per les estones compartides i per fer-me sentir com a casa; en especial, a la Núria per fer-me costat sempre i per ajudar-me amb les anàlisis cromatogràfiques.
Al Dr. Xavi Saurina, per la seva bona disposició, en particular la seva ajuda amb les anàlisis quimiomètriques.
Molt especialment a la Dra. Mercè Granados, per la seva dedicació i paciència, per guiar-me en tot moment durant la realització d’aquest projecte.
I per últim, a la meva família, el Ramon, la Montse, el Marc i el Quirze, pel seu suport incondicional en tot moment.
C
ONTENTS
1.
S
UMMARY 32.
R
ESUM 53.
I
NTRODUCTION 73.1. Antioxidant activity assays 7
3.1.1. Hydrogen atom transfer-based assays 8
3.1.1.1. Oxygen radical absorbance capacity assay 8
3.1.2. Single electron-transfer-based assays 9
3.1.2.1. Folin-Ciocalteu assay
9
3.1.3. Mixed-mode (HAT/SET) assays 9
3.1.3.1. Trolox equivalent antioxidant capacity assay
10
4.
O
BJECTIVES 115.
E
XPERIMENTAL SECTION 125.1. Chemicals and reagents 12
5.2. Samples 12
5.3. Instrumentation 13
5.4. Methods 14
5.4.1. Extraction of polyphenols from samples 14
5.4.2. Colorimetric analysis of polyphenols by Folin-Ciocalteu assay 14 5.4.3. Colorimetric analysis of polyphenols by TEAC assay 15 5.4.4. Fluorometric analysis of polyphenols by ORAC assay 16
5.4.5. Chromatographic analysis of polyphenols 16
6.
R
ESULTS AND DISCUSSIONS 186.1. Spectrometric analysis of polyphenols in agri-food wastes 18 6.1.1. Determination of polyphenols by Folin-Ciocalteu assay 18
6.1.2. Determination of polyphenols by TEAC assay 20
2 Segués Codina, Anna
6.2. Comparison of Folin-Ciocalteu and TEAC results 23
6.3. Analysis of polyphenols in agri-food wastes by HPLC 24
7.
C
HEMOMETRIC ANALYSIS OFHPLC
ANDTAC
ASSAYS 277.1. Principal component analysis of HPLC data 27
7.2. Principal least squares regression of antioxidant assays 28
7.2.1. PLS of Folin-Ciocalteu data 29
7.2.2. PLS of TEAC data 30
8.
C
ONCLUSIONS33
9.
R
EFERENCES AND NOTES35
1.
S
UMMARY
This work is enrolled to a valuation project of wastes from agri-food industries. It is particularly based on the polyphenols recuperation.
Polyphenols are natural antioxidants presents in fruits, vegetables, cereals and beverages. These compounds act against reactive oxygen species which produce processes of oxidation in our body. Several studies confirm that antioxidant from vegetal origin are related to the prevention of cardiovascular and neurological diseases, cancer and aging-related disorders. Research in this field has increased significantly in the recent years due to the beneficious effects that these compounds cause to health.
There are two main strategies of analysis of the total content of polyphenols in food products: the first one is based on the determination of the antioxidant capacity; the second one is based on the analysis of the total content of polyphenols by liquid chromatography.
In the project, Folin-Ciocalteu, trolox equivalent antioxidant capacity (TEAC) and oxygen radical absorbance capacity (ORAC) assays were evaluated and compared with the results obtained with liquid chromatography with UV detection.
The results of Folin-Ciocalteu and TEAC methods show an appropriate correlation, even with the existent controversy with the equivalence of the values obtained with each assay. Finally, a very good correlation between both methods and HPLC data was observed. Wastes from winery, olive oil and black grape were the samples with most concentration of polyphenols.
Keywords: polyphenols, antioxidants, Folin-Ciocalteu, TEAC, agri-food wastes, liquid
2.
R
ESUM
Aquest treball s’inscriu en un projecte de valorització de residus provinents de la industria agroalimentària. En particular, està relacionat amb la recuperació de polifenols.
Els polifenols són antioxidants naturals presents en fruites, verdures, cereals i begudes. Aquests compostos actuen contra espècies reactives d’oxigen que produeixen processos d’oxidació en el nostre cos. Molts estudis indiquen que els antioxidants d’origen vegetal estan relacionats amb la prevenció de malalties cardiovasculars i neurològiques, càncer i desordres causats per l’edat. La recerca en aquest camp ha augmentat de manera significativa en els últims anys a causa dels potencials efectes beneficiosos que aquest tipus de compostos comporten per a la salut.
Principalment, existeixen dues estratègies per analitzar el contingut de polifenols en productes alimentaris: la primera és la detecció mitjançant mètodes de quantificació de la capacitat antioxidant; la segona, l’anàlisi del contingut de polifenols amb cromatografia de líquids. En el projecte, s’han avaluat els mètodes Folin-Ciocalteu, capacitat antioxidant equivalent al Trolox (TEAC) i capacitat d’absorció de radicals d’oxigen (ORAC) i, s’han comparat amb els resultats obtinguts amb cromatografia de líquids amb detecció UV.
Els mètodes Folin-Ciocalteu i TEAC han donat resultats molt correlacionats, tot i la controvèrsia existent entre l’equivalència dels valors obtinguts en cada assaig. Finalment, s’ha observat una correlació molt bona entre els dos mètodes i els resultats de HPLC. Les mostres analitzades amb més concentració de polifenols són les de residus de vins, d’olis d’oliva i de raïm negre.
Paraules clau: polifenols, antioxidants, Folin-Ciocalteu, TEAC, residus agroalimentaris,
3.
I
NTRODUCTION
Antioxidants play an important role in the body defence mechanisms against reactive oxygen species, which are harmful products of the aerobic metabolism that may produce oxidative damage. Several studies confirm that antioxidants from vegetal origin food products appear to be related to prevention of cancer, cardiovascular and neurological diseases and aging-related disorders. Consequently, research on antioxidants in food products, cosmetics etc. has increased significantly in the recent years.
Polyphenols are antioxidants mainly present in fruits, vegetables, cereals and beverages. The chemical structure of polyphenols consists in at least one group aryl with one or more hydroxyl groups. The quantity of polyphenols in fruit vary depending on the level of ripeness, geographic situation, climate, storage conditions and other factors 1.
Food companies are interested in knowing the concentration of antioxidants, mostly of polyphenols, in their products due to consumers interest in health benefits 2. There are two main
strategies for the analysis of polyphenols in food products: by liquid chromatography (LC) or using assays based on the measure of the antioxidant capacity.
The analysis of polyphenols in food matrices by LC, usually with UV or mass spectrometry detection, is not a trivial issue. They are difficult to separate and quantify due to their huge chemical diversity. 3 For this reason, the usual approaches to the chromatographic analysis of
polyphenols are the determination of few target polyphenols, or the determination of the main families of polyphenols (related to clusters of chromatographic peaks, usually poorly resolved).
On the other side, the antioxidant activity assays are focused on the total content of antioxidant compounds, which in vegetal food products are supposed to be mainly polyphenols.
3.1.
ANTIOXIDANT
ACTIVITY
ASSAYS
The total antioxidant capacity (TAC) is a sum parameter that measures the capacity of a sample to scavenge free radicals. There are some methods for measuring TAC. Each method is
8 Segués Codina, Anna
based on different mechanisms, and there is a lack of standardization. It is considered that we can’t fully evaluate the TAC with only one assay 4.
TAC assays can be classified according to the type of reaction involved, which mainly fall into the following categories:
• Hydrogen atom transfer-based (HAT) assays. • Single electron-transfer-based (SET) assays. • Mixed-mode (HAT/SET) assays 5.
3.1.1. Hydrogen atom transfer-based assays
Hydrogen atom transfer-based assays quantify the capacity of an antioxidant to quench a radical. The antioxidant transfers an atom of hydrogen to the radical and as a result, the reaction between the radical and a target molecule is delayed or inhibited. In these assays, changes in the absorbance or fluorescence intensity of the target molecule are monitored. The changes can be correlated with the antioxidant concentration 6.
The reaction involved in these assays is the following one ROO˙ + ArOH → ROOH+ ArO˙ (1)
where ROO˙ is a peroxyl radical, ArOH is an antioxidant and ArO˙ is the radical formed, which is stable.
The Oxygen radical absorbance capacity assay (ORAC) is a representative assay of HAT-based methods.
3.1.1.1. Oxygen radical absorbance capacity assay
The ORAC assay measures the capacity of antioxidants to protect fluorescein (figure 1) from oxidative damage produced by a radical.
The assay begins with the generation of peroxyl radicals when 2,2’- azinobis(2-methyl-propionamidine) dihydrochloride (AAPH) (figure 2) is heated in presence of oxygen. The peroxyl radical reacts with fluorescein causing conformational changes in its structure resulting in a loss of the fluorescence of the sample. However, in presence of antioxidants, the degradation of fluorescein is delayed or inhibited, and the reduction of fluorescence is slower. The TAC is quantified integrating the area below the fluorescence decay curves 3, 7.
Figure 1. Fluorescein structure. Figure 2. AAPH structure.
3.1.2. Single electron-transfer-based assays
Single electron-transfer-based (SET) assays measure the capability of an antioxidant to reduce an oxidant. Therefore, the antioxidant transfers an electron to the oxidant. This reaction produces a change of colour, and a shift of absorbance, which is measured by an ultraviolet-visible spectrometer. The value of absorbance is used to quantify the concentration of antioxidants in the sample 8.
The Folin-Ciocalteu assay is a representative assay of SET-based method. 3.1.2.1. Folin-Ciocalteu assay
The Folin-Ciocalteu (F-C) assay is a colorimetric method which measures the reductive capacity of a sample. The F-C reagent is a phosphowolframate - phosphomolybdate complex which is yellow; however, when this reagent is reduced, we obtain blue products which absorb at 765 nm 9.
This assay is widely used because it is quick, easy and robust, and doesn’t require special equipment. In addition, the interferences from the matrix are minimized because absorbance measurements are performed at a long-wavelength 6.
3.1.3. Mixed-mode (HAT/SET) assays
There are some methods that can’t be classified as HAT or SET-based assays because they use both mechanisms. Normally, in these assays, the antioxidant scavenges a stable radical chromophore 5.
The Trolox equivalent antioxidant capacity assay (TEAC) is a mixed-mode (HAT/SET)-based method.
10 Segués Codina, Anna
3.1.3.1. Trolox equivalent antioxidant capacity assay
The TEAC assay measures the capacity of the antioxidants of a sample to scavenge the radical 2,2’-azino-bis(3-ethylbenxothiazoline-6-sulfonic acid (figure 3). The radical cation used is ABTS˙+ which is a blue-green chromophore with maxim absorbance values at 645 nm, 734nm
and 815 nm. Antioxidants reduce ABTS˙+ to ABTS, causing a decrease of the colour and,
therefore a reduction of absorbance. The value of absorbance is correlated with the concentration of antioxidants in the sample 7.
Figure 3. ABTS˙+ structure.
The TEAC assay is widely used because ABTS is inexpensive and easy to use. In addition, this method can quantify a large range of antioxidants. However, ABTS ˙+ is not stable for long
periods of time and the reaction time is different for each antioxidant which can lead to different final values depending on time of measure 7, 10.
Although the antioxidant activity assays are not specific to polyphenols, they are considered as suitable indicators for total polyphenol content in vegetal origin samples, and they are widespread used. Nevertheless, there is a lot of controversy about the equivalence of the information provided by the different assays because different mechanisms, radicals or oxidant sources are used 1.In addition, in the literature search we have not found data about correlation
polyphenolic contents in different kind of wastes. There are many analytical methods for the analysis of polyphenols, but there is controversy about the equivalence of the information provided by different assays aimed to determine total polyphenols.
This study is focused on methodologies for polyphenols analysis in wastes from agri-food industries, mainly fruit juice industries, wineries or olive oil mills.
The main goal is to assess if results obtained using different methods in the analysis of a large set of samples show some correlation.
Specific objectives are:
• To analyze the set of samples using the Folin-Ciocalteu assay, the Trolox equivalent antioxidant capacity assay and the Oxygen radical absorbance capacity assay.
• To analyze the set of samples by liquid chromatography with UV detection. • To apply Principal Component Analysis to the obtained data, and to build, if
12 Segués Codina, Anna
5.
E
XPERIMENTAL SECTION
5.1.
C
HEMICALS AND REAGENTSGallic acid 97,5-102,5%, potassium peroxodisulfate for analysis, fluorescein (free acid) 95% and AAPH granular 97% were purchased from Sigma-Aldrich (St.Louis, USA).
ABTS 98% was purchased from Alfa Aesar (Kandel, Germany). Trolox was purchased from Carbosynth (Berkshire, UK).
Sodium dihydrogen phosphate monohydrate for analysis (NaH2PO4 · H2O) was purchased
from Fluka Chemie (Buchs, Switzerland).
Disodium hydrogen phosphate anhydrous for analysis (Na2HPO4), hydrochloric acid 32% for
analysis, formic acid 98-100% for analysis and ethanol gradient grade for LC were purchased from Merck (Darmstradt, Germany).
Methanol for UHPLC supergradient, acetonitrile for HPLC gradient grade and Folin-Ciocalteu’s reagent were purchased from Panreac (Castellar del Vallès, Spain).
Sodium carbonate anhydrous was purchased fromProbus S.A. (Badalona, Spain). Mili-Q water was purified using an Elix 3 coupled to a Mili-Q system.
5.2.
S
AMPLESThe samples quantified were vegetables, fruits and different types of waste from food industry, mainly olive oil mills and industries, and wineries. The vegetable and fruit samples were stored in the freezer at -18ºC and the waste samples from agri-food industry were stored in the refrigerator at 4ºC. In the table 1, there is a list of the samples analysed and the code used to identify them.
Table 1. Samples analysed, and code used to identify them.
Sample Code of the sample
Oil waste (Faiges, January) OW1
Oil waste (Albelda) OW2
Oil waste (Borges) OW3
Oil waste (Faiges, March) OW4
Winery waste (white wine) (Torres winery) WW3
Winery waste (before distillation) WW4
Winery waste (after distillation) WW5
Spinach V1 Broccoli V2 Kale V3 Celery V4 Carrot V5 Beet V6 Orange F1 Kiwi F2 Strawberry F3 White grape F4 Black grape F5
5.3.
I
NSTRUMENTATIONVibra mix R stirrer from Ovan was used to shake the samples. Branson 5510 ultrasonic bath was used to sonicate the samples and Labofuge 400 Heraeus centrifuge was used to centrifugate the samples. All these instruments were used in the extraction process.
Sartorius TE214S analytical balance was used to weight all standards and samples (±0.0001 g). Basic 20pH-meter from Crison for the preparation of a phosphate buffer.
Tectron S473-100 thermostatic bath from P.Selecta was used to incubate reagents or to control the temperature during a reaction.
Perkin Elmer UV/Vis/NIR spectrometer Lambda 19 connected to Peltier system to control the temperature was used for the TEAC assay spectrophotometric measurements. Fluorescence
14 Segués Codina, Anna
spectrometer CARY ECLIPSE from Agilent Technologies was used to realize the ORAC assay fluorescence measurements. Diode array (DAD) spectrometer Agilent 8453 was used to realize the Folin-Ciocalteu assay spectrophotometric measurements. A 10x10 mm pathlength quartz cuvette was used to realize all the measurements.
The HPLC system used was an Agilent Series 1100 HPLC chromatograph from Agilent Technologies with a quaternary pump, an injection system, a diode array detector and a fluorescence detector. All these components were from 1100 series except the automatic injector that belongs to the 1200 series. The software used to instrumental control and data processing was an Agilent ChemStation for LC. A Kinetex C18 column (100mm x 4.6 mm id, particle size 2,6 µm) was used for the chromatographic separation.
5.4.
M
ETHODS5.4.1. Extraction of polyphenols from samples
To start with the extraction procedure, 1 g of solid sample was dispersed in 20 ml of methanol/water/hydrochloric acid (80:19.9:0.1). Then the samples were sonicated for 30 minutes at room temperature in an ultrasonic bath and were centrifugated during 5 minutes at 3500 rpm. The next step was to filter the resulting supernatant of the samples with a 0,45 µm nylon filter.
5.4.2. Colorimetric analysis of polyphenols by Folin-Ciocalteu assay
Gallic acid is used as standard compound to build a calibration curve for a concentration range from 1 ppm to 20 ppm. A 50ppm standard solution of gallic acid was prepared with MeOH/H2O (50:50).
To prepare the standard solutions, 1 ml of water and 250 µl of Folin-Ciocalteu’s reagent are placed in an amber glass vial. After 8 minutes, 75 µl of 7.5% Na2CO3 aqueous solution and an
appropriate volume of gallic acid to reach the expected concentration are added to the vial. Afterwards, Mili-Q water is added up to the 5 ml final volume.
In the case of the samples, the same procedure is followed substituting the gallic acid solution by the sample extract. The volume of extract ranges from 0,3 to 2 ml, depending on the concentration of polyphenols in the samples. When required, samples extracts are diluted with water.
5.4.3. Colorimetric analysis of polyphenols by TEAC assay
Trolox reagent (6-hydroxy-2,5,7,8-tetramethylchroman-2-carboxylic acid) (figure 4) is used as standard compound to make a calibration curve for a concentration range from 3 µM to 30 µM. A 2,5 mM stock solution of Trolox is prepared with ethanol, because it is not soluble in water, and it is stored in the refrigerator at 4ºC. The stock solution is diluted daily with ethanol to obtain a 500 µM working solution of Trolox.
Figure 4. Troloxstructure.
The ABTS˙+ is generated with the reaction of ABTS with an oxidant (potassium
peroxodisulfate). For this purpose, 20 ml of a 7 mM solution of ABTS are mixed with 350 µl of a 140 mM solution of potassium peroxodisulfate. This mixture is kept in the dark at least for about 16 hours before use. The radical solution is stable for a few days and it must be stored in the dark. A working solution is prepared daily adding 300-400 µl of radical in 12 ml of ethanol. This dilution factor can change in order to obtain a value of the blank absorbance of about 0,7-0,8. The blank is made with the radical and ethanol.
The reaction takes place in the measuring cuvette. For this purpose, 1500 µl of ABTS˙+, a
volume of ethanol and from 0 to 150 µl of Trolox are added to the cuvette. Ethanol is added up to 2,5 ml final volume.
In the case of the samples, the same procedure is followed substituting the Trolox by the sample extract. The volume of sample added is 75 µl. The samples with a higher concentration of polyphenols are diluted with methanol/water/hydrochloric acid (80:19,9:0,1).
The absorbance values are measured after 25 minutes at 734 nm at 30ºC with an UV-Vis spectrometer connected to a Peltier temperature controller.
16 Segués Codina, Anna
5.4.4. Fluorometric analysis of polyphenols by ORAC assay
Trolox reagent is used as standard compound to obtain a calibration curve for a concentration range from 0,1 µM to 1 µM. A 2,5 mM stock solution of Trolox is prepared with phosphate buffer solution (PBS) (pH = 7,4) and it is stored in the refrigerator at 4ºC. The stock solution is diluted daily with PBS to obtain a 25 µM working solution of Trolox.
The PBS solution is prepared with NaH2PO4 · H2O and Na2HPO4 to a concentration of 75 nM
and a pH of 7,4.
Fluorescein is used as the target protein. A 120 mM stock solution of fluorescein is prepared in PBS and it is stored in the refrigerator at 4ºC. The stock solution is diluted daily with PBS to obtain a 120 nM solution. A 40 mM AAPH solution is prepared daily with PBS.
The reaction takes place in the measuring cuvette. For this purpose, 1500 µl of the solution of fluorescein, a volume of PBS and Trolox are placed in the cuvette. The cuvette is preincubated during 15 minutes at 37ºC. Afterwards, 750 µl of the AAPH solution are added and the reaction starts. In the case of the samples, the same procedure is followed substituting the Trolox for the sample extract.
The fluorescence measurements are made with a fluorescence spectrometer every 5 minutes until the values are stabilized. The fluorescence intensity is measured at λex = 489 nm
and λem = 512 nm. The stabilization can last 140 minutes or even more, depending on the
concentration of polyphenols or Trolox in the solution.
5.4.5. Chromatographic analysis of polyphenols.
The HPLC separation was performed with a Kinetex C18 column (100mm x 4.6 mm id, particle size 2,6 µm), using an elution gradient (table 2). Mobile phase A was composed of 0,1% of formic acid aqueous solution and mobile phase B was composed of acetonitrile. The flow rate was 1ml/min and the injection volume was 5 µl. Chromatograms were recorded at 280, 310 and 370 nm.
0 – 25 5 % → 50%
25 – 27 50% → 90%
27 – 29 90%
29 – 29,2 90 → 5%
18 Segués Codina, Anna
6.
R
ESULTS AND DISCUSSIONS
6.1.
S
PECTROMETRIC ANALYSIS OF POLYPHENOLS IN AGRI-
FOOD WASTES6.1.1. Determination of polyphenols by Folin-Ciocalteu assay
F-C assay quantifies the total content of polyphenols by a colorimetric determination using gallic acid as the standard to build calibration curves. As the concentration of polyphenols goes up the coloration of the F-C reagent gets darker, as is shown in the figure 5.
Figure 5. Changes of colour of F-C reagent present in gallic acid standards and two samples.
The standard curves were obtained in a range from 5 to 20 mg L-1. The equation of one of the
curves built was:
A= 0,0386C + 0,0107 R2 = 0,9948
The measurements of standard solutions and sample extracts were made in duplicate. Table 3 shows the results, which are expressed in mg of gallic acid kg-1. Firstly, there is the data of the
two replicates and in brackets the average values.
Table 3. Results of the F-C assay.
Sample Concentration of polyphenols
[mg gallic acid kg-1]
OW1 867 849 (858)
OW2 4498 4426 (4462)
OW3 2642 2664 (2653)
WW2 5491 5445 (5468) WW3 150 156 (153) WW4 2210 2281 (2246) * WW5 1933 1948 (1941) * V1 431 461 (446) V2 321 341 (331) V3 522 577 (549) V4 163 183 (173) V5 125 129 (127) V6 797 732 (764) F1 271 273 (272) F2 551 540 (545) F3 609 605 (607) F4 3259 3370 (3314) F5 818 768 (793)
* liquid samples expressed in mg L-1
Oil and winery wastes have the highest F-C indexes, which correspond to the highest concentration of polyphenols. However, there is certain variability in the results of the same type of sample which could be caused by different origin of the samples, various types of samples, different treatment… The winery waste from red wine (Torres winery) (WW2) and the oil waste (Albelda) (OW2) are the samples with higher concentration of polyphenols.
Fruit and vegetable extracts have a lower F-C index than oil and winery wastes, apart from black grape (F4) which has a high concentration. White grape (F5) and beet (V6) are the following most concentrated vegetal origin samples but with a significant difference with F4.
20 Segués Codina, Anna
6.1.2. Determination of polyphenols by TEAC assay
TEAC assay determines the total content of polyphenols by measuring the absorbance of the ABTS radical in a solution with antioxidants compared with a solution with Trolox, which is used as standard.
Some preliminary experiments were done to establish appropriate conditions for the assay. Figure 6 shows the initial UV-Vis measurements of Trolox standards in a range from 5 to 30 µM. The measures at 734 nm were done every 5 minutes for 30 minutes to observe the reaction profile. Firstly, the absorbance increases considerably however, as time goes by the growth is slower until the stabilization is reached.
It can be considered that at 25 minutes the curves are stabilized, and the following measurements were done at this time.
Figure 6. Preliminary measurements of Trolox standards.
The standard curve of Trolox was obtained in a range from 3 to 30 µM. The equation of the curve was: A= -0,0289 C + 0,9938 R2 = 0,9974 0 0,2 0,4 0,6 0,8 1 1,2 0 500 1000 1500 2000 Ab sor ba nce Time [s]
Mesuraments of Trolox standards of TEAC assay
5 µM 10 µM 15 µM 20 µM 25 µM 30 µM
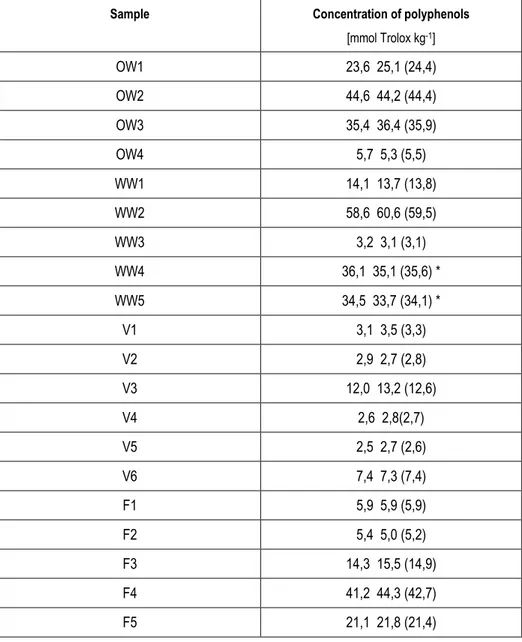
Table 4. Results of the TEAC assay.
Sample Concentration of polyphenols
[mmol Trolox kg-1] OW1 23,6 25,1 (24,4) OW2 44,6 44,2 (44,4) OW3 35,4 36,4 (35,9) OW4 5,7 5,3 (5,5) WW1 14,1 13,7 (13,8) WW2 58,6 60,6 (59,5) WW3 3,2 3,1 (3,1) WW4 36,1 35,1 (35,6) * WW5 34,5 33,7 (34,1) * V1 3,1 3,5 (3,3) V2 2,9 2,7 (2,8) V3 12,0 13,2 (12,6) V4 2,6 2,8(2,7) V5 2,5 2,7 (2,6) V6 7,4 7,3 (7,4) F1 5,9 5,9 (5,9) F2 5,4 5,0 (5,2) F3 14,3 15,5 (14,9) F4 41,2 44,3 (42,7) F5 21,1 21,8 (21,4)
22 Segués Codina, Anna
As F-C results, olive oil and winery wastes have the highest total content of polyphenols, in special winery waste from red wine (Torres winery) (WW2) and the oil waste (Albelda) (OW2). Fruits and vegetables have less concentration of polyphenol in exception of black grape (F4).
6.1.3. Determination of polyphenols by ORAC assay
The ORAC assay quantifies the total content of polyphenols by measuring the fluorescence decay of fluorescein with time. The presence of antioxidants in the solution delays or stops the reaction. It is a kinetic method where the reactions are monitored until the fluorescence curve is stabilized. When is represented the variation of the fluorescence with time, the area under the curve is correlated with the concentration of antioxidants.
Firstly, some preliminary experiments were done with the purpose to establish the appropriate conditions. Three standard solutions of Trolox, in a range from 0,1 to 1 µM, and the OW4 sample were measured. The results are shown in the figure 7.
Figure 7. Fluorescence decay curves obtained by ORAC assay. 0 0,2 0,4 0,6 0,8 1 1,2 0 2 0 4 0 6 0 8 0 1 0 0 1 2 0 1 4 0 1 6 0 F/F 0 Time [min]
Fluorescence curves of ORAC assay
0,1 µM 0,5 µM 1 µM OW4
Times from 100 to 140 minutes, doing measures every 5 minutes, were spent quantifying each sample which make this method unfeasible and cumbersome. Times of analysis are high because it is hard to reach the stabilization of the curve. In addition, the determination of the TAC values, which is done integrating the area below the curve, is unusual and impractical. For these reasons, this assay is not operative for routine measurements with the equipment used. As a result, the following measurements were not done, and a calibration curve was not built.
6.2.
C
OMPARISON OFF
OLIN-C
IOCALTEU ANDT
EACR
ESULTS.
There is certain controversy with the results obtained by the different assays because it is not known if they provide equivalent information. For example, the units used for the results of F-C and TEAC are referred to different standard substances. For this reason, the relation between the results of the two methods was studied.
In figure 8 is shown the correlation between F-C and TEAC results. The ORAC assay results will not beregarded for the reasons exposed in the section 6.1.3.
It can be considered that there is a good correlation between the two assays because the R2
is 0.8893. Therefore, the information obtained with both assays is quite similar.
In addition, most signals are grouped in pairs of two which mean that there isn’t a lot of dispersion between replicates of a sample.
24 Segués Codina, Anna
Figure 8. Correlation between F-C and TEAC results.
6.3.
A
NALYSIS OF POLYPHENOLS IN AGRI-
FOOD WASTES BYHPLC
HPLC is well established and widely used in this type of determinations. The analysis was done to determine the chromatographic profiles of the great variety of samples and to use that data to compare it with the results of the antioxidant assays.
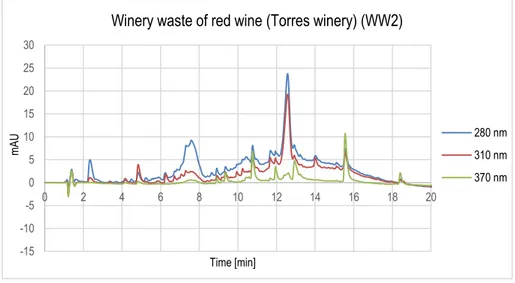
In the following figures are shown the chromatograms at 280, 310, 370 nm of the extracts of an oil and winery waste, a vegetable and a fruit, respectively.
Different families of polyphenols appear in different time windows in the chromatogram. • Hydroxybenzoic acids: from 3 to 7 minutes.
• Hydroxycinnamic acids from 7 to 10 minutes. • Flavonoids: from 13 to 18 minutes.
In figure 9, there is the chromatogram of OW2 sample. The signals observed are mainly in the range of hydroxybenzoic acids.
Figure 9. Chromatogram of oil waste from Albelda cooperative (OW2).
In figure 10, is shown the chromatogram of WW2 extract. There are lots of signals, mainly in the range of flavonoids.
Figure 10. Chromatogram of winery waste of red wine sample (WW2).
In figure 11, there is the chromatogram of V1 sample. Various signals mostly in the range of flavonoids can be observed in this graph. There is a signal near 16 minutes which it is known that corresponds to quercitin compound.
-20 -10 0 10 20 30 40 50 60 0 2 4 6 8 10 12 14 16 18 20 m AU Time [min] 280 nm 310 nm 370 nm -15 -10 -5 0 5 10 15 20 25 30 0 2 4 6 8 10 12 14 16 18 20 m AU Time [min]
Winery waste of red wine (Torres winery) (WW2)
280 nm 310 nm 370 nm
26 Segués Codina, Anna
Figure 11. Chromatogram of spinach sample (V1).
In figure 12 is shown the chromatogram of F1 sample. There are various signals mainly in the range of flavonoids.
Figure 12. Chromatogram of orange sample (F1).
It can be observed that the signals of each chromatogram are quite different because the composition of the samples is highly complex and different for each extract, even in the same type of samples. -20 -10 0 10 20 30 40 50 60 0 2 4 6 8 10 12 14 16 18 20 m AU Time [min]
Orange (F1)
280 nm 310 nm 370 nm -2 3 8 13 18 23 28 33 2 4 6 8 10 12 14 16 18 20 22 24 26 28 m AU Time [min]Spinach (V1)
280 nm 310 nm 370 nmdesign or select procedures to provide maximum relevant information by analysing chemical data. Multivariate analysis is applied to correlate results from HPLC and TAC assays.
7.1.
P
RINCIPAL COMPONENT ANALYSIS OFHPLC
DATAPrincipal component analysis (PCA) is a chemometric technique which reduces a large set of variables to a small set that still contains most information of the initial set. The scores graph shows the distribution of the samples in the space of principal components (PC). PC are mathematic variables which describe in the most efficient way the variation of real data.
A matrix with the data of the HPLC chromatograms was introduced for PCA analysis. The working range used goes from 100 to 3700 which means that there are 3600 measurements of absorbance at 310 nm for each chromatogram. These range corresponds from 0,66 minutes to 24,67 minutes of the scale of time. The dimension of the matrix is 40x3600 which comes from number of samples x number of measurements.
In figure 13 is shown the scores graph. The distribution of the signals in the chart indicate the similarity of the chromatographic profiles between samples. Four groups of samples can be identified.
Group one is formed for two oil waste extracts that have similar matrix. Groups 2 and 3 are constituted for all the vegetable and fruit samples and a couple of oil and winery waste samples. Group 4 is formed for two oil waste and one winery waste. It can be considered that this groups of samples have similar composition of polyphenols.
There is certain variability in the composition of antioxidants of the same type of sample and this is depicted in the scores representation. For example, there isn’t a group composed for all the wine waste samples. There are wine waste extracts in groups 1, 2 and 4.
On the other side, most replicates of the samples are situated near which mean that there isn’t a lot of dispersion between replicates.
28 Segués Codina, Anna
Figure 13. Scores from PCA of HPLC data.
7.2.
P
RINCIPAL LEAST SQUARES REGRESSION OF ANTIOXIDANT ASSAYSPrincipal least squares regression (PLS) is a method of multivariate calibration that finds the model which correlates X and Y components. X and Y matrixes are used to build the calibration model. A model of the two antioxidant assays studied was built.
In these two studies, the X matrix is constituted by the chromatograms with a working range from 100 to 3700 which means that there are 3600 measurements of absorbance at 310 nm for each chromatogram. The dimension of the X matrix is 40x3600 which comes fromnumber of samples x number of measurements. The Y matrix is formed by the F-C or TEAC results and it has a dimension of 40x1.
sample, in exception of the group of the left part of the chart which is constituted of vegetables, fruits and winery waste extracts. As it was observed in PCA, there isn’t a lot of dispersion between replicates.
Figure 14. Scores from PLS of F-C assay.
From PLS model, the F-C index was predicted. In figure 15 is shown the correlation between the measured values of F-C assay, and the predicted values by HPLC analysis. It can be considered that there is a very good correlation because the R2 is 0.9335. The slopevalue is
30 Segués Codina, Anna
Figure 15. Correlation between data predicted and measured by F-C assay.
7.2.2. PLS of TEAC data
For this PLS study were used 6 latent variables. Figure 16 shows the scores of TEAC assay. In the graph, as F-C one, there are many groups of samples formed for the same type of sample, in exception of the left group which consists in vegetables, fruits and winery waste extracts. As it was observed in PCA and PLS of F-C, there isn’t a lot of dispersion between replicates.
Figure 16. Scores from PLS of TEAC assay.
In figure 17 is shown the correlation between the TEAC measured values, and the predicted values by HPLC analysis. As the F-C assay, there is a very good correlation because R2 is 0.9238.
The slope value is nearly 1 which indicates that the predicted and the measured values are similar.
32 Segués Codina, Anna
The correlation with HPLC in F-C assay is better than in TEAC assay however the difference is not significant. These results point out that the F-C and TEAC values could be predicted successfully from the HPLC analysis values.
The information provided by HPLC is strongly related to the TAC assays data. The HPLC analysis are more complete because more information is obtained such as which components are present in the sample. However, the antioxidants assays are appropriate for simple characterization of polyphenol content in samples.
convenient method for the laboratory work than TEAC.
ORAC assay is not feasible for routine measurement due to its complexity. It is very sensitive to the experimental conditions, measurements take long times of analysis and data treatment is complex and laborious.
Although there is some controversy with the equivalence of the values obtained with each assay, it can be concluded that F-C and TEAC methods have a strong correlation.
In both assays, the extracts with more concentration of polyphenols are winery wastes and olive oil mills. Fruits and vegetables extracts have lower content of polyphenols, in exception of black grape (F4). The samples with most content of polyphenols are red wine from Torres winery (WW2) and oil waste from Albelda (OW2).
The chromatograms of HPLC analysis show that the composition of each sample is highly complex and different for every extract, even in the same type of sample.
PLS models show a satisfactory correlation between the information from the assays and HPLC. In addition, a very good correlation is observed between the data predicted by HPLC and the values of the antioxidants assays. Therefore, the TEAC and F-C values can be successfully predicted using HPLC results.
9.
R
EFERENCES AND NOTES
1. Haminiuk, C. W. I., Maciel, G. M., Plata-Oviedo, M. S. V. & Peralta, R. M. Phenolic compounds in fruits - an overview. Int. J. Food Sci. Technol. 47, 2023–2044 (2012). 2. Mermelstein, N. Determining Antioxidant Activity. Food Technol. 63–66 (2008). 3. Apak, R. et al. Methods of measurement and evaluation of natural antioxidant
capacity/activity (IUPAC Technical Report). Pure Appl. Chem. 85, (2013). 4. Pellegrini, N. et al. Total antioxidant capacity of plant foods, beverages and oils
consumed in Italy assessed by three different in vitro assays. J. Nutr. 133, 2812–2819 (2003).
5. Sun, Young; Yang, Chen; Tsao, R. Nomenclature and general classification of antioxidant activity/capacity assays. in Measurement of antioxidant activity and capacity (ed. Apak, Resat; Capanoglu, Esra and Shahidi, F.) 1–15 (Wiley, 2018). 6. Apak, R., Özyürek, M., Güçlü, K. & Çapanoʇlu, E. Antioxidant activity/capacity
measurement. 1. Classification, physicochemical principles, mechanisms, and electron transfer (ET)-based assays. J. Agric. Food Chem. 64, 997–1027 (2016).
7. Zulueta, A., Esteve, M. J. & Frígola, A. ORAC and TEAC assays comparison to measure the antioxidant capacity of food products. Food Chem. 114, 310–316 (2009). 8. Prior, R. L. Oxygen radical absorbance capacity (ORAC): New horizons in relating
dietary antioxidants/bioactives and health benefits. J. Funct. Foods 18, 797–810 (2015).
9. Stratil, P., Klejdus, B. & Kuban, V. Determination of Total Content of Phenolic Compounds and Their Antioxidant Activity in Vegetables s Evaluation of Spectrophotometric Methods. J. Agric. Food Chem. 54, 607–616 (2006). 10. Cano, Antonio; B. Arnao, M. ABTS/TEAC
(2,2’-azino-bis(3-ethylbenxothiazoline-6-sulphonic acid)/Trolox-Equivalent Antioxidant Capacity) radical scavenging mixed-mode assay. in Measurement of antioxidant activity and capacity (ed. Apak, Resat; Capanoglu, Esra; Shahidi, F.) 117–139 (Wiley, 2018).
10.
A
CRONYMS
LC: Liquid chromatography UV: UltravioletTAC: Total antioxidant capacity HAT: Hydrogen atom transfer SET: Single electron transfer
ORAC: Oxygen radical absorbance capacity
AAPH: 2,2’- azinobis(2-methyl-propionamidine) dihydrochloride F-C: Folin-Ciocalteu
TEAC: Total antioxidant capacity
ABTS: 2,2’-azino-bis(3-ethylbenxothiazoline-6-sulfonic acid) DAD: Diode array detector
HPLC: High pressure liquid chromatography UV-Vis: Ultraviolet visible
PBS: Phosphate buffer solution PCA: Principal components analysis PC: Principal components
PLS: Principal least squares LV: Latent variables


![Figure 7. Fluorescence decay curves obtained by ORAC assay. 00,20,40,60,811,202 04 06 08 01 0 01 2 01 4 0 1 6 0F/F0Time [min]](https://thumb-eu.123doks.com/thumbv2/123dokorg/4443805.30264/30.629.50.558.406.734/figure-fluorescence-decay-curves-obtained-orac-assay-time.webp)


![Azizi, UHF RFID Transponders Antenna Design for Metal and Wood Surfaces, IEEE International Conference on RFID, 2009 [4] C](data:image/gif;base64,R0lGODlhAQABAIAAAP///wAAACH5BAEAAAAALAAAAAABAAEAAAICRAEAOw==)