O(
3P
)
1
CS(
X
1S
1)
˜
CO(
X
1S
1)
1
S(
3P
) reaction useful for kinetic
and dynamical studies
Miguel Gonza´lez,a)J. Hijazo, J. J. Novoa, and R. Sayo´sa)
Departament de Quı´mica Fı´sica, Facultat de Quı´mica, Universitat de Barcelona, Martı´ i Franque`s, 1, 08028 Barcelona, Spain
~Received 5 March 1996; accepted 16 September 1996!
A total of 816 ab initio points at the PUMP4/6-311G(2d) level were used to derive an analytical expression for the lowest 3A
8
adiabatic potential energy surface ~PES! of the reaction O~3P!1CS~X1S1!→CO~X1S1!1S~3P!. Thermal rate constants calculated using the variational transition state theory and semiclassical tunneling correction were used as a tool to determine the optimum analytical surface. This was done by comparing the calculated rate constant at room and lower temperatures with the experimental values. The best analytical surface~PES 3! reproduces the rate constant at low temperatures well. However, it has not been possible to obtain an analytical PES capable of reproducing both the rate constant at 300 K and the activation energy~150–300 K range!. At higher temperatures, the contribution of the lowest3A9
adiabatic potential energy surface to the rate constant seems to be important to reproduce the experimental data. At present, the PES 3 is the most suitable analytical surface to be used for kinetic and dynamical single surface studies. © 1996 American Institute of Physics.@S0021-9606~96!03847-0#I. INTRODUCTION
The reaction between atomic oxygen and carbon mono-sulfide,
O~3P!1CS~X 1S1!→CO~X 1S1!1S~3P! DH0
05286.766.1 kcal/mol,
has been the object of considerable interest because it is the primary source of vibrationally excited CO in the CO chemi-cal laser. This laser was first detected by photolyzing a CS2/O2mixture in a laser cavity.1Measurements of the CO
vibrational distribution from this reaction at thermal reactant energies have been reported by several authors using a vari-ety of techniques.2–10 These experiments indicate the exist-ence of a peak at the twelfth or thirteenth vibrational level, with levels populated up to the thermodynamical limit.
The rate constant at room temperature~300 K! has been measured by several authors with good agreement among the reported values @~12.963.1!31012 cm3mol21s21#.11 The temperature dependence of the rate constant is not as well established, as it only relies on a single experimental work that considers the 150–300 K temperature interval,12a range where a curvature in the Arrhenius plot was followed. On the basis of these measurements, recommended values of the preexponential factor @A5~16.366.8!31013 cm3mol21s21# and the activation energy ~Ea51.560.5 kcal/mol! are re-ported in a review of kinetic data.11
The relative CO rotational populations at different vibra-tional levels of the molecule have recently been measured,13–15using laser induced fluorescence detection, in experiments which used thermal and hot~hyperthermal! oxy-gen atoms. Analyses of Doppler profiles have also permitted
the study of the correlations between the relative velocity vector of reactants ~k!, the relative velocity vector of prod-ucts ~k
8
!, and the rotational angular momentum vector of products~J8
!, showing only a negative k8
2J8
angular corre-lation. This means that the CO molecule is produced with J8
preferentially perpendicular to k8
.There are only a few theoretical studies on this reaction. In an earlier paper16we presented a quasiclassical trajectory ~QCT! study on a semiempirical analytical potential energy surface~PES! which fitted MNDO/CI stationary points of the
3
A
8
PES. In that work a nonlinear OCS minimum and a collinear transition state ~TS! were adjusted. The QCT CO vibrational distribution was in agreement with the experi-mental one, but the rate constant at room temperature was very low @~0.460.1!31012 cm3mol21s21# in comparison with the experimental value. In a recent paper17 we have carried out an ab initio study on the lowest adiabatic3A8
and3A
9
PES of this system. This work has allowed us tocharac-terize the most relevant properties of the stationary points of both surfaces, and to select a suitable method and basis set to produce dense grids of ab initio points, accurate enough to be used in the construction of analytical representations of the lowest3A
8
and3A9
PES. The first one of these analytical PES is presented in this work.II. POTENTIAL ENERGY SURFACE A. Ab initio calculations
Three adiabatic PES, one of3A
8
and two of3A9
symme-try, are involved in this reaction. The lowest energy3A8
and3A
9
adiabatic surfaces on the reactant’s side come fromavoided crossings between the diabatic surfaces arising from the O~3P!1CS~X1S1! and O~3P!1CS~a3P! states, the ground and excited states of reactants, respectively.
larly, on the product’s side they come from the ground S~3P!1CO~X1S1! and excited S~3P!1CO~a3P! states of products. Different ab initio methods @MP4, MCSCF, CIPSI-3, CCD1ST4~CCD!, etc.# and standard basis sets have been used to characterize the stationary points on both surfaces.17 From these calculations, it appears that: ~a! the
3
A
8
PES always lies energetically below the 3A9
PES al-though not far away from it; ~b! nonlinear OCS transition states have been found on both surfaces;~c! a very shallow nonlinear OCS minimum ~not bound if the zero point vibra-tional energy is included! has been found on the3A8
PES;~d! the wave function is mostly single determinantal in nature at all the stationary points of both PES, and the unrestricted fourth order Mo”ller–Plesset ~UMP4! method is accurate enough to be used for the calculation of the large number of ab initio points required in the fitting procedure to obtain an analytical expression for the PES.Over 990 points have been calculated to obtain a dense grid at all relevant portions of the lowest 3A
8
PES at the projected unrestricted fourth order Mo”ller–Plesset ~PUMP4! level using the standard 6-311G(2d) basis set. The PUMP4 method has been chosen to eliminate the small spin contami-nations which have appeared in some regions of this surface. TheGAUSSIAN 92suite of programs18has been used in all the computations. The calculated points span the range 0.9<RCO<2.5 Å, 1.25<RCS<2.65 Å, /OCS5165°, 145°,125°, 105°, 85°. Moreover, 31 points for the CO energy curve and 38 points for the CS energy curve have also been computed to obtain a fully ab initio surface for this system. The calculation of each triatomic point takes around 42 min on a CRAY Y-MP 232 computer and 2 h on an IBM RS/ 6000 3BT workstation. Table I gives the properties of the stationary points at the PUMP4 level. The PUMP4 geometry of the transition state has been obtained by interpolation within a grid of ab initio points calculated around the region where the TS is located. Its geometry differs only slightly from the UMP4 one,17 although the PUMP4 energy barrier ~2.26 kcal/mol! is much lower than the UMP4 value ~5.57 kcal/mol!.
As shown in our previous paper,17the barrier height for this reaction is quite dependent on the method and basis set used. In addition, the barrier shows a clear tendency to di-minish as the quality of the ab initio method and the basis set is increased~Table II!. A much better search of the TS at the largest basis set, by optimizing the geometry, would prob-ably lead to a lower energy barrier. The introduction of an
estimate of the basis set superposition error ~BSSE! by means of the counterpoise method,20 originates an energy barrier increase of about 2 kcal/mol for each basis set~Table II!. Most of these values can be consistent with the experi-mental activation energy value~1.560.5 kcal/mol!.11 Never-theless, a small down scaling will be necessary in order to get an analytical 3A
8
PES suitable to be used in kinetic and dynamical studies. On the other hand, the use of a larger basis set, as the 6-311G(3d,2f ) one, implies a huge cost in disk space and computer time ~each triatomic point takes about 23 h on the abovementioned workstation! to calculate dense grids of points on this surface. However, the main features of the 3A8
PES would probably not change signifi-cantly, with the single exception of the barrier height. The exoergicity only changes from 290.6 to 290.3 kcal/mol when going from the 6-311G(2d) to the 6-311G(3d,2f ) basis set, while the experimental value is 287.4 kcal/mol.19B. Analytical fit
A many-body expansion21 has been used to obtain an analytical representation of the3A
8
potential energy surface, which can be written as:VOCS~R1,R2,R3!5V~2!CO~R1!1V~2!CS~R2! 1V~2!
SO~R3!1V~3!OCS~R1,R2,R3!, ~1! in which V~2! and V~3! are the two-body and three-body terms, respectively, and R1, R2, and R3are the CO, CS, and SO distances, respectively. In this equation, monoatomic terms V~1! have been omitted because all possible reaction channels for O~3P!1CS~X1S1! correlate with the atoms in their ground electronic states
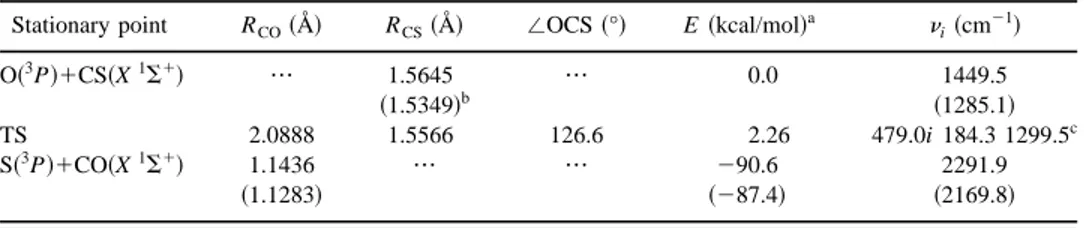
TABLE I. PUMP4/6-311G(2d) results for the3A8PES.
Stationary point RCO~Å! RCS~Å! /OCS ~°! E ~kcal/mol!
a n i~cm21! O~3P!1CS~X1S1! ••• 1.5645 ••• 0.0 1449.5 ~1.5349!b ~1285.1! TS 2.0888 1.5566 126.6 2.26 479.0i 184.3 1299.5c S~3P!1CO~X1S1! 1.1436 ••• ••• 290.6 2291.9 ~1.1283! ~287.4! ~2169.8! a
Energies do not include zero point energy.
bExperimental values between parentheses~Ref. 19!. cFrequencies at the UMP4/6-311G(2d) level.
TABLE II. Ab initio energy barriers for the O~3P!1CS~X1S1! reaction on the3A8PES.
UMP4
Energy barrier~kcal/mol!a
PUMP4/BSSE
UMP4/BSSE PUMP4
6-311G(2d) 5.32 7.04 2.26 4.02
6-311G(3d,2f ) 2.84 5.27 20.43 2.06
aZero of energy taken in reactants. Zero point energies are not included. In
O~3P!1CS~X 1S1! →CO~X 1S1!1S~3P!, →SO~X 3S2!1C~3P!, →O~3P!1C~3P!1S~3P!. ~2a! ~2b! ~2c! Extended Rydberg potentials up to the fifth order have been used to describe the two-body interactions ~diatomic molecules! in Eq. ~1!, for the CO and CS diatomic curves:
V~2!~R!52De•~11a1•r1a2•r21a3•r3
1a4•r41a5•r5!•e2a1•r, ~3!
in which Deand Re are the dissociation energy and equilib-rium bond length of the diatomic molecule, respectively, and
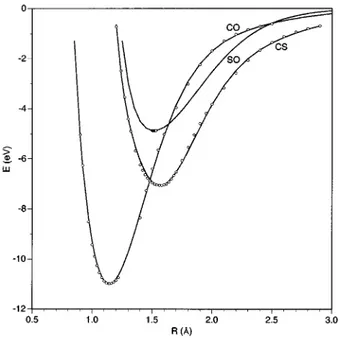
ris defined as being equal to R2Re. The parameters aihave been determined by means of a nonlinear least squares procedure,22using the corresponding ab initio points~31 and 38 points for CO and CS, respectively!. Figure 1 depicts both the ab initio data and fitted energy curves of the three di-atomics. For the SO molecule the PUMP4 method is not suitable, as the wave function must be described with more than a single determinant, as occurs in the case of the iso-electronic O2 molecule. Thus, in the SO case only a few points~8! around the equilibrium distance and the dissocia-tion energy have been included in this fit, using an extended Rydberg potential only up to the third order. Nevertheless, as the aim of this work is the study of reaction~2a!, the lower
accuracy in the description of the SO diatomic does not rep-resent a serious difficulty. Moreover, as the experimental en-doergicity of reaction ~2b! is 46.2 kcal/mol,19 this second reaction channel will be closed under the usual experimental conditions. The root-mean-square ~RMS! deviations for the diatomic energy curves of CO, CS, and SO are 0.081, 0.087, and 6.031026 eV, respectively. The optimum extended Rydberg parameters of each molecule are given in Table III. The three-body term consists of a fourth order polyno-mial expressed in terms of three variables ri @ri5Ri2Ri0, where the reference structure (R10,R20,R30) has been taken as
equal to the TS geometry#, and a range function T(R1,R2,R3) which cancels the three-body term as one of
the three atoms is separated from the other ones
VOCS~3!~R1,R2,R3!5P~r1,r2,r3!•T~r1,r2,r3!, ~4! where P~r1,r2,r3!5V0
S
11(
i, j ,k50 1<i1 j1k<4 ci j kr1 ir 2 jr 3 kD
, ~5!being i, j, and k positive integer numbers, and T~r1,r2,r3!5
)
i51
3
F
12tanhS
giri2
DG
. ~6!The 38 three-body parameters (V0,$ci j k%,$gi%) have been determined by a weighted nonlinear least squares procedure23 using the following ab initio data: ~a! energy, geometry, and harmonic force constants of the ab initio TS, and~b! a total of 739 ab initio points within the abovemen-tioned triatomic geometrical intervals and with energies up to 2.0 eV over reactants. The inclusion of points with higher energies worsened the adjustment and, in fact, is not neces-sary for the study of reaction~2a! at the usual experimental conditions, thermal ~300 K! or hot energies ~relative transla-tional energy of 0.16 eV!.13–15Moreover, the energy barrier has been scaled to reproduce as closely as possible the ex-perimental rate constant at 300 K and the activation energy, when these properties have been calculated using the varia-tional transition state theory ~see next section!.
About 150 analytical representations of the 3A
8
PES have been carefully analyzed in order to obtain the best fitted surfaces. In a first stage of the fit, an initial guess for the gi parameters has been used and the corresponding optimum polynomial parameters have been obtained by a linear least squares procedure. These parameters have later been used as input parameters in a nonlinear least squares procedure that leads to several analytical PES with smaller RMS deviations. In the last stage of the fitting procedure, a weighted nonlinear least squares procedure has been considered, taking as start-FIG. 1. PUMP4/6-311G(2d) ab initio points and the correspondingex-tended Rydberg curves for the diatomic molecules CS, CO, and SO. Zero of energy in separated atoms.
TABLE III. Diatomic potential parameters of the extended Rydberg functions.
Molecule De~eV! Re~Å! a1~Å21! a2~Å22! a3~Å23! a4~Å24! a5~Å25!
CO~X1S1! 10.9868 1.1436 4.9209 6.0804 20.7998 26.5760 10.4691
CS~X1S1! 7.0592 1.5645 4.8452 6.9633 20.2270 23.8552 13.4483
ing points the parameters of the previous PES.23 Weights different from 1.0~5.0, 10.0, or 25.0 depending on the PES! have been used at this stage, but only for seven ab initio points close to the TS, and for the energy and first partial derivatives~with respect to the OC and CS interatomic dis-tances and OCS angle! at the TS. This was necessary to scale the energy barrier of reaction~2a! to the three values finally selected. Three extra ab initio points for collinear OSC ge-ometries were similarly weighted to eliminate spurious minima in this region.
Second partial derivatives at the TS geometry have also been introduced in the fit by using very small weights~0.01!, because higher weight values greatly increased the RMS de-viations of the ab initio points. During the fit, additional ab initio points have also been calculated to better describe the regions of the surface where spurious minima appeared~e.g., in the OSC and SOC collinear regions!. For all analytical surfaces obtained, the spurious minima have been located and plots at different OCS angles have been carefully ana-lyzed. Spurious minima with energies lower than 1 kcal/mol have been considered negligible. In fact, these shallow minima have also been found in the ab initio calculations, at the entrance and exit valleys, with energies lower than 0.5 kcal/mol.
Three analytical 3A
8
potential energy surfaces ~PES 1, PES 2, and PES 3! have been selected from the fitting pro-cedure. Their main difference is the barrier height for reac-tion~2a!. Even though very different initial parameters have been considered in the fitting procedure, there has been a clear convergence to the three sets of optimum parameters here reported. The parameters for the three surfaces ~Table IV! and their equipotential contour diagrams ~Fig. 2! arevery close to each other. The surface plots show a smooth fit of the ab initio data for each OCS angle without spurious artifacts. In Figs. 2 and 3 the energetically favored nonlinear approach of the attacking oxygen atom to the C end of the CS molecule can also be seen. Reaction channel~2b! is ergetically forbidden at the usual experimental collision en-ergies. Table V shows the differences between these3A
8
ana-lytical PES and the quality of their fit. In general, the RMS deviations for each OCS angle in these surfaces are very close to each other. Moreover, when the RMS deviations for different intervals of energy between reactants and up to 2 eV over them are calculated, the values are almost constant for each energy range and surface. Thus, these surfaces show a homogeneous goodness in all regions which are fitted. The total RMS deviation is around 3 kcal/mol, a value that is quite good in comparison with the estimated accuracy of the ab initio data, evidenced by comparing the ab initio energy barrier and the exoergicity of reaction ~2a! with the corre-sponding experimental data.A comparison of the best analytical representations for the 3A
8
PES obtained in this work with the earlier one16 shows two important differences, which will probably modify to a large extent the calculated kinetics and dynamics of this reaction: ~a! the new3A8
PES initially favors a non-linear O-C-S approach instead of the colnon-linear one found for the earlier surface;~b! the new3A8
surface does not present a nonlinear stable OCS minimum, which had a strong influ-ence in the kinetic and dynamical properties of reaction ~2a! on the earlier surface. Only a very shallow minimum with no TS in the exit channel has been found in the present ab initio calculations, and it has not been reproduced in the new ana-lytical 3A8
surfaces.TABLE IV. Three-body parameters of the best analytical representations of the3A8PES: PES 1, PES 2, and
PES 3.
PES 1 PES 2 PES 3 PES 1 PES 2 PES 3
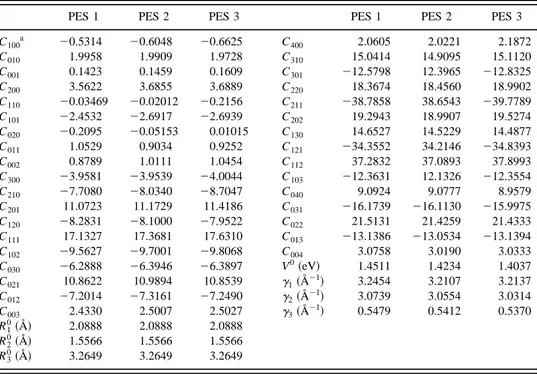
C100a 20.5314 20.6048 20.6625 C400 2.0605 2.0221 2.1872 C010 1.9958 1.9909 1.9728 C310 15.0414 14.9095 15.1120 C001 0.1423 0.1459 0.1609 C301 212.5798 12.3965 212.8325 C200 3.5622 3.6855 3.6889 C220 18.3674 18.4560 18.9902 C110 20.03469 20.02012 20.2156 C211 238.7858 38.6543 239.7789 C101 22.4532 22.6917 22.6939 C202 19.2943 18.9907 19.5274 C020 20.2095 20.05153 0.01015 C130 14.6527 14.5229 14.4877 C011 1.0529 0.9034 0.9252 C121 234.3552 34.2146 234.8393 C002 0.8789 1.0111 1.0454 C112 37.2832 37.0893 37.8993 C300 23.9581 23.9539 24.0044 C103 212.3631 12.1326 212.3554 C210 27.7080 28.0340 28.7047 C040 9.0924 9.0777 8.9579 C201 11.0723 11.1729 11.4186 C031 216.1739 216.1130 215.9975 C120 28.2831 28.1000 27.9522 C022 21.5131 21.4259 21.4333 C111 17.1327 17.3681 17.6310 C013 213.1386 213.0534 213.1394 C102 29.5627 29.7001 29.8068 C004 3.0758 3.0190 3.0333 C030 26.2888 26.3946 26.3897 V 0~eV! 1.4511 1.4234 1.4037 C021 10.8622 10.9894 10.8539 g1~Å21! 3.2454 3.2107 3.2137 C012 27.2014 27.3161 27.2490 g2~Å21! 3.0739 3.0554 3.0314 C003 2.4330 2.5007 2.5027 g3~Å21! 0.5479 0.5412 0.5370 R1 0~Å! 2.0888 2.0888 2.0888 R2 0~Å! 1.5566 1.5566 1.5566 R3 0~Å! 3.2649 3.2649 3.2649 aC i jkunits in Å2(i1 j1k).
III. CALCULATION OF THERMAL RATE CONSTANTS
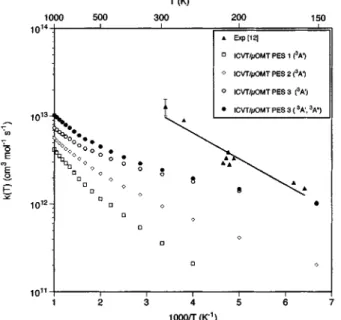
The rate constants for reaction~2a! have been calculated, within the 150–1000 K temperature range, using the conven-tional transition state theory~TST! and variational transition state theory ~VTST! with semiclassical tunneling, as imple-mented in the POLYRATE program.24 VTST rate constants have been computed using the improved canonical varia-tional theory~ICVT!. Tunneling corrections have been taken into account by means of the microcanonical optimized mul-tidimensional tunneling method ~mOMT!, although differ-ences with the small curvature tunneling method ~SCT! are very small. Table VI shows the rate constants at 200 and 300 K computed using the three ab initio analytical3A
8
PES, andthe previous MNDO/CI based analytical surface.16For each analytical PES, the rate constants calculated with the differ-ent levels of the transition state theory are quite close to each other, due to the shape of the PES and to the heavy atoms involved. The ICVT/mOMT values are, however, in general slightly better when compared with the experimental values. The PES 3 surface produces the best rate constants in the 150–300 K interval. At 300 K only a factor of 2 below the experimental data occurs. This result is much better than the earlier one obtained from the MNDO/CI surface ~where a factor of 50 was found16!. However, if it is assumed that only the lowest surface among the three which connect reactants with products~one3A
8
and two3A9
! contributes to the reac-FIG. 2. Equipotential contour maps of the PES 3 at several OCS angles:~a! 180°, ~b! 165°, ~c! 125°, and ~d! 85°. The contours are in 0.5 eV intervals with the zero of energy taken in separated atoms.tivity, a statistical factor equal to 1/3 has to be included into the calculated rate constants and preexponential factors, such as the values are given in Table VI~see also Fig. 4!.
For all PES and methods the Arrhenius plot of the rate constants shows a curvature between 150 and 1000 K ~Fig. 4!. Table VI also gives the Arrhenius parameters in two tem-perature ranges: 150–300 K and 300–1000 K. PES 1 is the surface that best reproduces the experimental activation en-ergy in the interval 150–300 K. Nevertheless, it is necessary to take into account that only rate constants around 300 K have been measured. Only in one experimental work12were the rate constants at lower temperatures determined~Fig. 4! by means of a discharge flow system with mass spectrometer detection of CO product, and rather poor Arrhenius behavior was found. In fact, the Arrhenius parameters obtained from the experimental data shown in Fig. 4 ~A59.8231013
cm3mol21s21 and Ea51.35 kcal/mol! correspond to an r correlation coefficient of 0.944, indicating as well a small curvature which introduces an important error bar in the ac-tivation energy. In the same experimental work,12the 294 K rate constant was introduced twice. One value was measured monitoring the CS concentration and the other one by fol-lowing the CO concentration. This fact modified the
Arrhen-ius parameters appreciably @A5~15.762.4!31013
cm3mol21s21 and Ea51.560.3 kcal/mol#, improving slightly the quality of the fit~r50.948!. Comparison of these parameters with the experimental recommended ones,11 which included more rate constants at room temperature ~Table VI!, and with the calculated values for the three ana-lytical surfaces derived from ab initio calculations ~PES 1, PES 2, and PES 3! seems to indicate that even though PES 1 gives the activation energy closest to the recommended value, PES 3 could also furnish an activation energy consis-tent with the experimental data, once both the experimental and theoretical error margins are included.
A more accurate calculation of the rate constants would have to take into account the contribution of the two 3A
9
surfaces which connect reactants with products. In a previous study,17the energy difference between the3A8
and the lowest3A
9
surface was shown to be very small. As the lowest3A8
and3A
9
surfaces present on the whole a similar shape ~non-linear OCS transition states with similar geometries!, the dif-ferences in the energy barrier will be the main factor affect-ing the calculated rate constants. Thus, to evaluate the relative importance of the two lowest PES contributions to the thermal rate constant, the same ab initio and VTST method have been used for these surfaces.First and second partial derivatives with respect to the interatomic distances are necessary to calculate ICVT rate constants. Even though the UMP4 or PUMP4 methods are more appropriate for calculating absolute rate constants, as was shown in Sec. II, for relative rate constants UMP2 cal-culations can furnish a good estimate. Thus, minimum en-ergy paths for the two lowest surfaces have been obtained by means of the intrinsic reaction coordinate ~IRC! method.25 FIG. 3. Equipotential contour maps of the PES 3 for the O to CS approach
with RCS51.5645 Å. The CS molecule lies along the X axis at Y50 with its
center of mass at the origin.
TABLE V. Features of the best analytical representations of the3A8PES: PES 1, PES 2, and PES 3. TS properties
RCO~Å! RCS~Å! /OCS ~°! E ~kcal/mol!a ni~cm21!b
PES 1 2.0765 1.5547 128.1 1.16 197.3i 259.0 1379.7
PES 2 2.0770 1.5547 127.6 0.53 185.9i 264.0 1385.4
PES 3 2.0760 1.5553 126.8 0.085 177.4i 252.4 1389.3
RMS~eV! deviations of the fitted ab initio points at several OCS angles
85° 105° 125° 145° 165° Total
PES 1 0.1246 0.1171 0.1175 0.1389 0.1675 0.1332
PES 2 0.1256 0.1192 0.1172 0.1385 0.1669 0.1335
PES 3 0.1270 0.1232 0.1187 0.1380 0.1657 0.1344
aZero of energy taken in reactants. Zero point energies are not included.
Each path begins at each transition state with a step of 0.015 bohr. A total amount of 83 UMP2/6-311G(2d) ab initio points have been calculated, 41 for the 3A
8
PES and 42 for the lowest 3A9
PES, including first and second analytical derivatives ~this represents around 500 h on the abovemen-tioned workstation!. Figure 5 represents the3A8
/3A9
ratio of the ICVT/SCT rate constants at different temperatures. This ratio decreases from 46.3 at 150 K to 2.4 at 1000 K.The effect of this second surface~the lowest3A
9
PES! on the thermal rate constant calculation is shown in Fig. 4,where the third surface ~the first excited 3A
9
PES! is sup-posed not to be reactive. It was also assumed that the UMP2/ ICVT/SCT calculated rate constant ratios ~Fig. 5! are valid for the calculation of PUMP4/ICVT/mOMT rate constants. Thus, the effect of the lowest 3A9
PES is more important at higher temperatures. Adding this contribution to that of the3
A
8
PES, both multiplied by a factor equal to 1/3, it is not possible to adequately reproduce the rate constant at room temperature ~Fig. 4!. Calculated rate constants for PES 3 at 300, 200, and 150 K, estimating the contribution of the cor-responding lowest3A9
PES as indicated above, are equal to 2.4531012, 1.4831012, and 1.0331012 cm3mol21s21, re-spectively. At the lowest temperature considered, the agree-ment with the corresponding experiagree-mental value ~1.0231012 cm3mol21s21! is excellent, but as temperature increases the TABLE VI. Calculated TST and ICVT thermal rate constants and Arrhenius parameters for surfaces3A8PES1, PES 2, and PES 3, and experimental data.
~k300 K, k200 K!a
ab initio PES 1 ab initio PES 2 ab initio PES 3 MNDO/CI PES~Ref. 16!
TST ~0.336, 8.5131022! ~0.938, 0.399! ~2.08, 1.29! ~9.0931022, 2.5431022!
ICVT ~0.336, 7.9931022! ~0.907, 0.376! ~2.13, 1.32! ~8.7231022, 2.4931022!
ICVT/mOMT ~0.359, 9.2831022! ~0.947, 0.415! ~2.19, 1.41! ~9.0131022, 2.6931022!
Experimental~Ref. 11! ~12.963.1, 3.661.3!
ICVT/mOMT Arrhenius parametersa
150– 300 K A 1.13 1.11 1.17 7.8631022 Ea 1.44 0.91 0.46 1.32 300– 1000 K A 0.462 0.458 0.478 0.321 Ea 2.11 1.53 1.06 2.23 Experimental~Ref. 11! A516.366.8 Ea51.560.5 ~150–300 K!
aUnits: k/1012 cm3mol21s21, A/1013 cm3mol21s21, and E
a/kcal/mol. A statistical factor of 1/3 has been
included into the k and A values assuming at this stage that only the3A8surface contributes to the thermal rate
constants in the temperature intervals here considered.
FIG. 4. Arrhenius plots of O~3P!1CS→CO1S~3P! thermal rate constants:
experimental ~filled triangles! and ICVT/mOMT calculated values ~open symbols! for the3A8surfaces PES 1, PES 2, and PES 3. Filled circles show the calculated values introducing also the contribution of the lowest 3A9 PES. In all calculated cases a statistical factor of 1/3 is included for each surface~3A8or3A9!.
FIG. 5. Relative thermal rate constants for O~3P!1CS→CO1S~3P! on sur-faces3A8and3A9calculated using UMP2 ab initio points and the ICVT/ SCT method. Solid line shows an exponential fit whose equation is indicated in the plot.
accord progressively diminishes. From the UMP2 calcula-tions it appears that the3A
8
/3A9
rate constant ratio decreases from 46.3 to 8.4 between 150 and 300 K. Hence, the 3A8
surface contribution clearly dominates over the 3A9
one at this temperature range.VTST calculations indicate that the three optimal ana-lytical 3A
8
PES that have been determined in this work can-not simultaneously fit the experimental rate constant at room temperature ~300 K! and the activation energy ~150–300 K temperature range!. Additional and more accurate ab initio calculations on lowest 3A9
surface would be necessary to shed more light on this problem. On the other hand, the role of the second3A9
surface will probably be relevant at much higher temperatures than the ones here studied.IV. CONCLUDING REMARKS
In this work we have presented three analytical represen-tations of the 3A
8
adiabatic potential energy surface~PES 1, PES 2, and PES 3!, which fit 816 PUMP4/6-311G(2d) ab initio points and three different activation energies for the reaction O~3P!1CS~X1S1!→CO~X1S1!1S~3P!. These op-timal analytical surfaces show small RMS deviations in all adjusted regions and a smooth shape for all OCS angles. Variational transition state rate constant values of the PES 3 surface with semiclassical tunneling correction at room and lower temperatures ~300–150 K interval! are reasonably close to the experimental values, with excellent agreement at 150 K. After a great number of attempts, it has not been possible to obtain an analytical surface capable of simulta-neously reproducing both the rate constant at 300 K and the activation energy for the 150–300 K range of temperatures. The effect of the lowest3A9
surface on the thermal rate con-stant has to be considered at higher temperatures to compare in a meaningful way with the experimental data. The present results indicate that the PES 3 surface is a good candidate to be used for kinetic or dynamical studies on a single PES. A quasiclassical trajectory calculation on this surface is in progress, to study the CO vibrational distribution, several rovibrational distributions, and some vector correlations studied experimentally at 300 K and for hot ~hyperthermal! O~3P! atoms.ACKNOWLEDGMENTS
This work has been supported by the DGICYT Projects PB-92-0756 and PB-92-C0655-C02-02. J.H. thanks the
‘‘Ministerio de Educacio´n y Ciencia’’ of Spain for a ‘‘For-macio´n de Profesorado Universitario’’ Research Grant. The authors are also grateful to the ‘‘Centre de Supercomputacio´ de Catalunya~CESCA!’’ for supporting part of the computer time on a CRAY Y-MP 232.
1M. A. Pollack, Appl. Phys. Lett. 8, 237~1966!.
2G. Hancock and I. W. M. Smith, Chem. Phys. Lett. 3, 573~1969!. 3
G. Hancock, C. Morley, and I. W. M. Smith, Chem. Phys. Lett. 12, 193
~1971!.
4G. Hancock, B. A. Ridley, and I. W. M. Smith, J. Chem. Soc. Faraday II
68, 2117~1972!.
5K. D. Foster, J. Chem. Phys. 57, 2451~1972!.
6S. Tsuchiya, N. Nielsen, and S. H. Bauer, J. Phys. Chem. 77, 2455~1973!. 7
H. T. Powell and J. D. Kelley, J. Chem. Phys. 60, 2191~1974!.
8N. Djeu, J. Chem. Phys. 60, 4109~1974!.
9J. W. Hudgens, J. T. Gleaves, and J. D. McDonald, J. Chem. Phys. 64,
2528~1976!.
10D. S. Y. Hsu, W. M. Shaub, T. L. Burks, and M. C. Lin, Chem. Phys. 44,
143~1979!.
11
R. Atkinson, D. L. Baulch, R. A. Cox, R. F. Hampson, Jr., J. A. Kerr, and J. Troe, J. Phys. Chem. Ref. Data 21, 1125~1992!.
12H. V. Lilenfeld and R. J. Richardson, J. Chem. Phys. 67, 3991~1977!. 13
A. J. Orr-Ewing, D. Phil. thesis, Oxford University~1991!.
14F. Green, G. Hancock, and A. J. Orr-Ewing, Faraday Discuss. Chem. Soc.
91, 79~1991!.
15M. L. Costen, G. Hancock, A. J. Orr-Ewing, and D. Summerfield, J.
Chem. Phys. 100, 2754~1994!.
16R. Sayo´s, M. Gonza´lez, and A. Aguilar, Chem. Phys. 141, 401~1990!. 17
J. Hijazo, M. Gonza´lez, R. Sayo´s, and J. J. Novoa, Chem. Phys. Lett. 222,
15~1994!.
18
,M. J. Frish, G. W. Trucks, M. Head-Gordon, P. M. W. Gill, M. W. Wong, J. B. Foresman, B. G. Johnson, H. B. Schlegel, M. A. Robb, E. S. Re-plogle, R. Gomperts, J. L. Andres, K. Raghavachari, J. S. Binkley, C. Gonzalez, R. L. Martin, D. J. Fox, D. J. Defrees, J. Baker, J. J. P. Stewart, and J. A. Pople,GAUSSIAN-92, Revision D2, Gaussian, Inc., Pittsburgh, PA, 1992.
19K. P. Huber and G. Herzberg, Molecular Spectra and Molecular
Struc-ture. IV. Constants of Diatomic Molecules~Van Nostrand Reinhold, New York, 1979!.
20S. F. Boys and F. Bernardi, Mol. Phys. 19, 553~1970!.
21J. N. Murrell, S. Carter, S. C. Farantos, P. Huxley, and A. J. C. Varandas,
Molecular Potential Energy Functions~Wiley, New York, 1984!.
22R. Sayo´s and M. Gonza´lez,
DIATOMFIT~unpublished program!. 23M. Gilibert, M. Gonza´lez, and R. Sayo´s,
SM3FIT~unpublished program!. 24R. Steckler, W. Hu, Y. Liu, G. C. Lynch, B. C. Garrett, A. D. Isaacson, D.
Lu, V. S. Melissas, T. N. Truong, S. N. Rai, G. C. Hancock, J. G. Lau-derdale, T. Joseph, and D. G. Truhlar, Department of Chemistry and Su-percomputer Institute, University of Minnesota, Minneapolis, MN 55455,
POLYRATEprogram, version 6.5~1995!.
25