Descrittori
Pre-Test Analysis for an Experimental Campaign
in the Upgraded HE-FUS3 Loop
Tipologia del documento:
Rapporto Tecnico
Collocazione contrattuale:
Accordo di programma ENEA-MSE: tema di ricerca "Nuovo
nucleare da fissione"
Argomenti trattati: Generation IV reactors Reattori nucleari a gas Sicurezza nucleare Analisi incidentale
Sommario
On the basis of the results obtained in the 2009 experimental campaign conducted in the HE-FUS3 loop (CR BRASIMONE) within the framework of the first year of the AdP ENEA-MSE a new experimental campaign has been planned for the second year for the following reasons:
- the post-tests calculations performed with the RELAP5 codeshowed for some tests a lack of important information on the facility behaviour in transient conditions that would require the repetition of the tests with an upgraded instrumentation,
- new experimental tests conducted at higher pressure and mass f10wrate considering previous and additional transient scenarios would allow to enlarge the experimental data base for the assessment of thermal-hydraulic codes used far HTR and VHTR design and safety analysis
As for the previous year the definition of the test matrix has been supported with pre-test calculations carried out with the T/H system code RELAP5. To this purpose the HE-FUS3 model assessed in the post-test activity has been used with minor modifications.
Note
Copia n. In carico a:2
NOME FIRMA1
NOME FIRMA NOME P. Meloni ..\5.9.lOIO F. S. Nitti M. TarantinotJ
dir'-
S. Montio
EMISSIONE FIRMA~Q
WdiIJ
Table of Contents
1. Introduction
2. Upgrading of the HE-FUS3 facility
2.1 Present Status of the Facility
2.2 New Instrumentation Needs
2.3 Loop Modifications
3. Adjustment of the Numerical Model
3.1 RELAP5 Computer Code & Loop Nodalization
3.2 Modifications of the HE-FUS3 Model
4. Pre-test Calculations
4.1 Start-up by Steps
4.2 LOFA Transient
4.3 Transient of Power (TOP)
4.4 LOCA Transient
5. Conclusions
6. References
Appendix A: RELAP5 Input Deck for Steady State Conditions
Appendix B: RELAP5 Input Deck for LOFA
Appendix C: RELAP5 Input Deck for TOP
Appendix D: RELAP5 Input Deck for LOCA
1.
Introduction
HE-FUS 3 is a helium facility that was designed and constructed at ENEA CR Brasimone in mid
90’s for the thermal-mechanical testing of prototypical module assemblies of the DEMO reactor
[1]. Within the frame of the first year of the AdP ENEA-MSE SP an experimental campaign was
carried out in 2009 [2] with the objective to provide a reliable experimental data base for the
assessment of thermal-hydraulic codes used for HTR and VHTR design and safety analysis.
On the basis of the results obtained in the 2009 experimental campaign [3] a new series of tests
has been planned for the second year for the following reasons:
- the post-tests calculations performed with the RELAP5 code showed for some tests a
lack of important information on the facility behaviour in transient conditions that would
require the repetition of the tests with an upgraded instrumentation,
- new experimental tests conducted at higher pressure and mass flowrate considering
previous and additional transient scenarios would allow to enlarge the experimental data
base for the assessment of thermal-hydraulic codes used for HTR and VHTR design and
safety analysis.
As for the previous year the definition of the test matrix has been supported with pre-test
calculations [4] carried out with the T/H system code RELAP5. To this purpose the HE-FUS3
model assessed in the post-test activity has been used with minor modifications.
The new experimental campaign will be devoted to characterize the loop at higher pressure and
mass flowrate by means of a step-by-step start-up procedure. Then a series of three transients will
be conducted on the facility including: Loss of Flow Accident (LOFA) driven by the compressor
slow-down, Transient of Power (TOP) driven by an increase of the Test Section electrical power
and Loss of Coolant Accident (LOCA) caused by the opening of a valve on the tank.
For the first two transients the pre-test calculation have addressed in particular to define the
dynamic conditions of the loop to guarantee that safety limits of the HE-FUS3 loop were not
reached. The third test has also requested to assess the suitability of the discharge line to be
implemented in the facility.
In the appendixes A to D the RELAP5 input decks developed for the pre-test calculations and
opportunely commented are reported.
2.
Upgrading of the HE-FUS3 facility
2.1 Present Status of the Facility
The facility, constructed with the EU economic support of the European Fusion Technology
Program in 1995 at ENEA Brasimone Center, was used for the thermal mechanical testing of
prototypical module assemblies for European Helium Cooled Pebble Bed (HCPB) Blanket design
to be tested on ITER reactor.
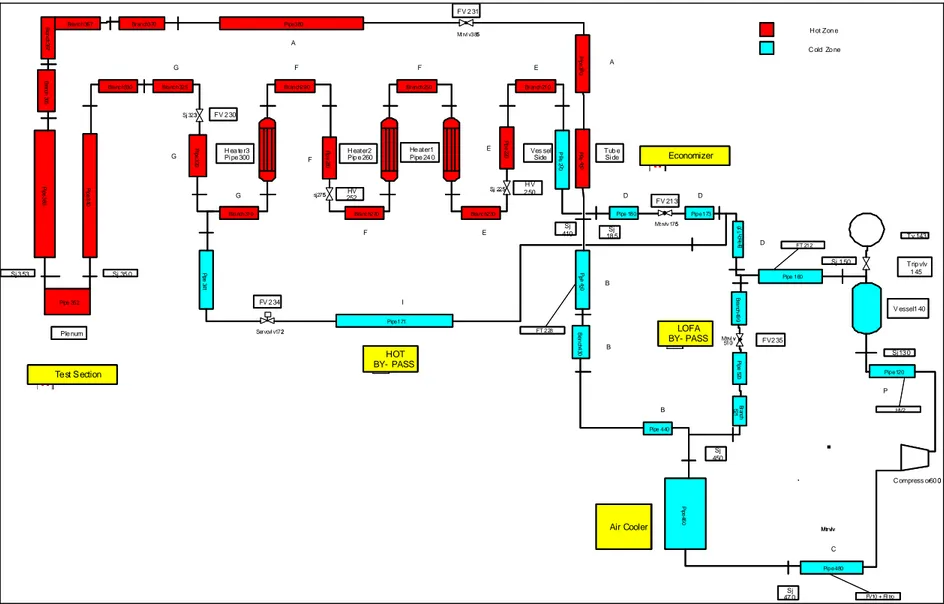
The facility, detailed described in a previous AdP ENEA-MSE report [4], supplies the helium
flowrate at the requested conditions to a 7-pin Test Section by means its eight loop configuration
showed in Fig. 2.1
.
The purpose of the eight-shaped closed loop arrangement is to separate two zones at different
temperatures, the cold one including the compressor and the hot one the Test Section. An
economizer, placed at the crossover point, recovers the gas enthalpy before recirculating the
helium through the compressor. Thereby it has been possible to reduce both the need for external
power to get the required temperature at the Test Section inlet and the cooler size to reduce the
compressor inlet temperature to the level of its maximum continuative operating temperature.
The present components allow the facility to achieve the performances reported in Tab. 2.1.
In order to support the testing of HCPB and Helium-Cooled Lithium Lead (HCLL) full scale Test
Blanket Module (TBM) for ITER operation, the facility will be upgraded to achieve the higher
performances also reported in Tab. 2.1. The first modification planned in the facility is the
installation of a new compressor that is foreseen during 2010. Due to the uncertainty about the
date in which the installation will be completed, the experimental program will be conducted with
the old compressor that, in any case, will be available on a parallel line.
Parameter Previous Value Upgraded Value
Max Pressure (MPa) 10.5 10.5
Max Temperature (°C) 530 530
Inlet Compressor Max Temperature (°C) 100 100
Compressor Helium Flow Rate (kg/s) 0.05-0.35 0.27-1.4
Max Compressor Speed (rpm) 18000 -
Max Compressor Head (MPa) 0.5 0.9
Compressor Electrical Power (kVA) 136 190
Heaters Electrical Power (kW) 210 210
Economizer Thermal Power (kW) 564 1450
Air-Cooler Thermal Power (kW) 280 280
Helium Tank Capacity (m3) 3 3
Fig. 2.1 – HE-FUS3 P&I
VACUUM
HOT TEST SECTION
PURIFICATION IN
GAS ANL VACUUM
FV 231 HV 252 HV 250 FV 213 FV 235 HV 243 PSV 208 FV 249 FV 9 FV6 FV 247 FV 5 FV 4 HV 300 PRV 244 HV 2 HV 289 FV 8 FV 10 PSV PSV E219/1 HEATER COLD TEST SECTION
HELIUM DISCHARGE SYS
HE-BOTTLES
HELIUM FILLING SYS MIXER E219/2 E219/3 FT 22 E 240 COOLER V 205 TANK E214 ECONOMIZER FT 212 PCV 248 S 260 FILTER K200 PC 24 FV 230 MIXER HV 251 FV 234 COMPRESSOR
2.2
New Instrumentation Needs
The instrumentation map of the facility is shown in Fig. 2.3. This paragraph is addressed to
summarize the insufficiency of instrumentation highlighted by the experimental program and
related post-test analysis performed during the first year of ENEA-MSE AdP [2], [3]. In the
following the different problems meet and the possible solutions proposed are reported:
Except for the thermocouples at the inlet and outlet of the Test Section, installed for the
last year experimental campaign (TE101 and TE102, all the measurements of helium
temperatures in the loop are influenced by the wall thermal inertia. This behaviour is
shown both by thermocouples in the cockpit and in the ones directly exposed to the fluid
and used for the regulation chains. The effect on the measurements although more evident
in transient conditions is also present in steady state conditions, where using the wall
temperature instead of the helium temperature in the thermal balance introduces an error
in the calculation of the power exchanged in the economizer or dissipated outside the
loop. In order to partially solve this problem it would be necessary to install four more
thermocouples in the key positions to calculate the power exchanged in the economizer
(TR217, TR216 e TR218) and the heat dissipated in the heathers zone (TR222).
The parameters recorded during the transient tests performed in 2009 showed an
inadequate frequency of acquisition of the experimental data. This is particular evident for
the trend of parameters like pressure, mass flowrates and pressure drops. The optimum
would be to have an acquisition system with the possibility to vary the frequency
according to the dynamic of the transient, as in the new system installed on the 7-pin Test
Section for the last year experimental program. In case it is not possible to change the
acquisition frequency for all parameters, it is necessary to do that for the pressure
measurements in order to allow the characterization of the loop depressurization in the
LOCA transient. Moreover, the sensibility of the measurement should be increased (0.1
bar instead of the present value of 1 bar). This last considerations is applicable to all
temperature measurements, where it is recommended to pass from a sensibility of 1 °C to
0.1 °C to better characterize the evolution of the loop temperatures in transient conditions.
In the LOCA transient it is absolutely necessary to install a device for the measurement of
the mass flowrate that is an essential information for the assessment of the system codes.
During the previous experimental campaign, a few of thermocouples in the 7-pin TS have
recorded values in disagreement with the other ones. These values have not been
considered for the post-test analysis, anyway, in order to better understand the reason of
that, it would be desirable to verify the exact position of the thermocouples within the
bundle and their electrical connection. To this scope it should be considered the
possibility to open the Test Section at the end of the new experimental campaign.
In order to obtain a better characterization of the heat losses in term of distribution along
the loop, some thermocouples should be positioned on the external of the insulation
material in some components and lines: economizer, heaters zone, Test Sections and its
connection line.
At present the only measurement related to the by-pass mass flowrate through the valve
ZT234 is the valve opening percentage. Due to the old and incomplete information on the
valve characteristic this parameter has poor significante for the code validation. On this
purpose it would be extremly useful to install a suitable device for the mass flowrate
measurement in the by-pass line.
2.3
Loop Modifications
As reported in the previous sub-paragraph the measurement of the break flowrate is necessary to
acquire an exhaustive characterization of the LOCA transient. In Fig. 2.4 it is reported the scheme
of a device to be installed on the loop to simulate the rupture by means of the 1”1/2 valve FV-9
on the top of the tank. This device will allow the measurement of the break mass flowrate by
means a 2” vortex and its control through the valve at the end of the discharge piping.
The size of this valve (at present assumed 2”) will be carefully evaluate during the pre-test
analysis in order to obtain a meaningful dynamic of the LOFA transient without exceeding the
safety set-points of the loop. Thus avoiding the intervention of the protection system that would
causing the electrical power shut-off and the interruption of the thermal transient.
As largely presented in the previous paragraph, further modifications requested in the loop
concern essentially the need of new instrumentation. Since they do not imply an effect on the
thermal-hydraulic behaviour of the loop, they will be defined also in accordance with the pre-test
results presented in this report.
3.
Adjustment of the Numerical Model
3.1 RELAP5 Computer Code & Loop Nodalization
As in the previous analyses, performed during the first year of the AdP ENEA-MSE, the latest
Mod 3.3 version of Relap5 is the reference computer code used for the simulation of the
thermal-hydraulic behaviour of the HE-FUS3. It is worth to remind that RELAP5 is a universally known
computer program, developed by US NRC for the analysis of all transient and postulated
accidents in LWR systems, including both large and small-break Loss-Of-Coolant Accidents
(LOCAs) as well as the full range of operational transients.
The Relap5/Mod3.3 program [5] is based on a non-homogeneous and non-equilibrium model for
the two-phase system that is solved by a fast, partially implicit numerical scheme to permit
economical calculation of system transients. The code includes many generic component models
from which general systems can be simulated. The component models include pumps, valves, and
pipes, heat releasing or absorbing structures, reactor point kinetics, electric heaters, jet pumps,
turbines, separators, accumulators, and control system components. In addition, special process
models are included for effects such as form loss, flow at an abrupt area change, branching,
choked flow, boron tracking, and non condensable gas transport.
Although several applications to gas cooled reactors and systems were carried out in the past [6],
no specific components or models have been implemented in the code so far. RELAP5 has the
capability to represent a wide variety of working fluids by means of a generalized equation of
state. Taking advantage of this characteristic ENEA has developed a RELAP5 MOD3.3 version
capable to treat helium as a coolant. As the functional verification of this version is still in
progress, the standard approach to describe helium as a pure incondensable gas has adopted for
the HE-FUS3 calculations.
The main rules adopted for the development of the numerical model of the loop where the
following:
the whole main loop should was modelled in order to assess the capability to simulate the
dynamic behaviour of the loop
explicit models where used for the Economizer and Test Section to allow the verification
of the heat transfer modelling in these components
a compressor model able to adapt to the different loop conditions was adopted
due to their great importance on the loop temperatures in transient condition the thermal
inertia of the structures and the heat losses to the environment where modelled in detail
The loop model for RELAP5 calculation (Fig.3.1), initially built in ninties [7] and upgraded for
the recent analyses [4], has requested an updating in order to describe in detail the discharge line
reported in figure 2.4. Moreover some slight modifications have concerned the modelling of
Economizer and Compressor, two of the most important components of the loop.
C ompress or60 0 Pipe 120 Sj 13 0 Tv 143 Trip vlv 1 45 V essel 1 40 Pipe 160 Sj 1 50 Br a n c h 170 Pipe 173 Mt rvlv 175 FV 21 3 Pipe 180 Sj 18 5 P ipe2 00 Pi pe 40 0 Branch210 P ip e 220 Sj 225 Branc h230 He ater1 Pipe 24 0 Branch250 H eater2 Pip e 260 Branc h270 sj275 Pip e 28 0 Branch290 H ea te r3 Pi pe 300 Branch310 Pi pe 3 20 Sj 323 Branc h330 Branc h325 P ip e34 0 Pipe 352 Sj 35 0 Ple num Pi pe 3 60 Sj 3 53 B ranc h 365 B ran ch 367 Branc h367 Test Section Pipe 380 Mt rvl v385 FV 2 31 P ipe 3 9 0 Tub e Si de Ves sel Side Economizer P ip e4 2 0 Br an ch 4 30 Sj 410 Pipe 440 P ipe 46 0 Sj 450 FV10 + Fil tro Pipe 480 Sj 47 0 Br a nc h 49 9 FT 212 Mtrvl v 510 FV 2 35 P ipe 52 0 Bra nc h 521 LOFA BY- PASS Mtrvlv . Pipe 171 FV 2 34 P ipe 341 FT 228 HOT BY- PASS Servovl v172 HV 2 P D D D E E E F F F F G G G A A B B B C I H ot Zon e C old Zo ne Branch370 Air Cooler H V 2 50 HV 252 FV 2 30 C ompress or60 0 Pipe 120 Sj 13 0 Tv 143 Trip vlv 1 45 V essel 1 40 Pipe 160 Sj 1 50 Br a n c h 170 Pipe 173 Mt rvlv 175 FV 21 3 Pipe 180 Sj 18 5 P ipe2 00 Pi pe 40 0 Branch210 P ip e 220 Sj 225 Branc h230 He ater1 Pipe 24 0 Branch250 H eater2 Pip e 260 Branc h270 sj275 Pip e 28 0 Branch290 H ea te r3 Pi pe 300 Branch310 Pi pe 3 20 Sj 323 Branc h330 Branc h325 P ip e34 0 Pipe 352 Sj 35 0 Ple num Pi pe 3 60 Sj 3 53 B ranc h 365 B ran ch 367 Branc h367 Test Section Pipe 380 Mt rvl v385 FV 2 31 P ipe 3 9 0 Tub e Si de Ves sel Side Economizer P ip e4 2 0 Br an ch 4 30 Sj 410 Pipe 440 P ipe 46 0 Sj 450 FV10 + Fil tro Pipe 480 Sj 47 0 Br a nc h 49 9 FT 212 Mtrvl v 510 FV 2 35 P ipe 52 0 Bra nc h 521 LOFA BY- PASS Mtrvlv . Pipe 171 FV 2 34 P ipe 341 FT 228 HOT BY- PASS Servovl v172 HV 2 P D D D E E E F F F F G G G A A B B B C I H ot Zon e C old Zo ne Branch370 Air Cooler H V 2 50 HV 252 FV 2 30
3.2 Modifications of the HE-FUS3 Model
A detailed description of the different models adopted for the relevant components is
provided in previous reports. In particular we recommend to refer to [4] for a concise
description useful to better understand the RELAP5 simulations reported in the next chapters.
In this paragraph only the modifications performed for the present pre-test activity are
reported.
Discharge Line
The geometry of the line from the expansion tank, where is located the manual valve
simulating the break, to the safety manual valve is described in detail. The size of the manual
valve has to be determined by means of parametric calculations in order to reduce the break
flowrate as the size of the automatic valve (1” 1/2 ) seems too large and it could cause a too
fast depressurization of the loop.
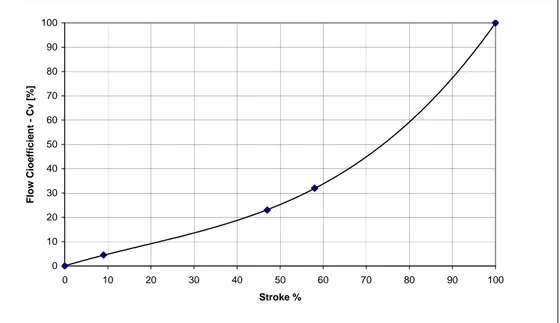
The control valve has been modelled by using Relap5 motor valve component. For these
component the requested Flow Coefficient (Cv) vs. percent Stroke curve has been provided
starting from the Cv data supplied by the manufacturer (Fig. 3.2 ) and taking into account a
combined pressure recovery factor and piping geometry factor of valve with attached fittings
by means a multiplicative factor: FLP = 0.8. The opening/closure time of the valve in the
calculations has been considered of 3 s.
Compressor
The prototypical compressor is still simulated by means of the RELAP5 standard rotating
pump component taking into account the gas heating. The interaction of the pump and the
fluid is described by means of homologous curves that correlate pump head, torque and the
volumetric flow, using dimensionless quantities.
For a given rotation speed the dynamical
dimensionless characteristics for head and torque have been built using the experimental
compressor characterization tests carried out in 1988 (Fig 3.3).
Respect to the previous analyses the model has been considerably simplified in term of
helium flow path. In fact, the compressor cooling system, which was previously simulated by
means of a by-pass flow rate properly cooled to simulate the heat removed by a two stage
water heat exchanger, is not described any more. The compressor is now considered as a
black box that operates on the loop mass flowrate using the characterization tests to correlate
rotation speed, pressure head, volumetric flow rate, helium inlet and outlet temperature (Figs
3.4 and 3.5).
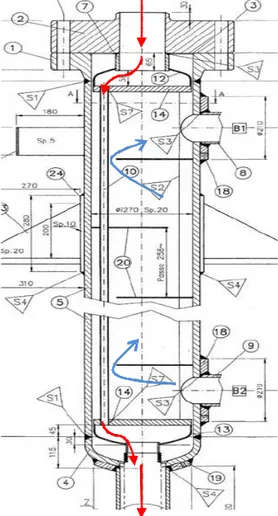
Economizer
The Economizer is still simulated by means of two pipes representing the shell side and the
tube side, and thermally coupled through the pipe wall heat structure. A previous tuning
performed to obtain design performance in term of heat transfer capability and pressure drop
has been repeated to improve heat transfer performance at different flow conditions. The
inadequacy of the Dittus-Boelter correlation (standard RELAP5 correlation for convective
heat transfer) for the shell side was highlighted in the past. In fact, in order to take into
account the increase of thermal exchange performance due to the presence of diaphragms and
consequent helium cross-flow ( Fig 3.6) an artificially decreased heating diameter was
introduced in the model. The value of this diameter was chosen as a compromise to better
reproduce the different flow conditions.
For the present calculation the model of the Economizer has been modified to better evaluate
the convective heat transfer in the shell at the different flow conditions. The flow area, the
heating diameter and the flow path has been imposed considering cross-flow of the cold
helium caused by the presence of the diaphragms. The reduction of flow area causes an
increase of the helium velocity with consequent improvement of the thermal exchange
performance in good agreement with the available experimental data.
0 10 20 30 40 50 60 70 80 90 100 0 10 20 30 40 50 60 70 80 90 100 Stroke % F lo w Cio e ffi ci en t - C v [%]
Fig. 3.2 – Characteristic of the Regulation Valves
LOOP PRESSURE 48.9-49.6 BAR, Tin 750-800
1 1,5 2 2,5 3 3,5 4 0,10 0,15 0,20 0,25 0,30 0,35 0,40 M ass Flowrate [kg/s] He ad ( b a r) 10 000 rpm 1 200 rpm 1300 0 rpm 14 000 rpm 1 5000 rp m
Homologous Head Curves
0,0E+00 4,0E-01 8,0E-01 1,2E+00 1,6E+00 2,0E+00 0,00 0,20 0,40 0,60 0,80 1,00 1,20 v/a or a/v h/a2 h/v2. 3.4 – RELAP Homologous Head Curve
Homologous Torque Curves
0,0E+00 4,0E-01 8,0E-01 1,2E+00 0,00 0,20 0,40 0,60 0,80 1,00 1,20 v/a or a/v b/a2 b/v2
4. Pre-test
Calculations
The new experimental program to be performed on the He-FUS3 facility is designed taking
into account the results of the experimental and numerical activities carried out last year:
the post-tests calculations performed with the RELAP5 code showed for some tests a
lack of important information on the facility behaviour, in particular for the LOCA
transients, that require the repetition of the tests with an upgraded instrumentation
an exhaustive assessment of thermal-hydraulic codes used for HTR and VHTR design
and safety analysis requires to enlarge the experimental data base considering higher
pressures and mass flowrates and additional transient scenarios
In order to match these objectives the new experimental program will be composed by a series
of steady states at 50 bar pressure to reach the reference conditions for the transients by steps,
a Loss of Flow Accident (LOFA) driven by the compressor slow-down, a Transient of Power
(TOP) driven by an increase of the Test Section electrical power and a Loss of Coolant
Accident (LOCA) caused by the opening of a valve on the expansion tank.
4.1
Start-up by steps
A start-up procedure by steps is investigated in this pre-test analysis in order to collect data at
different steady state conditions for the characterization of the heat losses in the hot zone of
the loop and of the thermal exchange performance in the economizer at a higher pressure
respect to the previous experimental data. The loop pressure is fixed at 50 bar and, in order to
have more flexibility on the heating up dynamics, only TS electrical power is considered as
heat source in the pre-test calculations.
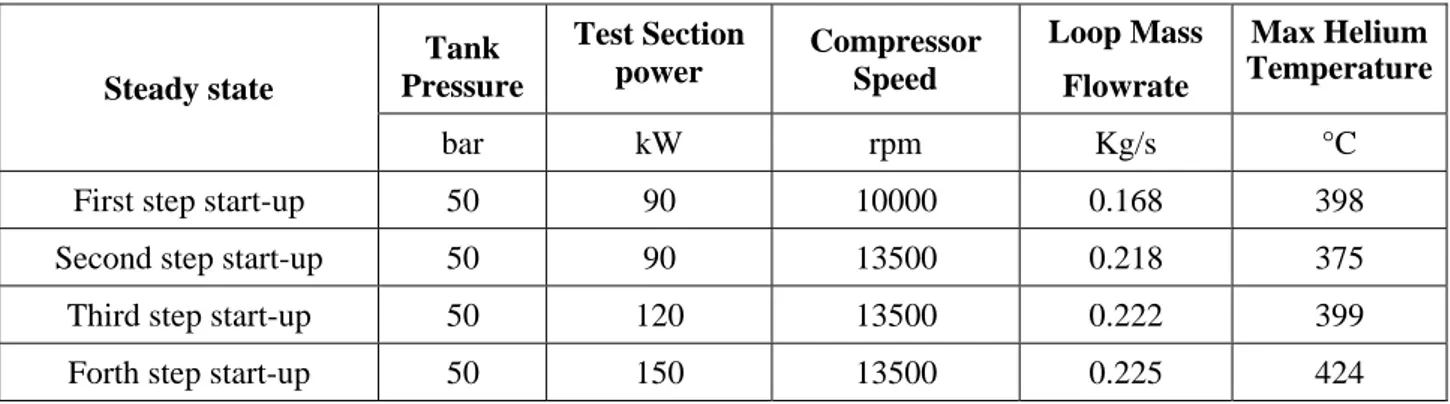
In the Table 4.1
are reported the relevant initial and boundary conditions for the start-up steps.
A 3-step increase of supplied power combined with a 2-step increase of compressor speed
allow defining 4 different steady states characterized by different temperature distributions in
the loop hot zone and different mass flowrates in the economizer. For each step the loop will
take about 50000 s to reach steady state conditions (temperature variations less that 1 °C for
hour) as showed in previous analyses [4]. In order to accelerate the RELAP5 calculations the
thermal capacities of the loop materials have been decreased by a factor 1000 in the model. In
this way after only 500 seconds the loop temperature is already stabilized. Of course, this
assumption has been made only in calculations where the interest is not to simulate the
response of the system to accidental events as in the following transient calculations, but just
to reproduce the different steady state conditions that will be recorded during the start-up.
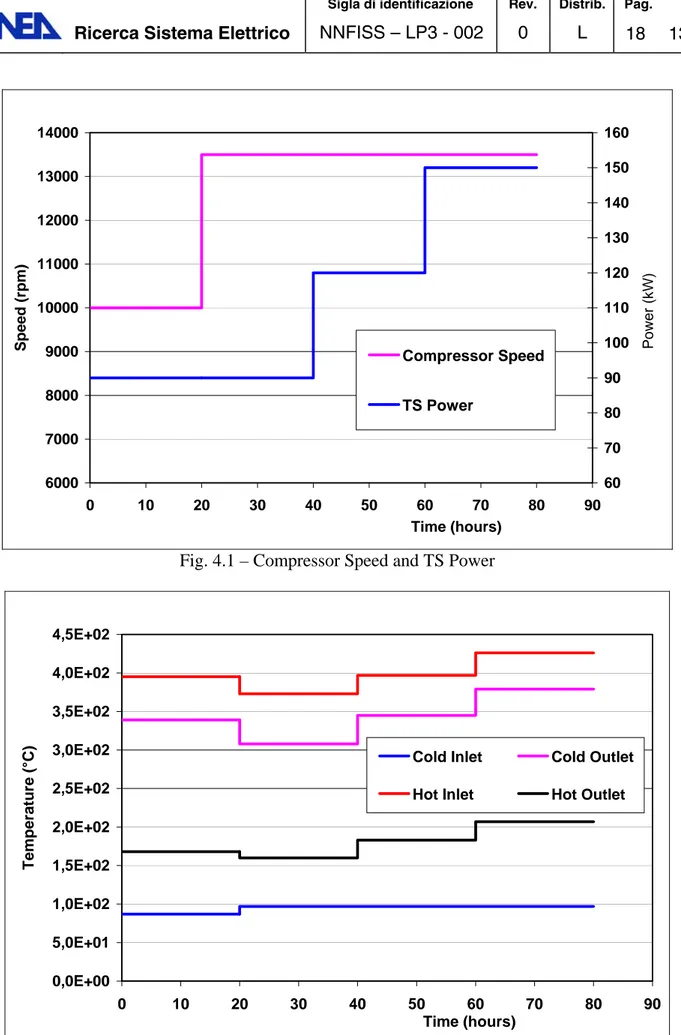
In Fig. 4.1 are described the variations of supplied power and compressor speed to get the
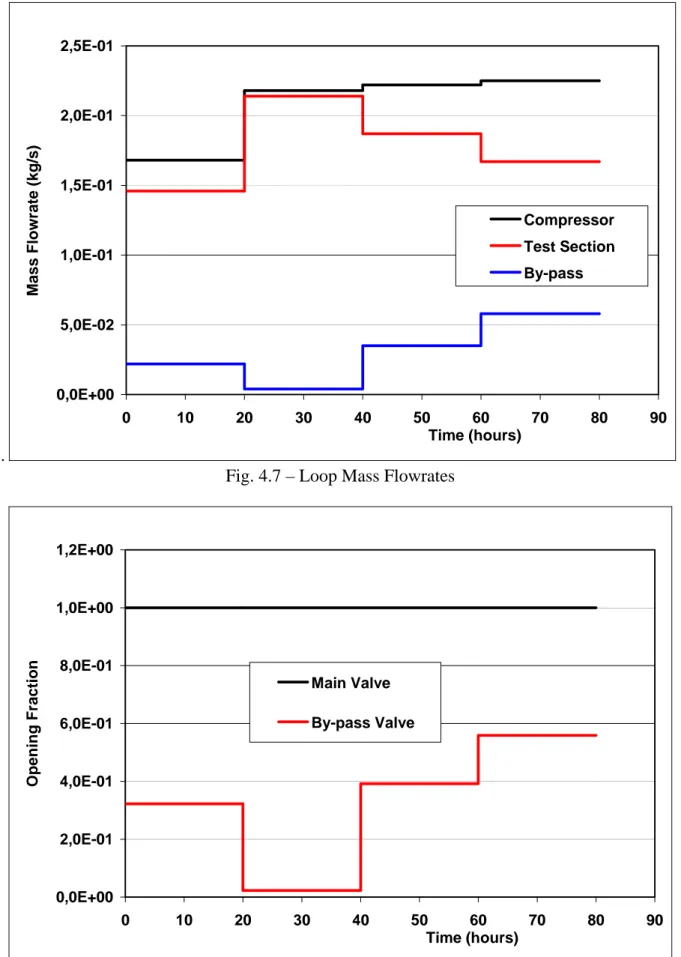
different steps. The main loop parameters calculated are reported in Figs. 4.2 to 4.9. From
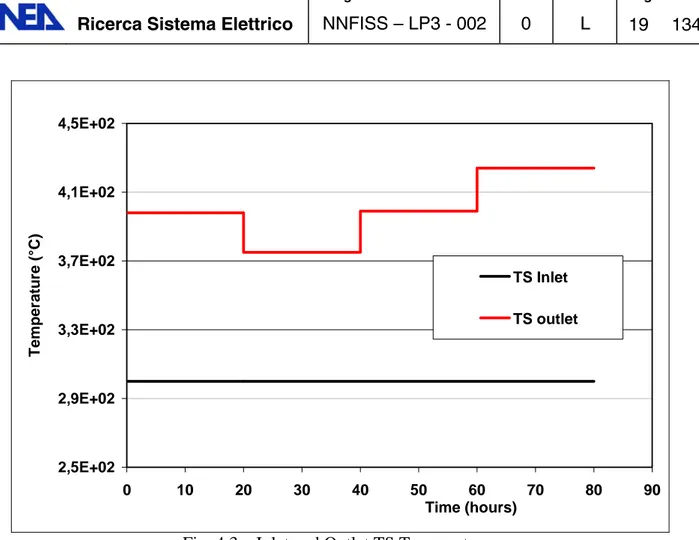
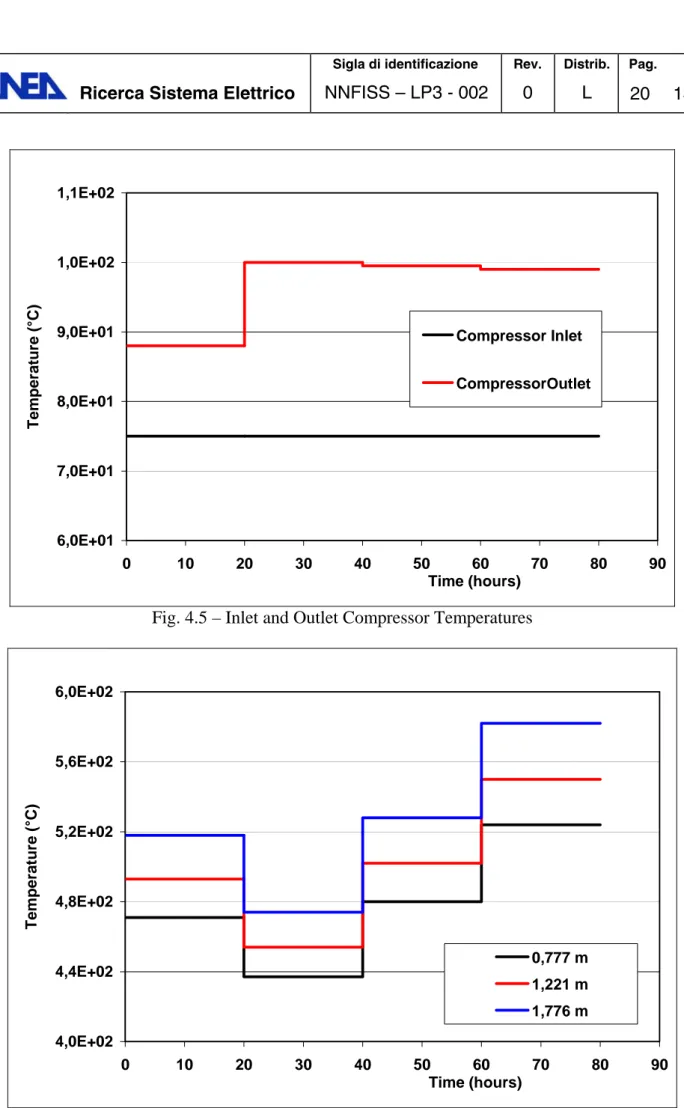
Figs. 4.2 to 4.6, in particular, is shown how the loop temperatures stabilize at 4 different
levels during the start-up. In Fig.4.3 it can been noticed that the temperature regulation at the
inlet of the test section is always active only and the by-pass valve opens (Fig. 4.8) to limit
this temperature to 300 °C. Finally, in Fig. 4.10 is showed the total pressure drop in the loop
and in the test section that follow both the mass flowrate and slightly the temperature
increase.
Steady state
Tank Pressure
Test Section
power Compressor Speed
Loop Mass Flowrate
Max Helium Temperature
bar kW rpm Kg/s °C
First step start-up 50 90 10000 0.168 398
Second step start-up 50 90 13500 0.218 375
Third step start-up 50 120 13500 0.222 399
Forth step start-up 50 150 13500 0.225 424
6000 7000 8000 9000 10000 11000 12000 13000 14000 0 10 20 30 40 50 60 70 80 90 Time (hours) Spe e d (rpm) 60 70 80 90 100 110 120 130 140 150 160 Compressor Speed TS Power Po w e r ( k W )
Fig. 4.1 – Compressor Speed and TS Power
0,0E+00 5,0E+01 1,0E+02 1,5E+02 2,0E+02 2,5E+02 3,0E+02 3,5E+02 4,0E+02 4,5E+02 0 10 20 30 40 50 60 70 80 90 Time (hours) Temperat ure (
°C) Cold Inlet Cold Outlet
Hot Inlet Hot Outlet
2,5E+02 2,9E+02 3,3E+02 3,7E+02 4,1E+02 4,5E+02 0 10 20 30 40 50 60 70 80 90 Time (hours) Temperat ure (°C ) TS Inlet TS outlet
Fig. 4.3 – Inlet and Outlet TS Temperatures
0,0E+00 5,0E+01 1,0E+02 1,5E+02 2,0E+02 2,5E+02 0 10 20 30 40 50 60 70 80 90 Time (hours) Tem p er atur e ( °C) Aircooler Inlet Aircooler Outlet
6,0E+01 7,0E+01 8,0E+01 9,0E+01 1,0E+02 1,1E+02 0 10 20 30 40 50 60 70 80 90 Time (hours) Tem p er at ur e ( °C ) Compressor Inlet CompressorOutlet
Fig. 4.5 – Inlet and Outlet Compressor Temperatures
4,0E+02 4,4E+02 4,8E+02 5,2E+02 5,6E+02 6,0E+02 0 10 20 30 40 50 60 70 80 90 Time (hours) Temper ature (°C) 0,777 m 1,221 m 1,776 m
.
0,0E+00 5,0E-02 1,0E-01 1,5E-01 2,0E-01 2,5E-01 0 10 20 30 40 50 60 70 80 90 Time (hours) M a ss Fl ow ra te (kg/ s) Compressor Test Section By-passFig. 4.7 – Loop Mass Flowrates
0,0E+00 2,0E-01 4,0E-01 6,0E-01 8,0E-01 1,0E+00 1,2E+00 0 10 20 30 40 50 60 70 80 90 Time (hours) Opening Fract
ion Main Valve
By-pass Valve
0,0E+00 5,0E+04 1,0E+05 1,5E+05 2,0E+05 2,5E+05 3,0E+05 0 10 20 30 40 50 60 70 80 90 Time (hours) Pres sure Dro p ( P a ) Loop Test Section
4.2 LOFA Transient
A transient test characterized by a relevant reduction of the mass flowrate trough the Test
Section has been carried out by means of the compressor speed reduction. This test want to
be representative of partial LOFA transients as those resulting from compressor coast-down
events. In order to investigate the dynamic effect of the loop at high temperature the power
supplied at the Test Section is maintained at initial value.
The main point investigated with the pre-test calculation lasting 2000 seconds have been the
maximum helium and pin cladding temperatures reached during the transient in order to
verify that the design limits for the loop and for the pin cladding are not attained. The results
of the calculation reported in Figs. 4.10 to 4.20 show that the margin respect to these limits is
sufficient also taking into account the conservative assumptions made in the calculation
model.
The LOFA scenario, which start from the steady state conditions attained at the conclusion of
the start-up transient, has been simulated by means a reduction of the compressor speed from
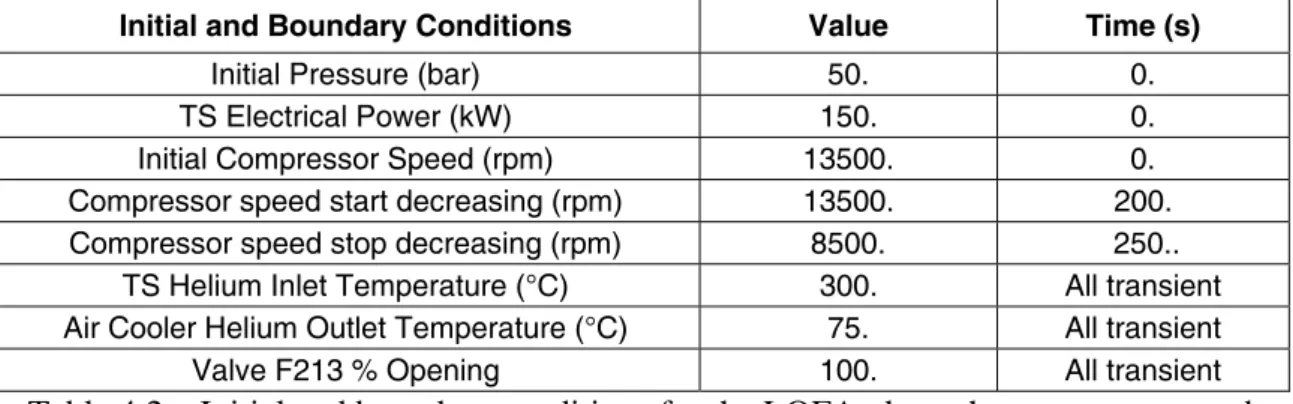
13500 rpm to 8500 rpm in 50 s. The initial and boundary conditions of the transient are
reported in Table 4.2.
Figure 4.10 shows the reduction of the TS mass flowrate following the reduction of the
compressor speed, which decreases from 0,225 kg/s to 0,14 kg/s. Due to this decease the
temperatures increase in the hot part of the loop. The maximum helium temperature that is
localized at the outlet of the Test Section reaches 500 °C (Fig. 4.13) that is a sufficient margin
respect to the limit of 530° C, and sufficient it is the margin of the pin cladding temperature,
727 °C against the limit of 800 °C (Fig. 4.16).
After the 2000 sec transient calculated the loop temperature is not still stabilized due to the
thermal inertial of the loop structures as it is showed by temperature trends in the hot part of
the loop reported in Figs. 11 and 12. Also the bypass valve FV234 in Fig. 4.19, which is
opening to maintain the temperature at TS inlet equal to 300 °C following the increase of
temperatures, has not reached the stabilize value yet. As previously reported the loop
temperature need about 50000 s to be completed stabilized, however the loop dynamic
behaviour is sufficiently characterized by 2000 seconds of transient here simulated.
Initial and Boundary Conditions Value Time (s)
Initial Pressure (bar) 50. 0.
TS Electrical Power (kW) 150. 0.
Initial Compressor Speed (rpm) 13500. 0.
Compressor speed start decreasing (rpm) 13500. 200.
Compressor speed stop decreasing (rpm) 8500. 250..
TS Helium Inlet Temperature (°C) 300. All transient
Air Cooler Helium Outlet Temperature (°C) 75. All transient
Valve F213 % Opening 100. All transient
Table 4.2 – Initial and boundary conditions for the LOFA through compressor speed
reduction
0 200 400 600 800 1000 1200 1400 1600 0 500 1000 1500 2000 2500 Time (s) Ro ta ti on s p e e d (r a d /s ) 0,00 0,05 0,10 0,15 0,20 0,25 0,30 Compressor speed TS massflow M ass Fl ow ra te ( K g/ s )
Fig. 4.10 – Compressor Speed and TS Mass Flowrate
0 100 200 300 400 500 600 0 500 1000 1500 2000 2500 Time (s) Tem p er a tur e ( °C) TR215 TR216 TR217 TR218
360 370 380 390 400 410 420 430 440 0 500 1000 1500 2000 2500 Time (s) Te mperature (°C) TR221 TR222 TR223
Fig. 4.12 – Heaters Zone Temperatures
250 300 350 400 450 500 550 0 500 1000 1500 2000 2500 Time (s) Temperature (°C) TR232 TR102
0 50 100 150 200 250 0 500 1000 1500 2000 2500 Time (s) Te mperature (°C) TR218 TR202
Fig. 4.14 – Inlet and Outlet Air Cooler Temperatures
0 20 40 60 80 100 120 0 500 1000 1500 2000 2500 Time (s) Temperature (°C) TR202 TR204
400 450 500 550 600 650 700 750 0 500 1000 1500 2000 2500 Time (s) Te mperature (°C) T hot pin (0,222) T hot pin (0,777) T hot pin (1,221) T hot pin (1,776)
Fig. 4.16 – Hot Pin temperatures
400 450 500 550 600 650 700 0 500 1000 1500 2000 2500 Time (s) Temperature (°C) T aver. pin (0,222) T aver. pin (0,777) T aver. pin (1,221) T aver. pin (1,776)
0,00 0,20 0,40 0,60 0,80 1,00 1,20 0 500 1000 1500 2000 2500 Time (s)
Opening (fraction) By-pass valve
Main Valve
Fig. 4.18 – Main and Bypass Valves Opening
0,E+00 5,E+04 1,E+05 2,E+05 2,E+05 3,E+05 0 500 1000 1500 2000 2500 Time (s) Pressure Drop (Pa) compressor DP TS DP
4,88E+06 4,90E+06 4,92E+06 4,94E+06 4,96E+06 4,98E+06 5,00E+06 5,02E+06 0 500 1000 1500 2000 2500 Time (s) Pressure (Pa) tank pressure
4.3 Transient of Power (TOP)
In order to simulate the typical thermal-hydraulic conditions following an increase of fission
power in the core (e.g. Reactivity Insertion Accident), a Transient of Power (TOP) driven by
an increase of the Test Section electrical power is planed in the HE-FUS3 facility. In the
pre-test calculation here described all the other relevant conditions are maintained at the initial
values. In particular, the temperature at the inlet of the test section has not been regulated, so
the helium conditions at the inlet of the 7-pin bundle are subject to an important variation that
is interesting to investigate in term of the effect on the heat transfer conditions in the bundle.
It is important to guarantee that the maximum helium and pin cladding temperatures reached
during the transient will not exceed the design limits, thus provoking the shutdown of the
power and the stop of the test. The pre-test calculation has lasted 4500 seconds, including 200
seconds of steady state conditions in order to attain nearly the maximum values of these
temperatures, because without regulation the temperature peaks depend on the loop response,
which is strongly influenced by the thermal capacity. The results of the calculation reported in
Figs. 4.21 to 4.30 show that in order to have a sufficient margin respect to these limits the
temperature at the inlet of the test section has to be limited to opportune value.
The TOP scenario, which has started from the steady state conditions characterized by 13500
rpm of compressor speed and 90 kW of power supplied in the Test Section, has been
simulated by means of an instantaneous increase of the power up to 150 kW. The initial and
boundary conditions of the transient are reported in Table 4.3.
Figure 4.21 shows that, due to the increase of Power and consequently the increase of
temperature in the loop, the TS mass flowrate has a very slight decrease. The increase of
temperature is substantially due to the increase of power. The maximum helium temperature
at the TS outlet reaches 518 °C (Fig. 4.24) after 3800 seconds of transient, nevertheless the
temperature is not stabilized and is still increasing. In order to remain below the design limit
of 530 °C with a sufficient margin, it is recommendable to avoid that the temperature at the
inlet of the Test Section exceeds 390 °C. In the calculation this temperature achieves 395°
(Fig. 4.23) while the temperature through TS is stable at 124 °C. Instead, the maximum pin
temperature in Fig. 4.27 is well below the design limit also without controlling the TS inlet
temperature.
After the 3800 sec transient calculated the loop temperature is not still stabilized and the peak
temperatures are not still reached due to the thermal inertial of the loop structures. Because
the trends of the temperatures still show consistent increases it is recommended to extend to
5000 seconds the duration of this experimental transient.
Initial and Boundary Conditions Value Time (s)
Initial Pressure (bar) 50. 0.
Initial Compressor Speed (rpm) 13500. 0.
TS Electrical Power (kW) 90. 0.
TS Electrical Power start increasing (kW) 90. 200.
TS Electrical Power stop increasing (kW) 150. 200.1
TS Helium Inlet Temperature (°C) Not regulated All transient
Air Cooler Helium Outlet Temperature (°C) 75. All transient
Valve F213 % Opening 100. All transient
0 20000 40000 60000 80000 100000 120000 140000 160000 0 1000 2000 3000 4000 5000 Time (s) Power (kW) 0,00 0,05 0,10 0,15 0,20 0,25 TS power TS massflow Massfl o w (kg/ s )
Fig. 4.21 – Test Section Power and Mass Flowrate
0 100 200 300 400 500 600 0 500 1000 1500 2000 2500 3000 3500 4000 4500 Time (s) Tem p er a tur e ( °C) TR215 TR216 TR217 TR218
300 320 340 360 380 400 420 0 500 1000 1500 2000 2500 3000 3500 4000 4500 Time (s) Te mperature (°C) TR221 TR222 TR223
Fig. 4.23 – Heaters Zone Temperatures
250 300 350 400 450 500 550 0 500 1000 1500 2000 2500 3000 3500 4000 4500 Time (s) Temperature (°C) TR232 TR102
0 20 40 60 80 100 120 140 160 180 200 0 500 1000 1500 2000 2500 3000 3500 4000 4500 Time (s) Te mperature (°C) TR218 TR202
Fig. 4.25 – Inlet and Outlet Air Cooler Temperatures
0 20 40 60 80 100 120 0 500 1000 1500 2000 2500 3000 3500 4000 4500 Time (s) Temperature (°C) TR202 TR204
400 450 500 550 600 650 700 0 500 1000 1500 2000 2500 3000 3500 4000 4500 Time (s) Te mperature (°C) T hot pin (0,222) T hot pin (0,777) T hot pin (1,221) T hot pin (1,776)
Fig. 4.27 – Hot Pin temperatures
400 450 500 550 600 650 0 500 1000 1500 2000 2500 3000 3500 4000 4500 Time (s) Temperature (°C) T aver. pin (0,222) T aver. pin (0,777) T aver. pin (1,221) T aver. pin (1,776)
0,E+00 5,E+04 1,E+05 2,E+05 2,E+05 3,E+05 3,E+05 0 500 1000 1500 2000 2500 3000 3500 4000 4500 Time (s) Pre ssure Drop (P a) compressor DP TS DP
Fig. 4.29 – Loop and TS pressure Drops
4,98E+06 5,00E+06 5,02E+06 5,04E+06 5,06E+06 5,08E+06 5,10E+06 5,12E+06 0 500 1000 1500 2000 2500 3000 3500 4000 4500 Time (s) Pressure (Pa) tank pressure
4.4 LOCA Transient
A LOCA transient has been simulated starting with a loop pressure of about 50 bar, or the
maximum loop pressure attainable after operating the loop for the previous transient. As
described in the paragraph 2 a dedicated line was implemented on the expansion tank to
simulate a break on the primary loop and to allow the measurement of the break mass
flowrate. The transient will be started by opening in 3 seconds a 1 ½ inc control valve located
on the expansion tank. The pre-test analysis performed has had as a main result the
dimensioning of a protection valve at the end of the line that, acting like a calibrated orifice,
prevents a too fast depressurization of the loop with the achievement of a temperature higher
than the design value. This valve is considered necessary due to the uncertainty that affects
the simulation of such a fast transient.
To this scope some parametric calculations have been performed varying the dimension of the
valve from 2 inc to 0.5 inc and consequently the duration of the break opening. The results of
these calculations are summarized in Table 4.4. It is evident that a seize of 2 inc has no effects
and also a seize of 1 inc does not allow to control the depressurization during the LOCA
transient thus preventing the intervention of the protection system, therefore a 0.5 inc valve
will be installed. Moreover in order to not exceed the design temperatures the reference
pre-test calculation has been run considering a break opening of 41 seconds including 3 seconds
for the closure of the regulation valve.
The LOCA transient will allow to investigate that behaviour of the loop against a strong
variation of the loop pressure The initial and boundary conditions of the transient are reported
in Table 4.4.
The results of the calculation are reported in Figs. 4.31 to 4.40. Figure 4.31 shows the
instantaneous increase of the break mass flowrate at the break opening that is limited at 0.507
kg/s by the critical conditions. During the 41 s of the break opening the loop pressure
decreases down to a minimum value of 19 bar then goes up to 22 bar following the loop
heating (Fig. 4.32). In the mean time loop and TS mass flowrates strongly decrease in
agreement with the characteristic of the compressor and as a consequence the temperature in
the hot part of the loop increases. The helium temperature at the outlet of the Test Section
reaches 533 °C after 800 s from the beginning of the transient (Fig. 4.35) that slightly exceed
the design temperature. In order to avoid such a high temperature it is recommended to limit
the break opening of a few seconds (38 s including opening and closure times). Due to the
strong degradation of the thermal exchange behaviour with the decrease of the helium
velocity the peak of clad temperature in the hot pin exceed also the limit value of 800 °C of a
few degrees (Fig. 4.38).
Dimension of the
manual valve 2” 1” 1/2”
Depressurization time (s)
(including 3 s for valve closure) 13 17 43
Minimal Pressure (bar) 18.2 17.7 17.5
Maximum Break Flowrate (kg/s) 1.63 1.30 0.51
Maximum Helium Temp. (°C) 510. 515. 518.
Maximum Pin Temp. (°C) 780. 790. 810.
Table 4.4 – Parametric analysis on protection valve size
Initial and Boundary Conditions Value Time (s)
Initial Pressure (bar) 50 0.
TS Electrical Power (kW) 120. 0.
Initial Compressor Speed (rpm) 13500. 0.
Start of Break Opening (m2) 0. 200.
Complete Break Opening (m2) 1.114e-3 203.
Start of Break Closure (m2) 1.114e-3 238.
Complete Break Closure (m2) 0. 241.
Calibrated Orifice (m2) 0.12668e-3 All transient
TS Helium Inlet Temperature (°C) 300. All transient
Air Cooler Helium Outlet Temperature (°C) 75. All transient
Valve F213 % Opening 100. All transient
0,00 0,10 0,20 0,30 0,40 0,50 0,60 0 200 400 600 800 1000 1200 Time (s) Power (kW) TS massflow compressor massflow break flow
Fig. 4.31 – Test Section, Loop and Break Mass Flowrate
0,00E+00 1,00E+06 2,00E+06 3,00E+06 4,00E+06 5,00E+06 6,00E+06 0 200 400 600 800 1000 1200 Time (s) Pressure (Pa) Expansion tank
0 100 200 300 400 500 600 0 200 400 600 800 1000 1200 Time (s) Temperature (°C) TR215 TR216 TR217 TR218
Fig.4.33 – Inlet and Outlet Economizer Temperature
300 310 320 330 340 350 360 370 380 390 400 0 200 400 600 800 1000 1200 Time (s) Temperature (°C) TR221 TR222 TR223
250 300 350 400 450 500 550 0 200 400 600 800 1000 1200 Time (s) Te mperature (°C) TR232 TR102
Fig. 4.35 – Inlet and Outlet TS Temperatures
0 50 100 150 200 250 0 200 400 600 800 1000 1200 Time (s) Temperature (°C) TR218 TR202
0 20 40 60 80 100 120 0 200 400 600 800 1000 1200 Time (s) Te mperature (°C) TR202 TR204
Fig. 4.37 – Inlet and Outlet Compressor Temperatures
400 450 500 550 600 650 700 750 800 850 0 200 400 600 800 1000 1200 Time (s)
Temperature (°C) T hot pin (0,222)
T hot pin (0,777) T hot pin (1,221) T hot pin (1,776)
400 450 500 550 600 650 700 750 0 200 400 600 800 1000 1200 Time (s) Te mperature (°C) T aver. pin (0,222) T aver. pin (0,777) T aver. pin (1,221) T aver. pin (1,776)
Fig. 4.38 – Average Pin temperatures
0,00 0,20 0,40 0,60 0,80 1,00 1,20 0 200 400 600 800 1000 1200 Time (s) Opening (fraction) By-pass valve Main Valve
0,E+00 5,E+04 1,E+05 2,E+05 2,E+05 3,E+05 0 200 400 600 800 1000 1200 Time (s) Pre ssure Drop (P a) compressor DP TS DP
5. Conclusions
Pre-test calculations with RELAP5 code have been carried out to support a new experimental
campaign planned on the HE-FUS3 loop with the objective to better characterize the loop
implementing new instrumentation as well as to enlarge the experimental data base for the
assessment of thermal-hydraulic codes for HTGRs.
To this purpose a start-up procedure by steps and a series of three transients have been
simulated with the version Mod3.3 of the RELAP5 code in order to provide a specifications
of the initial and boundary conditions to be used in the conduction of the experiments. The
results related to the three transients, Loss of Flow Accident (LOFA) driven by the
compressor slow-down, Transient of Power (TOP) driven by an increase of the Test Section
electrical power and Loss of Coolant Accident (LOCA) caused by the opening of a valve on
the expansion tank, are essential to guarantee that the design temperature limits are not
reached, thus avoiding the intervention of the protection system and an unexpected stop of the
transient.
For the LOCA transient, in particular, some parametric calculations have been performed to
dimension a protection valve to be implemented on the break line to prevent too fast
depressurization.
6. References
[1] G. Dell’Orco, “HE-FUS3 European Helium Cooled Blanket Test Facility for DEMO”
Presentation to 1st Meeting on HCPB Blanket Design - Karlsruhe, Germany, 1996.
[2] A. Tincani, L. Rapezzi, G. Polazzi, M. Querci, S. Panichi, “HE-FUS 3 Experimental
Campaign for the Assessment of Thermal-Hydraulic Codes. - Experiment Data Report”
ENEA RG-T-R-002, April 2009.
[3] P. Meloni, M. Polidori “HE-FUS 3 Experimental Campaign for the Assessment of
Thermal-Hydraulic Codes. - Post-Test Analysis ” ENEA RT FPN-P9LU-036, April 2009.
[4] M. Polidori “HE-FUS 3 Experimental Campaign for the Assessment of
Thermal-Hydraulic Codes. - Pre-Test Analysis and Test Specifications” ENEA RT FPN-P9LU-015,
December 2008.
[5] “Relap5/Mod 3.3 Code Manual” Information Systems Laboratories, Inc., Document
NUREG/CR-5535/
[6] P. Meloni and M. Casamirra, “Overview of Helium Cooled System Applications with
RELAP at ENEA”, Proceedings of ICAPP ’06, Reno, NV USA, 2006
[7] P. Meloni “HE-FUS3 Facility Nodalization for ATHENA/RELAP code”, ENEA
Document CT-SBA-00003, 1998
[8] M. Polidori “HE-FUS3 Loop: Data Sheets for Code Modelling and Experimental Data for
Code Assessment”, ENEA Document FPN – P9L7-001, 2008
APPENDIX A: RELAP5 Input Deck for Steady State Conditions
* HE-FUS3 Input Deck per RELAP5 Mod3.3 * * =Helium Loop * 100 new transnt * 101 run * 110 helium * *
* time steps min mj re * 201 2500. 1.e-7 0.01 3 100 5000 5000 * * *--- * minor edits *--- * * Extended variables: *
20800001 httemp 360300114 * test section pin 222 mm 20800002 httemp 360300113 * test section pin 222 mm 20800003 httemp 360300314 * test section pin 666 mm 20800004 httemp 360300313 * test section pin 666 mm 20800005 httemp 360300414 * test section pin 888 mm 20800006 httemp 360300413 * test section pin 888 mm 20800007 httemp 360300514 * test section pin 1110 mm 20800008 httemp 360300513 * test section pin 1110 mm 20800009 httemp 360300614 * test section pin 1332 mm 20800010 httemp 360300613 * test section pin 1332 mm 20800011 httemp 360300814 * test section pin 1776 mm 20800012 httemp 360300813 * test section pin 1776 mm *
*
20800013 httemp 360400114 * test section pin 222 mm 20800014 httemp 360400113 * test section pin 222 mm 20800015 httemp 360400314 * test section pin 666 mm 20800016 httemp 360400313 * test section pin 666 mm 20800017 httemp 360400414 * test section pin 888 mm 20800018 httemp 360400413 * test section pin 888 mm 20800019 httemp 360400514 * test section pin 1110 mm 20800020 httemp 360400513 * test section pin 1110 mm 20800021 httemp 360400614 * test section pin 1332 mm 20800022 httemp 360400613 * test section pin 1332 mm 20800023 httemp 360400814 * test section pin 1776 mm 20800024 httemp 360400813 * test section pin 1776 mm *
20800025 httemp 340301503 * temperatura parete tubo TS lower plenum 20800026 httemp 370200103 * temperatura parete tubo TS lower plenum *
20800027 httemp 365100121 * temperatura lamierino TS outlet *
20800028 httemp 180100101 * piping wall temp. econ. cold inlet 20800029 httemp 180100102 * " "
*
20800030 httemp 210100101 * piping wall temp. econ. cold outlet 20800031 httemp 210100102 * " "
*
20800032 httemp 390100201 * piping wall temp. econ. hot inlet 20800033 httemp 390100202 * " "
*
20800034 httemp 420100101 * piping wall temp. econ. hot inlet 20800035 httemp 420100102 * " " * *--- * minor edits *--- * *310 tempg 140010000 * tank
*311 tempg 180020000 * inlet econom. cold side *312 tempg 210010000 * outlet econom. cold side *313 tempg 315040000 * outlet by-pass
*314 tempg 250010000 * out E/3 *315 tempg 270010000 * out E/2 *316 tempg 300140000 * out E/3 *317 tempg 320010000 * inlet TS
*318 tempg 390020000 * inlet econom. hot side *319 tempg 420010000 * outlet econom. hot side *320 tempg 480010000 * outlet areotermo
*321 tempg 120010000 * outlet compressore *
322 mflowj 150000000 * portata totale 323 mflowj 175000000 * portata resistori 324 mflowj 172000000 * portata by-pass *
325 cntrlvar 040 * salto pressione compressore 326 cntrlvar 041 * salto pressione TS
*
327 pmphead 600 328 pmpvel 600 *
*
*338 cntrlvar 011 * potenza risc 1 *339 cntrlvar 012 * potenza risc 2 339 cntrlvar 503 * potenza risc 3
340 cntrlvar 214 * potenza econ. mantello 341 cntrlvar 215 * potenza econ. tubi
342 cntrlvar 016 * potenza scambiata aerotermo 343 cntrlvar 555 * potenza pins
*
344 cntrlvar 031 * perdite termiche econimiz. 345 cntrlvar 032 * perdite termiche heaters 346 cntrlvar 033 * perdite termiche TS
347 cntrlvar 028 * perdite termiche TS-economizz. 348 cntrlvar 034 * perdite termiche cold part 349 cntrlvar 030 * perdite termiche totali *
350 p 140040000 351 p 365010000 352 p 480090000
* * 360 cntrlvar 200 361 cntrlvar 201 362 cntrlvar 202 363 cntrlvar 203 364 cntrlvar 204 365 cntrlvar 205 366 cntrlvar 206 367 cntrlvar 207 368 cntrlvar 208 369 cntrlvar 209 *
370 cntrlvar 210 * test section aver pin 222 mm 371 cntrlvar 211 * test section aver pin 777 mm 372 cntrlvar 212 * test section aver pin 1221 mm 373 cntrlvar 213 * test section aver pin 1776 mm *
374 cntrlvar 314 * test section hot pin 222 mm 375 cntrlvar 315 * test section hot pin 777 mm 376 cntrlvar 216 * test section hot pin 1221 mm 377 cntrlvar 217 * test section hot pin 1776 mm *
378 cntrlvar 220 * test section lower plenum wall (aver) 379 cntrlvar 223 * test section outside wall (max)
380 cntrlvar 224 * test section lower plenum wall (min) 381 cntrlvar 221 * test section outside wall
382 cntrlvar 225 * test section helium outlet * 383 cntrlvar 230 384 cntrlvar 231 385 cntrlvar 232 386 cntrlvar 233 *
390 mflowj 147000000 * portata rottura
391 vlvarea 172 * apertura valvola by-pass * *350 htmode 400100100 *351 htmode 400100101 *352 htmode 400100600 *353 htmode 400100601 *354 htmode 400101300 *355 htmode 400101301 *356 htmode 400101900 *357 htmode 400101901 * *340 httemp 300100105 *341 httemp 300100205 *342 httemp 300100305 *343 httemp 300100405 *344 httemp 300100505 *345 httemp 300100605 *346 httemp 300100705 * * *350 hthtc 300100101 *351 hthtc 300100201 *352 hthtc 300100301
*353 hthtc 300100401 *354 hthtc 300100501 *355 hthtc 300100601 *356 hthtc 300100701 * *--- * trips *--- *
* pump trip for decay and regulation *
501 time 0 ge null 0 1.e6 n * pu-trip *
* pump regulation
510 time 0 ge null 0 50. l * regulation on 511 time 0 le null 0 99999. l * regulation off 610 510 and 511 n *
* *
515 time 0 ge null 0 500. l * PRZ closure trip 601 -515 and -515 n * PRZ opening trip *
*--- * FV-213 valve regulation
*
517 time 0 le null 0 99999. l *trip closure fv234 603 -517 and -517 n *trip opening fv234 *
516 time 0 ge null 0 99999. l *trip opening fv213 616 -517 and -517 n *trip closure fv213 *
*--- * Regulation of valve FV-234 (by-pass economizer)
* 536 cntrlvar 59 ge null 0 0.5 n -1. 537 cntrlvar 58 ge null 0 0.5 n -1. * * Regulation off *
538 time 0 ge null 0 999999. l -1. * regolazione off 640 538 and 538 n
*
*--- * Regulation of Valve FV235 (by-pass of loop hot part) *
525 time 0 ge null 0 99999. n * opening trip 526 time 0 le null 0 99999. n * closure trip 625 525 and 526 n
626 -526 and -526 n *
*
* Regulation of Valve for break opening *
555 time 0 ge null 0 99999. l -1. *trip apertura break 556 p 140040000 le null 0 25.e5 l * trip chiusura break 655 555 and 556 n
656 -556 and -556 n *
*--- *
590 time 0 ge null 0 500. l * end of transient 600 590 * end of programm * *--- * Hydraulic components *--- *
* Tubazione P (Compressore-Serbatoio) orizzontale pgA7-15 * L=1. m, A=0.00216 m2, Didr= 0.052m * 1200000 ptubo pipe * partizioni 1200001 2 * sez.(m 2) elemento 1200101 0.002163 2 * lung.(m) elem. 1200301 0.5 2 * vol(m 3) elem. 1200401 0. 2 * azimut elem. 1200501 120. 2 * ang.vertic elem. 1200601 0. 2
* rugos(m) Didr(m) elem. 1200801 4.e-5 0.052 2
* Kdir Kinvr giunzione 1200901 3. 3. 1
* tlpvbfe elem. 1201001 00000 2
* efvcahs giunz. 1201101 001000 1
* ebt P(Pa) T(K) stato ? ? elem. 1201201 004 5.1e6 361.16 0.0 0. 0. 2 * 0:(m/s) 1:(kg/s)
1201300 1
* condizioni iniziali * mliq mgas ! giunz. 1201301 0. .225 0. 1
*---
* Sezione di imbocco Tubo P Serbatioio, Kf=1. Kr=0.5 pgA7-11 * 1300000 jun2 sngljun * da a sez.giun(m 2) Kf Kr efvcahs 1300101 120010000 140000000 0. 1. 0.5 001100 * (kg/s) mliq mgas ! 1300201 1 0. .225 0. *---
* Serbatoio verticale pgA7-15 * V=3 m3, Didr=0.710 m, L=4.615 m, A=0.650 m2 * 1400000 vess pipe * partizioni 1400001 5 * sez.(m 2) elemento 1400101 0.650 5 * lung.(m) elem. 1400301 0.923 5
* vol(m 3) elem. 1400401 0. 5 * azimut elem. 1400501 0. 5 * ang.vertic elem. 1400601 90. 5
* rugos(m) Didr(m) elem. 1400801 4.e-5 0.710 5
* Kdir Kinvr giunzione 1400901 0. 0. 4
* tlpvbfe elem. 1401001 00000 5 * efvcahs giunz. 1401101 001000 4
* ebt P(Pa) T(K) stato ? ? elem. 1401201 004 5.1e6 361.16 0.0 0. 0. 5 * 0:(m/s) 1:(kg/s)
1401300 1
* mliq mgas ! giunz. 1401301 0. .225 0. 4
*---
* Pressurizzatore P=4.9 MPa pgA7-6 *
1430000 prescomp tmdpvol
* sez(m 2) lung(m) vol(m 3) azim ang.vert elev(m) rug(m) Didr(m) tlpvbfe 1430101 100. 1. 0. 0. 0. 0. 0. 0. 00000 * ebt 1430200 004 * ? P(Pa) T(K) 1430201 0. 5.0e6 361. 0.0 1430202 50. 5.0e6 361. 0.0 1430203 9999. 5.0e6 361. 0.0 *--- *
* Valvola Regolazione Pressione S=0.025 m2 pgA7-41
*
1450000 prsvalv valve
* da a sez.giu(m 2) Kdir Kinv efvcahs 1450101 143000000 140010000 0.025 0. 0. 001000 * condizioni iniziali * (kg/s) mliq mgas ! 1450201 1 0. .0 0. * tipo valvola 1450300 trpvlv * apritrip 1450301 601 * *--- *
* Valvola Simulazione Rottuta *
1470000 bypvl2 valve
* da a sez.giu(m 2) Kdir Kinv efvcahs 1470101 140010000 148000000 1.114e-3 0. 0. 000000 * condizioni iniziali
1470201 1 0. 0.01 0. * tipo valvola
1470300 mtrvlv
* apritrip chiuditrip vel.cambio pos.iniz. 1470301 655 656 .33333 0.0
* pos.normaliz CSUBVdir CSUBVinv 1470400 1. 0.08 * 1470401 0. 0. 0. 1470402 0.1 19.0 19.0 1470403 0.3 38.0 38.0 1470404 0.4 55.0 55.0 1470405 0.5 81.0 81.0 1470406 0.6 115.0 115.0 1470407 0.7 156.0 156.0 1470408 0.8 207.0 207.0 1470409 0.9 265.0 265.0 1470410 0.9 331.0 331.0 * *--- * Linea di scarico * 1480000 dcline pipe * partizioni 1480001 6 * sez.(m 2) elemento 1480101 1.142e-3 2 1480102 1.903e-3 6 * lung.(m) elem. 1480301 0.5 6 * vol(m 3) elem. 1480401 0. 6 * azimut elem. 1480501 0. 6 * ang.vertic elem. 1480601 0. 6
* rugos(m) Didr(m) elem. 1480801 4.e-5 0.0381 2 1480802 4.e-5 0.0493 6
* Kdir Kinvr giunzione 1480901 0. 0. 1 1480902 1. 0.5 2 1480903 0. 0. 3 1480904 7. 7. 4 1480905 0. 0. 5 * tlpvbfe elem. 1481001 00000 6 * efvcahs giunz. 1481101 000000 5
* ebt P(Pa) T(K) stato ? ? elem. 1481201 004 1.e5 361.16 0.0 0. 0. 6 * 0:(m/s) 1:(kg/s)
1481300 1
* condizioni iniziali * mliq mgas ! giunz. 1481301 0. .0 0. 5
*
*--- * valvola manuale da 2 inc.
* 1490000 vlvman sngljun * da a sez.giun(m 2) Kf Kr efvcahs 1490101 148010000 146000000 0. 2.6 2.6 000000 * (kg/s) mliq mgas ! 1490201 1 0.0 0.0 0.0 * *--- * Scarico in atmosfera * 1460000 prescomp tmdpvol
* sez(m 2) lung(m) vol(m 3) azim ang.vert elev(m) rug(m) Didr(m) tlpvbfe 1460101 100. 1. 0. 0. 0. 0. 0. 0. 00000 * ebt 1460200 004 * ? P(Pa) T(K) 1460201 0. 1.0e5 361. 0.0 1460202 50. 1.0e5 361. 0.0 1460203 9999. 1.0e5 361. 0.0 * *---
* Sezione collegamento Serbatoio-Tubazione D Kf=0.5 Kr=1. pgA7-11 * 1500000 jun3 sngljun * da a sez.giun(m 2) Kf Kr efvcahs 1500101 140010000 160000000 0. 0.5 1. 001100 * (kg/s) mliq mgas ! 1500201 1 0. .225 0. *--- * Tubo D prima parte
* (due curve 900 K=0.5 + restringimento e flangia tarata FT 212 K=8.7) * Ltot=7.919 m * !!! k ridotto del 90% K=7.83 * A=0.00737-0.00144-0.00737 Didr=0.097-0.043-0.097 * 1600000 dtubo pipe * partizioni 1600001 9 * sez.(m 2) elemento 1600101 0.007371 5 1600102 0.001444 7 1600103 0.007371 9 * lung.(m) elem. 1600301 0.447 1 1600302 0.869 4 1600303 0.973 9 * vol(m 3) elem. 1600401 0. 9 * azimut elem. 1600501 180. 1 1600502 0. 4 1600503 270. 9 * ang.vertic elem. 1600601 0. 1 1600602 -90. 4 1600603 0. 9
1600801 4.e-5 0.097 5 1600802 4.e-5 0.043 7 1600803 4.e-5 0.097 9
* Kdir Kinvr giunzione 1600901 0.5 0.5 1 1600902 0.5 0.5 5 1600903 8.7 8.7 6 1600904 0. 0. 8 * tlpvbfe elem. 1601001 00000 9 * efvcahs giunz. 1601101 001000 8
* ebt P(Pa) T(K) stato ? ? elem. 1601201 004 5.1e6 361.16 0.0 0. 0. 9 * 0:(m/s) 1:(kg/s)
1601300 1
* mliq mgas ! giunz. 1601301 0. .225 0. 8
*--- * Linea by-pass della parte calda del loop
*
4990000 closure branch *
4990001 1 1
* sez(m 2) lung(m) vol(m 3) azim incli elev(m) rug(m) Didr(m) tlpvbfe
4990101 4.0579e-3 1.636 0. 0. -90. -1.636 4.e-5 0.072 00000
* ebt P(Pa) T(K) 4990200 004 5.1e6 361.16 0.0
* da a sez.giu(m 2) Kdir Kinv efvcahs 4991101 160010000 499000000 0. 0. 0. 001000 * condizioni iniziali * mliq mgas ! 4991201 0. 0.01 0. *--- * Valvola 235
* Valvola di regolazione (Cvmax=331)
* Cv utilizzato=221 per riprodurre pressure drops (si ipotizza
* non completa apertura) *
5100000 bypvl2 valve
* da a sez.giu(m 2) Kdir Kinv efvcahs 5100101 499010000 520000000 4.0579e-3 0. 0. 001000 * condizioni iniziali * (kg/s) mliq mgas ! 5100201 1 0. 0.01 0. * tipo valvola 5100300 mtrvlv
* apritrip chiuditrip vel.cambio pos.iniz. 5100301 625 626 .25 0.0001 * pos.normaliz CSUBVdir CSUBVinv
5100400 1. 0.08 * 5100401 0. 0. 0. 5100402 0.08 9.965 9.965 5100403 0.11 15.06 15.06 5100404 0.16 21.17 21.17