JHEP09(2017)032
Published for SISSA by SpringerReceived: July 19, 2017 Accepted: August 5, 2017 Published: September 8, 2017
Searches for transverse momentum dependent flow
vector fluctuations in Pb–Pb and p–Pb collisions at
the LHC
The ALICE collaboration
E-mail: [email protected]
Abstract: The measurement of azimuthal correlations of charged particles is presented
for Pb–Pb collisions at √sNN = 2.76 TeV and p–Pb collisions at √sNN = 5.02 TeV with the
ALICE detector at the CERN Large Hadron Collider. These correlations are measured
for the second, third and fourth order flow vector in the pseudorapidity region |η| < 0.8
as a function of centrality and transverse momentum pT using two observables, to search
for evidence of pT-dependent flow vector fluctuations. For Pb–Pb collisions at 2.76 TeV,
the measurements indicate that pT-dependent fluctuations are only present for the second
order flow vector. Similar results have been found for p–Pb collisions at 5.02 TeV. These measurements are compared to hydrodynamic model calculations with event-by-event ge-ometry fluctuations in the initial state to constrain the initial conditions and transport properties of the matter created in Pb–Pb and p–Pb collisions.
Keywords: Heavy Ion Experiments
JHEP09(2017)032
Contents
1 Introduction 1
2 Probes of pT-dependent flow vector fluctuations 3
3 Experimental setup 4
4 Event and track selection 5
5 Systematic uncertainties 6
6 Results and discussion 7
6.1 Pb–Pb collisions 7
6.2 p–Pb collisions 16
7 Summary 19
The ALICE collaboration 26
1 Introduction
The primary goal of ultrarelativistic heavy-ion collisions is to study the properties of the Quark-Gluon Plasma (QGP), a state of matter predicted by Quantum Chromodynamics
to exist at high temperatures and energy densities [1, 2]. An important experimental
ob-servable used to accomplish this goal is the azimuthal anisotropy of particles emitted in the transverse plane. In non-central heavy-ion collisions, the overlap region of the Lorentz-contracted nuclei is roughly almond-shaped. Nucleons contained in such anisotropic over-lap region interact with each other and give rise to a system of high energy density which expands anisotropically. These interactions convert the initial spatial asymmetry into a final-state momentum anisotropy of the produced particles, a phenomenon referred to
as collective anisotropic flow [3–5]. Anisotropic flow is characterised using a Fourier
de-composition of the azimuthal distribution of particles with respect to the flow symmetry planes [6,7] Ed 3N d3⃗p = 1 2π d2N pTdpTdη ! 1 + 2 ∞ " n=1 vncos[n(ϕ− Ψn)] # , (1.1)
where N is the number of produced particles, E is the energy, ⃗p the momentum, pT the
transverse momentum, ϕ the azimuthal angle and η the pseudorapidity of the particle. The nthorder flow (vector) Vnis defined as: Vn≡ vneinΨn, where vnis the flow coefficient, and
Ψn represents the azimuth of Vn in momentum space (flow angle). For a uniform matter
distribution in the initial stage of a heavy-ion collision, Ψn for n ≥ 1 coincides with the
reaction plane defined by the beam direction and impact parameter. Due to event-by-event
JHEP09(2017)032
deviate from the reaction plane and the odd flow coefficients v2n−1are non-vanishing [8–14].
Large flow coefficients were observed at the Relativistic Heavy-Ion Collider (RHIC) [15–18]
and the Large Hadron Collider (LHC) [19–29]. These measurements constrain the initial
conditions (e.g. energy and entropy density) and transport coefficients of the system (such as shear viscosity over entropy density ratio, η/s). The recent measurements of
correla-tions between different order flow coefficients and flow angles [23, 30], together with the
comparisons to theoretical calculations, indicate that the matter created in ultrarelativistic heavy-ion collisions behaves as a nearly perfect fluid (almost zero η/s) whose constituent particles interact strongly [31].
Traditionally the final-state symmetry plane angles are estimated event-by-event from
the particle azimuthal distribution over a large range in pT. However, hydrodynamic
calculations indicate a pT dependence of the flow vector Vn due to event-by-event
fluc-tuations in the initial energy density of the nuclear collisions [32, 33]. These flow vector
fluctuations could be responsible for the experimentally observed breakdown of the fac-torisation [25,27,34]. They might also affect the measured pT-differential anisotropic flow vn(pT) [33]. Therefore, searches for pT-dependent flow vector fluctuations become impor-tant and these measurements together with the comparisons to theoretical calculations not only constrain the transport properties, but also shed light on the initial conditions in heavy-ion collisions.
Studies of azimuthal correlations are performed also in p–Pb collisions at the LHC. The original goal of p–Pb collisions was to provide reference data for the high energy Pb–Pb collisions. However, indications of collective behaviour have been discovered by the
AL-ICE, ATLAS, CMS and LHCb collaborations [35–46]. If the azimuthal correlations in small
collision systems reveal the onset of hydrodynamic flow behaviour, the breakdown of fac-torisation should be expected in small collision systems and reproduced by hydrodynamic calculations as well.
The first experimental indication of pT-dependent flow vector fluctuations was
ob-served by ALICE in studies of the decomposition of Fourier harmonics of the two-particle azimuthal correlations [34]. Fits to the azimuthal correlations, assuming factorisation of the
two-particle Fourier harmonics, agree well with data up to pTa∼ 3–4 GeV/c, deviations at
higher pTare interpreted, as at least partially, due to away-side recoil jet contributions [34]. A systematic study of the factorisation of long-range two-particle Fourier harmonic into
the flow coefficients is also performed in both Pb–Pb and p–Pb collisions by CMS [41,47].
In this paper, the pT-dependent flow vector fluctuations are investigated in more detail
using novel observables for azimuthal correlations, for charged particles in Pb–Pb collisions
at √sNN = 2.76 TeV and p–Pb collisions at √sNN = 5.02 TeV with the ALICE detector. The
definitions of the observables are given in section2. The experimental setup is described in
section 3. The results are reported in multiple centrality classes for Pb–Pb collisions and
multiplicity classes for p–Pb collisions for several transverse momentum intervals. Details
of the event and track selections are given in section 4. Section 5 shows the study of
systematic uncertainties of the aforementioned observables. Section 6presents results and
JHEP09(2017)032
2 Probes of pT-dependent flow vector fluctuations
The traditional approach used to measure anisotropic azimuthal correlations is as follows: first, the flow coefficient of reference particles (RPs), called reference flow, is determined over a wide kinematic range, and then the transverse momentum differential flow coefficient is calculated by correlating the particles of interest (POIs) with respect to the reference flow
obtained in the first step. Usually a pseudorapidity gap |∆η| is applied between the two
correlated particles to suppress non-flow effects, which comprise azimuthal correlations not associated with flow symmetry planes, e.g. resonance decays and jet contributions.
This approach has commonly been used to measure the anisotropic flow at the LHC [20,
25,28]. Considering possible pT-dependent flow angle and/or magnitude fluctuations and
neglecting non-flow contributions, the flow coefficient from pT interval a measured with
2-particle correlations can be expressed as vn{2}(paT) = ⟨⟨cos [ n (ϕ a 1 − ϕ2ref)]⟩⟩ $ ⟨⟨cos [ n (ϕref 1 − ϕ2ref)]⟩⟩ = ⟨vn(p a T) vnref cos [ n (Ψn(pTa)− Ψn)]⟩ $ ⟨vref n 2⟩ . (2.1)
Here, a single set of angular brackets denotes averaging over events, and a double set
indicates averaging over both particles and events. The ϕref and ϕarepresent the azimuthal
angle of RPs and POIs, respectively. The vref
n stands for the reference flow, and Ψn(paT)
denotes the pT differential symmetry plane angle at paT, which might fluctuate around
the pT integrated symmetry plane angle Ψn. The cosine term ⟨cos [ n (Ψn(pTa) − Ψn)]⟩
shows the effects of the difference between Ψn(pT) and Ψn, due to the pT-dependent flow
angle fluctuations. Additionally, ⟨vn(paT) vnref⟩ cannot be factorised into the product of % ⟨vn(pTa)2⟩ and $ ⟨vref n 2
⟩ if there are pT-dependent flow coefficient fluctuations.
A new type of two-particle azimuthal correlations from pa
T, denoted as vn[2](paT), is proposed in [33]: vn[2](pTa) = $ ⟨⟨cos [ n (ϕa 1 − ϕ2a)]⟩⟩ = $ ⟨⟨cos [ n(ϕa 1 − Ψn(pTa))− n (ϕ2a− Ψn(pTa))]⟩⟩ = $ ⟨vn(pTa)2⟩. (2.2)
The difference between vn{2}(paT) and vn[2](paT) is that the former takes the flow of RPs
from a wide pTrange and the POIs from a certain pTinterval, while the latter is essentially
the reference flow calculated within a narrow pT range. The ratio of vn{2} and vn[2] allows
pT-dependent flow vector fluctuations
vn{2} vn[2] (pTa) = ⟨vn(p a T) vnref cos [ n (Ψn(pTa)− Ψn)]⟩ % ⟨vn(pTa)2⟩ $ ⟨vref n 2 ⟩ . (2.3)
When the correlations are dominated by flow, a ratio value smaller than unity shall indicate
JHEP09(2017)032
Another observable to probe the pT-dependent flow vector fluctuations is the
factori-sation ratio rn [32,33]. It can be calculated using the two-particle Fourier harmonic as rn=
Vn∆(pTa, pTt) %
Vn∆(pTa, pTa) Vn∆(pTt, pTt)
, (2.4)
where Vn∆(pTa, pTt) is the nth-order Fourier harmonic of the two-particle azimuthal corre-lations of triggered and associated particles from pTt and pTa, and is calculated as
Vn∆(pTa, pTt) =⟨⟨cos [ n (ϕ1a− ϕ2t)]⟩⟩ = ⟨vn(pTa) vn(pTt) cos [ n(Ψn(pTa)− Ψn(pTt))]⟩, (2.5) where Ψn(pTa) and Ψn(pTt) represent the flow angles at pTa and pTt, respectively. The
sub-script ∆indicates that a pseudorapidity gap is usually applied to minimise contamination
from non-flow effects. If both triggered and associated particle are from the same pT
interval pt
T, eq. (2.5) reduces to
Vn∆(pTa, pTa) =⟨⟨cos [ n (ϕ1a− ϕ2a)]⟩⟩ = ⟨vn(pTa)2⟩. (2.6) Similarly, we have
Vn∆(pTt, pTt) =⟨⟨cos [ n (ϕ1t− ϕ2t)]⟩⟩ = ⟨vn(pTt)2⟩ . (2.7)
In the end rn is equivalent to
rn= ⟨vn
(pTa) vn(pTt) cos [ n(Ψn(pTa)− Ψn(pTt))]⟩ %
⟨vn(pTa)2⟩⟨vn(pTt)2⟩
. (2.8)
It can be seen that rn = 1 does not always hold true, i.e. most of the known sources of
non-flow effects do not factorise at low pT, which is confirmed by Monte Carlo studies [48].
In a flow-dominated system, rn ≤ 1 due to the Cauchy-Schwarz inequality. Factorisation
implies rn= 1, while rn < 1 shows the breaking of factorisation, suggesting the presence
of pT-dependent flow vector fluctuations [32,33].
Note that eqs. (2.3) and (2.8) look very similar. The ratios vn{2}/vn[2] include the
pT integrated information and probe the pT-differential flow vector with respect to the
pT integrated flow vector. The rn carries more detailed information on the 2-particle
correlation structure for triggered and associated particle from narrow pT intervals, and
probe the fluctuations of flow vector at pa
T and ptT; however, it also has larger statistical uncertainties. If the triggered particles are selected from a very wide kinematic range, the observable rn becomes identical with vn{2}/vn[2]. In this paper, we study vn{2}/vn[2] up
to n = 4 and rn up to n = 3.
3 Experimental setup
A Large Ion Collider Experiment (ALICE) [49] is the dedicated heavy-ion experiment at the
LHC designed to study strongly interacting matter at extreme energy densities. It was built to cope with the large charged-particle multiplicity density in central Pb–Pb collisions at
JHEP09(2017)032
the LHC, with several thousand tracks per unit of pseudorapidity. The ALICE apparatus consists of a central barrel that measures hadrons, electrons, muons and photons, and a forward spectrometer for the identification of muons. Several smaller detectors in the forward region are used for triggering and global event characterization. The central barrel is located inside a solenoidal magnet that provides a magnetic field of up to 0.5 T. Charged
tracks are reconstructed using the Time Projection Chamber (TPC) [49,50] and the Inner
Tracking System (ITS) [49,51] with a track momentum resolution better than 2% for the
momentum range 0.2 < pT < 5.0 GeV/c [52]. The TPC is the main tracking detector of
the central barrel, sufficient with full azimuthal coverage in the range of |η| < 0.9. The
ITS consists of six layers of silicon detectors placed at radii between 3.9 cm and 43 cm and matching the pseudorapidity acceptance of the TPC. Three different technologies are employed in the ITS: the two innermost layers are equipped with Silicon Pixel Detectors (SPD), the following two layers have Silicon Drift Detectors (SDD) and the two outer
layers are double-sided Silicon Strip Detectors (SSD). The V0 detector [49, 53] was used
for triggering and the determination of the event centrality. It consists of two arrays called V0-A and V0-C, each built from 32 scintillator counters and providing full azimuthal coverage, positioned on each side of the interaction point. The V0-A is situated at z = 3.4 m (2.8 < η < 5.1) and the V0-C is located at z =−0.9 m (−3.7 < η < −1.7). Each V0 counter provides the signal amplitude and timing information with a time resolution better than
1 ns [49, 53]. Two Zero Degree Calorimeters (ZDCs) [49] were used in the offline event
selection. The ZDCs are a pair of hadronic calorimeters, one for detecting non-interacting neutrons (ZN) and one for spectator protons (ZP), located at 112.5 m on either side of the interaction point.
4 Event and track selection
The data samples analyzed in this article were recorded by ALICE during the 2010 Pb–
Pb and 2013 p–Pb runs of the LHC at centre-of-mass energies of √sNN = 2.76 TeV and
√s
NN = 5.02 TeV, respectively. The Pb–Pb run had equal beam energies, while the p–
Pb run had beam energies of 4 TeV for protons and 1.58 TeV per nucleon for lead nuclei,
which resulted in a rapidity shift of −0.465 of the centre-of-mass system with respect to
the ALICE laboratory system. In the following, all kinematic variables are reported in the laboratory system. Minimum bias Pb–Pb and p–Pb events were triggered by the coinci-dence of signals in both V0 detectors. The trigger efficiency is 99.7% for non-diffractive
Pb–Pb collisions [54] and 99.2% for non-single-diffractive p–Pb collisions [55]. Beam
back-ground events were rejected in an offline event selection for all data samples using the timing information from the V0 and ZDC detectors and by correlating reconstructed SPD clusters and tracklets. The remaining beam background was found to be smaller than
0.1% and was neglected. More details about the offline event selection can be found in [52].
The fraction of pile-up events in the data sample is found to be negligible after applying
dedicated pile-up removal criteria [52]. Only events with a reconstructed primary vertex
within |zvtx| < 10 cm with respect to the nominal interaction point were selected. The
JHEP09(2017)032
TPC. The Pb–Pb collision centrality was determined from the measured V0 amplitude distribution [54]. The dataset of p–Pb collisions is divided into several multiplicity classes defined as fractions of the analysed event sample, based on the charge deposition in the V0-A detector. These multiplicity classes are denoted as “0–20%”, “20–40%”, “40–60%”, and “60–100%”, from the highest to the lowest multiplicity. About 13 million Pb–Pb and 92 million p–Pb minimum bias events passed all event selection criteria.
This analysis used tracks that were reconstructed based on the combined information from the TPC and ITS detectors. Primary charged tracks were required to have a distance of closest approach to the primary vertex in the longitudinal (z) direction and transverse (xy) plane smaller than 3.2 cm and 2.4 cm, respectively. Tracks with 0.2 < pT< 5.0 GeV/c were selected in the pseudorapidity range|η| < 0.8, in order to exclude non-uniformities due to the detector boundaries. Additional track quality cuts were applied to remove secondary particles (i.e. particles originating from weak decays, photon conversions and secondary hadronic interactions in the detector material) while maintaining good track reconstruction efficiency. Tracks were required to have at least 70 TPC space points out of the maximum
of 159. The χ2 of the track fit per degree of freedom in the TPC reconstruction was required
to be below 2.
5 Systematic uncertainties
The evaluation of systematic uncertainties was performed by varying the event and track selection cuts and by studying the detector response with Monte Carlo (MC) simulations. For Pb–Pb, the track selection criteria were changed to only require tracks reconstructed in the TPC alone. This led to a significant difference in most of the observables (up to 10 %), which was taken into account in the estimation of the systematic uncertainties. Altering the number of TPC space points from 70 to 80, 90 and 100 resulted in a maximum 0.5%
variation of vn results. The variation of the vn results when using other detectors, e.g.
the SPD or TPC, to determine the centrality, is less than 0.5%. No significant variation
of the vn results was seen when altering the polarity of the magnetic field of the ALICE
detector, or when narrowing the nominal |zvtx| range from 10 cm to |zvtx| < 7, 8, and
9 cm. The contribution from pileup events to the final systematic uncertainty was found to be negligible. Systematic uncertainties due to detector inefficiencies were investigated
using HIJING [56] and AMPT [57] MC simulations. The calculations for a sample at the
event generator level (i.e. without invoking either the detector geometry or the reconstruc-tion algorithm) were compared with the results of the analysis of the output of the full
reconstruction with a GEANT3 [58] detector model, in a procedure referred to as an MC
closure test. A difference of up to 4% for vn is observed, which is included in the final
systematic uncertainty. Most of the systematic uncertainties described above cancelled out for vn{2}/vn[2] and rn as indicated in table 2.
For p–Pb collisions, the approach used to evaluate the systematic uncertainty is sim-ilar. Different track quality cuts are applied, including varying the number of TPC space points, and using tracks reconstructed with the required TPC detector only instead of combined information from TPC and ITS. This leads to a systematic uncertainty of up to
JHEP09(2017)032
Pb–Pb sources v2{2} v2[2] v3{2} v3[2] v4{2} v4[2]
Track type < 4% < 4% < 10% < 8% < 8% < 8%
MC closure < 4% < 4% < 4% < 4% < 4% < 4%
Total < 5.7% < 5.7% < 10.7% < 9% < 9% < 9%
Table 1. Summary of systematic uncertainties of vn for Pb–Pb collisions.
Pb–Pb sources v2{2}/v2[2] v3{2}/v3[2] v4{2}/v4[2] r2 r3
Track type — — — < 2% < 5%
MC closure < 1% < 1% < 1% < 1% < 1%
Total < 1% < 1% < 1% < 2.2% < 5.1%
Table 2. Summary of systematic uncertainties of vn{2}/vn[2] and rn for Pb–Pb collisions.
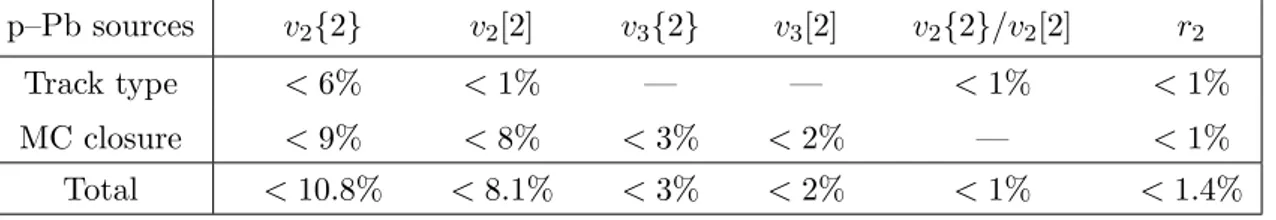
p–Pb sources v2{2} v2[2] v3{2} v3[2] v2{2}/v2[2] r2
Track type < 6% < 1% — — < 1% < 1%
MC closure < 9% < 8% < 3% < 2% — < 1%
Total < 10.8% < 8.1% < 3% < 2% < 1% < 1.4%
Table 3. Summary of systematic uncertainties for p–Pb collisions.
6% depending on the multiplicity and pT range. It was also found that varying the event
selection, which includes the cut on the |zvtx|, and the cuts to reject pileup events, yields
negligible contributions to the final systematic uncertainty. The analysis was repeated us-ing the energy deposited in the neutron ZDC (ZNA) which is located at 112.5 m from the interaction point, instead of using V0-A for the event classes determination. The observed differences with respect to the one using V0-A for event class determination is not included
as systematic uncertainty, following the previous paper [36]. In addition, the MC closure
is investigated with DPMJET simulations [59] combined with GEANT3; this leads to a
systematic uncertainty of less than 9% for pT < 0.8 GeV/c and 2% for higher pT.
The dominant sources of systematic uncertainty are summarized in tables 1,2 and 3.
The systematic uncertainties evaluated for each of the sources mentioned above were added in quadrature to obtain the total systematic uncertainty of the measurements.
6 Results and discussion
6.1 Pb–Pb collisions
Figures1and2show the pTdependence of v2{2} and v2[2] with three different
pseudorapid-ity gaps, for centralpseudorapid-ity classes from 0–5% to 70–80%. The analysed events are divided into
two sub-events A and B, separated by a pseudorapidity gap. Note that |∆η| > 0 suggests
that there is no separation in pseudorapidity between the two sub-events. Short-range correlations, one of the main sources of non-flow effects, are expected to be suppressed
JHEP09(2017)032
0 1 2 3 4 2 v 0 0.1 0.2 0-5% = 2.76 TeV NN s ALICE Pb-Pb 0 1 2 3 4 0 0.1 0.2 5-10% 0 1 2 3 4 0 0.1 0.2 10-20% 0 1 2 3 4 2 v 0 0.1 0.2 20-30% 0 1 2 3 4 0 0.1 0.2 30-40% 0 1 2 3 4 0 0.1 0.2 40-50% ) c (GeV/ T p 0 1 2 3 4 2 v 0 0.1 0.2 50-60% ) c (GeV/ T p 0 1 2 3 4 0 0.1 0.2 60-70% ) c (GeV/ T p 0 1 2 3 4 0 0.1 0.2 (ALICE) |>0} η ∆ {2,| 2 v (ALICE) |>0.4} η ∆ {2,| 2 v (ALICE) |>0.8} η ∆ {2,| 2 v /s=0.08) η (MC-Glauber, {2} 2 v /s=0.20) η (MC-KLN, {2} 2 v /s(T)) η (Trento, {2} 2 v /s=0.08) η (AMPT, {2} 2 vFigure 1. v2{2} with |∆η| > 0 (circles), |∆η| > 0.4 (diamonds) and |∆η| > 0.8 (squares) for
various centrality classes in Pb–Pb collisions at √sNN= 2.76 TeV. Hydrodynamic calculations with MC-Glauber initial conditions and η/s = 0.08 [33], with MC-KLN initial conditions and η/s = 0.20 [33], with Trento initial conditions and temperature dependent η/s [60] and AMPT initial conditions and η/s = 0.08 [60] are shown in green dot-dash, orange dashed curves, and magenta and grey shaded areas, respectively.
when using a large pseudorapidity gap. It is observed that v2{2} and v2[2] using various
pseudorapidity gaps do not change significantly for central and semi-central collisions. The
decrease of v2 with larger pseudorapidity gaps is more prominent in the most peripheral
collisions, mainly due to the suppression of non-flow effects. The results are also compared to the original predictions within the VISH2+1 hydrodynamic framework with: 1) Monte Carlo Glauber (MC-Glauber) initial conditions and η/s = 0.08; 2) Monte Carlo
Kharzeev-Levin-Nardi (MC-KLN) initial conditions and η/s = 0.20 [33]. In addition, the comparisons
to recently released calculations from the iEBE-VISHNU hydrodynamic framework with: 1) Trento initial conditions, temperature dependent shear and bulk viscosities, η/s(T) and
ζ(T); and 2) AMPT initial conditions with η/s = 0.08 [60] are also presented. These
com-binations of various initial conditions and η/s are chosen due to the fact that they give the
best descriptions of the particle spectra and the integrated flow measurements [60,61]. The
four hydrodynamic calculations describe the v2{2} very well up to pT ≈ 2 GeV/c at least
for central and semi-central collisions, as do the calculations with MC-Glauber, MC-KLN
and AMPT initial conditions for the v2[2]. For central and mid-central collisions,
calcula-tions with MC-KLN and AMPT initial condicalcula-tions predict both v2{2} and v2[2] better for
higher pT than those with MC-Glauber and Trento initial conditions. For more peripheral
collisions, the experimental v2 data in both cases fall between the four sets of predictions.
In order to probe the pT-dependent flow vector fluctuations quantitatively, the ratio
JHEP09(2017)032
0 1 2 3 4 2 v 0 0.1 0.2 0-5% = 2.76 TeV NN s ALICE Pb-Pb 0 1 2 3 4 0 0.1 0.2 5-10% 0 1 2 3 4 0 0.1 0.2 10-20% 0 1 2 3 4 2 v 0 0.1 0.2 20-30% 0 1 2 3 4 0 0.1 0.2 30-40% 0 1 2 3 4 0 0.1 0.2 40-50% ) c (GeV/ T p 0 1 2 3 4 2 v 0 0.1 0.2 50-60% ) c (GeV/ T p 0 1 2 3 4 0 0.1 0.2 60-70% ) c (GeV/ T p 0 1 2 3 4 0 0.1 0.2 |>0] (ALICE) η ∆ [2,| 2 v |>0.4] (ALICE) η ∆ [2,| 2 v |>0.8] (ALICE) η ∆ [2,| 2 v /s=0.08) η [2] (MC-Glauber, 2 v /s=0.20) η [2] (MC-KLN, 2 v /s(T)) η [2] (Trento, 2 v /s=0.08) η [2] (AMPT, 2 vFigure 2. v2[2] with|∆η| > 0 (circles), |∆η| > 0.4 (diamonds) and |∆η| > 0.8 (squares) for various
centrality classes in Pb–Pb collisions at √sNN = 2.76 TeV. Hydrodynamic calculations with MC-Glauber initial conditions [33] and η/s = 0.08, with MC-KLN initial conditions and η/s = 0.20 [33], with Trento initial conditions and temperature dependent η/s [60] and AMPT initial conditions and η/s = 0.08 [60] are shown in green dot-dashed and orange dashed curves, and magenta and grey shaded areas, respectively.
different centrality classes in figure 3. This ratio is consistent with unity up to pT ≈
2 GeV/c and starts to deviate from unity in the higher pT region in the most central
collisions. The deviations from unity are weak and within 10% in non-central collisions
in the presented pT range. To better understand whether such deviations from unity
are caused by non-flow effects, the like-sign technique, which suppresses contributions from resonance decays by correlating only particles with same charge, is applied. The differences of the measured v2{2, |∆η| > 0.8}/v2[2,|∆η| > 0.8] from like-sign and all charged particles are found to be less than 0.5%. This shows that deviations of v2{2, |∆η| > 0.8}/v2[2,|∆η| > 0.8] from unity cannot be explained solely by non-flow effects from resonance decays. It
is also seen in figure 3 that the hydrodynamic calculations with MC-KLN, Trento and
AMPT initial conditions describe the data fairly well for all centrality classes except for the most peripheral collisions, while MC-Glauber calculations reproduce the data only for mid-central and peripheral collisions. This indicates that hydrodynamic calculations with
AMPT and MC-KLN initial conditions and η/s = 0.20 not only generate reasonable v2
values, but also reproduce the measured v2{2, |∆η| > 0.8}/v2[2,|∆η| > 0.8].
The higher order anisotropic flow coefficients, which were first measured in [20], are
shown to be more sensitive to the initial conditions and η/s [12]. In figures4 and5, v3{2}
and v3[2] are shown with three different pseudorapidity gaps for several centrality classes.
JHEP09(2017)032
0 1 2 3 4 [2]2 v / {2}2 v 0.7 0.8 0.9 1 = 2.76 TeV NN s ALICE Pb-Pb 0-5% 0 1 2 3 4 0.7 0.8 0.9 1 5-10% 0 1 2 3 4 0.7 0.8 0.9 1 10-20% 0 1 2 3 4 [2]2 v / {2}2 v 0.7 0.8 0.9 1 20-30% 0 1 2 3 4 0.7 0.8 0.9 1 30-40% 0 1 2 3 4 0.7 0.8 0.9 1 40-50% ) c (GeV/ T p 0 1 2 3 4 [2]2 v / {2}2 v 0.7 0.8 0.9 1 50-60% ) c (GeV/ T p 0 1 2 3 4 0.7 0.8 0.9 1 60-70% ) c (GeV/ T p 0 1 2 3 4 0.7 0.8 0.9 1 v2{2,|∆η|>0.8} / v2[2,|∆η|>0.8] /s = 0.08) η [2] (MC-Glauber, 2 v / {2} 2 v /s = 0.20) η [2] (MC-KLN, 2 v / {2} 2 v /s(T)) η [2] (Trento, 2 v / {2} 2 v /s = 0.08) η [2] (AMPT, 2 v / {2} 2 vFigure 3. The ratio v2{2, |∆η| > 0.8}/v2[2,|∆η| > 0.8] in Pb–Pb collisions at√sNN = 2.76 TeV. The different panels show the centrality evolution of the measurements. Hydrodynamic calculations with MC-Glauber initial conditions and η/s = 0.08 [33], with MC-KLN initial conditions and η/s = 0.20 [33], with Trento initial conditions and temperature dependent η/s [60] and AMPT initial conditions and η/s = 0.08 [60] are shown in green dot-dashed and orange dashed curves, and magenta and grey shaded areas, respectively.
trend as the pseudorapidity gap increases, in particular in more peripheral collisions. Only
a weak centrality dependence is observed for both v3{2} and v3[2]. The comparison to
hydrodynamic calculations demonstrates that although hydrodynamic calculations with
MC-Glauber and MC-KLN initial conditions roughly describe v2{2} and v2[2], they cannot
describe v3{2} and v3[2] over the full pT range and for all centrality classes, and tend to
overpredict or underpredict the data. Similar as v2, the hydrodynamic calculation with
Trento initial conditions overestimates both v3{2} and v3[2] measurements, while the one
with AMPT initial conditions quantitatively describe the measured v3 for presented pT
and centrality intervals.
The ratio v3{2, |∆η| > 0.8}/v3[2,|∆η| > 0.8] is shown together with hydrodynamic
calculations in figure 6. Wider pT intervals were used for the ratio than for the individual
v3 measurements in order to suppress statistical fluctuations. It was found that the ratio
agrees with unity over a wide pT range, as opposed to v2{2, |∆η| > 0.8}/v2[2,|∆η| >
0.8]. No clear indication of pT-dependent V3 flow vector fluctuations are observed for the
presented centrality and pT regions within the large uncertainties. Despite the fact that
the hydrodynamic calculations with MC-Glauber and MC-KLN initial conditions cannot reproduce the magnitude of v3{2} and v3[2], the validity of the two sets of initial conditions
could be examined also by the comparison of the predicted v3{2}/v3[2] ratio to data, which
JHEP09(2017)032
0 1 2 3 4 3 v 0 0.05 0.1 0.15 v3 {2,|∆η|>0} |>0.4} η ∆ {2,| 3 v |>0.8} η ∆ {2,| 3 v 0-5% = 2.76 TeV NN s ALICE Pb-Pb 0 1 2 3 4 0 0.05 0.1 0.15 5-10% VISH2+1 /s=0.08) η (MC-Glauber, {2} 3 v /s=0.20) η (MC-KLN, {2} 3 v 0 1 2 3 4 0 0.05 0.1 0.15 10-20% iEBE-VISHNU /s(T)) η (Trento, {2} 3 v /s=0.08) η (AMPT, {2} 3 v ) c (GeV/ T p 0 1 2 3 4 3 v 0 0.05 0.1 0.15 20-30% ) c (GeV/ T p 0 1 2 3 4 0 0.05 0.1 0.15 30-40% ) c (GeV/ T p 0 1 2 3 4 0 0.05 0.1 0.15 40-50%Figure 4. v3{2} with different |∆η| gaps is presented in Pb–Pb collisions at √sNN = 2.76 TeV. v3{2, |∆η| > 0}, v3{2, |∆η| > 0.4}, and v3{2, |∆η| > 0.8} are represented by circles, diamonds
and squares, respectively. The different panels show the centrality evolution of the measurements. Hydrodynamic calculations with MC-Glauber initial conditions and η/s = 0.08 [33], with MC-KLN initial conditions and η/s = 0.20 [33], with Trento initial conditions and temperature dependent η/s [60] and AMPT initial conditions and η/s = 0.08 [60] are shown in green dot-dash, orange dashed curves, and magenta and grey shaded areas, respectively.
0 1 2 3 4 3 v 0 0.05 0.1 0.15 v3 [2,|∆η|>0] |>0.4] η ∆ [2,| 3 v |>0.8] η ∆ [2,| 3 v 0-5% = 2.76 TeV NN s ALICE Pb-Pb 0 1 2 3 4 0 0.05 0.1 0.15 5-10% VISH2+1 /s=0.08) η [2] (MC-Glauber, 3 v /s=0.20) η [2] (MC-KLN, 3 v 0 1 2 3 4 0 0.05 0.1 0.15 10-20% iEBE-VISHNU /s(T)) η [2] (Trento, 3 v /s=0.08) η [2] (AMPT, 3 v ) c (GeV/ T p 0 1 2 3 4 3 v 0 0.05 0.1 0.15 20-30% ) c (GeV/ T p 0 1 2 3 4 0 0.05 0.1 0.15 30-40% ) c (GeV/ T p 0 1 2 3 4 0 0.05 0.1 0.15 40-50%
Figure 5. v3[2] with different |∆η| gaps is presented in Pb–Pb collisions at √sNN = 2.76 TeV. v3[2,|∆η| > 0], v3[2,|∆η| > 0.4], and v3[2,|∆η| > 0.8] are represented by circles, diamonds, and
squares, respectively. The different panels show the centrality evolution of the measurements. Hy-drodynamic calculations with MC-Glauber initial conditions and η/s = 0.08 [33] and with MC-KLN initial conditions and η/s = 0.20 [33], with Trento initial conditions and temperature dependent η/s [60] and AMPT initial conditions and η/s = 0.08 [60] are shown in green dot-dash, orange dashed curves, and magenta and grey shaded areas, respectively.
JHEP09(2017)032
0 1 2 3 4 [2] 3 v / {2}3 v 0.9 0.95 1 1.05 0-5% = 2.76 TeV NN s ALICE Pb-Pb |>0.8] η ∆ [2,| 3 v / |>0.8} η ∆ {2,| 3 v 0 1 2 3 4 0.9 0.95 1 1.05 5-10% /s = 0.08) η [2] (MC-Glauber, 3 v / {2} 3 v /s = 0.20) η [2] (MC-KLN, 3 v / {2} 3 v 0 1 2 3 4 0.9 0.95 1 1.05 10-20% /s(T)) η [2] (Trento, 3 v / {2} 3 v /s = 0.08) η [2] (AMPT, 3 v / {2} 3 v ) c (GeV/ T p 0 1 2 3 4 [2] 3 v / {2}3 v 0.9 0.95 1 1.05 20-30% ) c (GeV/ T p 0 1 2 3 4 0.9 0.95 1 1.05 30-40% ) c (GeV/ T p 0 1 2 3 4 0.9 0.95 1 1.05 40-50%Figure 6. The ratio v3{2, |∆η| > 0.8}/v3[2,|∆η| > 0.8] in Pb–Pb collisions at√sNN = 2.76 TeV. The different panels show the centrality evolution of the measurements. Hydrodynamic calculations with MC-Glauber initial conditions and η/s = 0.08 [33] and with MC-KLN initial conditions and η/s = 0.20 [33], with Trento initial conditions and temperature dependent η/s [60] and AMPT initial conditions and η/s = 0.08 [60] are shown in green dot-dash, orange dashed curves, and magenta and grey shaded areas, respectively.
especially the one with MC-KLN initial conditions, overestimate the possible pT-dependent
V3 flow vector fluctuations, despite the good description for the second harmonic. A good
agreement between data and hydrodynamic calculations from iEBE-VISHNU is found for all centrality intervals. This is expected for AMPT initial conditions as the calculations
quantitatively reproduce both measured v3{2} and v3[2] as discussed above. However, the
calculations with Trento initial conditions, which overestimate both v3{2} and v3[2], are
consistent with the measured v3{2, |∆η| > 0.8}/v3[2,|∆η| > 0.8] ratio. This accidental agreement needs further investigations in the iEBE-VISHNU framework to understand the physics mechanism responsible for this behaviour.
The centrality dependence of v4{2} and v4[2] with three different pseudorapidity gaps
are shown in figures 7 and 8. Decreasing trends with increasing |∆η| gaps and a weak
centrality dependence are observed for both measurements. The hydrodynamic calcula-tions with MC-Glauber and Trento initial condicalcula-tions overestimate the measurements of
v4{2} and v4[2], while the calculations with MC-KLN initial conditions underestimate the
measurements, similar to what was seen for the v3 observables. On the other hand, the
hydrodynamic calculations from AMPT initial conditions agree with the measurements of v4{2} and v4[2]. Moreover, the ratio v4{2, |∆η| > 0.8}/v4[2,|∆η| > 0.8] shown in figure 9
is in agreement with unity albeit with large uncertainties for the presented pT range and
centrality classes. The validity of the hydrodynamic calculations cannot be judged due to the large uncertainties of the v4{2, |∆η| > 0.8}/v4[2,|∆η| > 0.8] measurements.
Alternatively, one can search for pT-dependent flow vector fluctuations via the
JHEP09(2017)032
0 1 2 3 4 4 v 0 0.05 0.1 0.15 0-5% |>0} η ∆ {2,| 4 v |>0.4} η ∆ {2,| 4 v |>0.8} η ∆ {2,| 4 v = 2.76 TeV NN s ALICE Pb-Pb 0 1 2 3 4 0 0.05 0.1 0.15 5-10% VISH2+1 /s=0.08) η (MC-Glauber, {2} 4 v /s=0.20) η (MC-KLN, {2} 4 v 0 1 2 3 4 0 0.05 0.1 0.15 10-20% iEBE-VISHNU /s(T)) η (Trento, {2} 4 v /s=0.08) η (AMPT, {2} 4 v ) c (GeV/ T p 0 1 2 3 4 4 v 0 0.05 0.1 0.15 20-30% ) c (GeV/ T p 0 1 2 3 4 0 0.05 0.1 0.15 30-40% ) c (GeV/ T p 0 1 2 3 4 0 0.05 0.1 0.15 40-50%Figure 7. v4{2} with different |∆η| gaps is presented in Pb–Pb collisions at √sNN = 2.76 TeV. v4{2, |∆η| > 0}, v4{2, |∆η| > 0.4} and v4{2, |∆η| > 0.8} are represented by circles, diamonds,
and squares, respectively. The different panels show the centrality evolution of the measurements. Hydrodynamic calculations with MC-Glauber initial conditions and η/s = 0.08 [33], with MC-KLN initial conditions and η/s = 0.20 [33], with Trento initial conditions and temperature dependent η/s [60] and AMPT initial conditions and η/s = 0.08 [60] are shown in green dot-dash, orange dashed curves, and magenta and grey shaded areas, respectively.
0 1 2 3 4 4 v 0 0.05 0.1 0.15 0-5% = 2.76 TeV NN s ALICE Pb-Pb |>0] η ∆ [2,| 4 v |>0.4] η ∆ [2,| 4 v |>0.8] η ∆ [2,| 4 v 0 1 2 3 4 0 0.05 0.1 0.15 5-10% VISH2+1 /s=0.08) η [2] (MC-Glauber, 4 v /s=0.20) η [2] (MC-KLN, 4 v 0 1 2 3 4 0 0.05 0.1 0.15 10-20% iEBE-VISHNU /s(T)) η [2] (Trento, 4 v /s=0.08) η [2] (AMPT, 4 v ) c (GeV/ T p 0 1 2 3 4 4 v 0 0.05 0.1 0.15 20-30% ) c (GeV/ T p 0 1 2 3 4 0 0.05 0.1 0.15 30-40% ) c (GeV/ T p 0 1 2 3 4 0 0.05 0.1 0.15 40-50%
Figure 8. v4[2] with different |∆η| gaps is presented in Pb–Pb collisions at √sNN = 2.76 TeV. v4[2,|∆η| > 0], v4[2,|∆η| > 0.4], and v4[2,|∆η| > 0.8] are represented by circles, diamonds, and
squares, respectively. The different panels show the centrality evolution of the measurements. Hy-drodynamic calculations with MC-Glauber initial conditions and η/s = 0.08 [33] and with MC-KLN initial conditions and η/s = 0.20 [33], with Trento initial conditions and temperature dependent η/s [60] and AMPT initial conditions and η/s = 0.08 [60] are shown in green dot-dash, orange dashed curves, and magenta and grey shaded areas, respectively.
JHEP09(2017)032
0 1 2 3 4 [2] 4 v / {2}4 v 0.8 0.9 1 1.1 0-5% = 2.76 TeV NN s ALICE Pb-Pb |>0.8] η ∆ [2,| 4 v / |>0.8} η ∆ {2,| 4 v 0 1 2 3 4 0.8 0.9 1 1.1 5-10% /s = 0.08) η [2] (MC-Glauber, 4 v / {2} 4 v /s = 0.20) η [2] (MC-KLN, 4 v / {2} 4 v 0 1 2 3 4 0.8 0.9 1 1.1 10-20% /s(T)) η [2] (Trento, 4 v / {2} 4 v /s = 0.08) η [2] (AMPT, 4 v / {2} 4 v ) c (GeV/ T p 0 1 2 3 4 [2] 4 v / {2}4 v 0.8 0.9 1 1.1 20-30% ) c (GeV/ T p 0 1 2 3 4 0.8 0.9 1 1.1 30-40% ) c (GeV/ T p 0 1 2 3 4 0.8 0.9 1 1.1 40-50%Figure 9. The ratio v4{2, |∆η| > 0.8}/v4[2,|∆η| > 0.8] in Pb–Pb collisions at√sNN = 2.76 TeV. The different panels show the centrality evolution of the measurements. Hydrodynamic calculations with MC-Glauber initial conditions and η/s = 0.08 [33] and with MC-KLN initial conditions and η/s = 0.20 [33], with Trento initial conditions and temperature dependent η/s [60] and AMPT initial conditions and η/s = 0.08 [60] are shown in green dot-dash, orange dashed curves, and magenta and grey shaded areas, respectively.
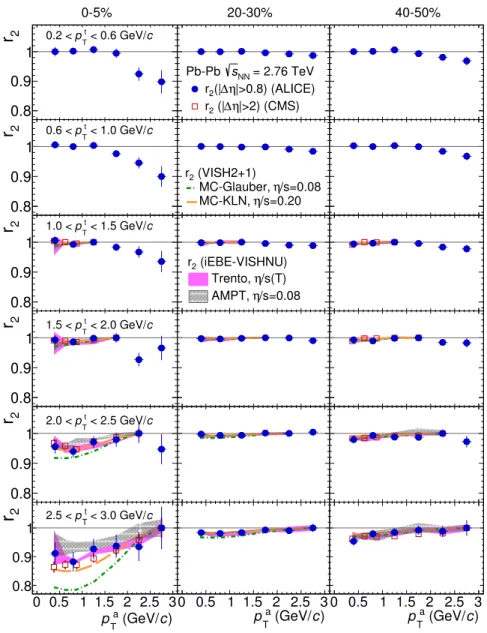
and 11 as a function of ptT and pTa with |∆η| > 0.8 for three centrality classes in Pb–Pb
collisions at √sNN = 2.76 TeV. By construction, rn= 1 when the triggered and associated
particles are from the same pT interval. In contrast to the previous analysis [34], there
is no ptT ≥ pTa cut applied here to avoid auto-correlations (taking the same particle as
both triggered and associated particles in the two-particle azimuthal correlations). The triggered particles are always selected from the negative pseudorapidity region and the
associated particles are from the positive pseudorapidity region. The r2 value deviates
significantly from unity for the most central collisions. This effect becomes stronger with an increasing difference between ptT and pTa. The previous results indicated that
factorisa-tion holds approximately for n ≥ 2 and pT below 4 GeV/c, while deviations emerging at
higher pT were ascribed to recoil jet contributions [34]. This analysis, however, shows that
factorisation breaks down at lower pT when the more sensitive observable, r2, is used. The
deviation reaches 10% for the lowest pa
T in the 0–5% centrality range, for 2.5 < ptT <
3 GeV/c. One explanation from [32] is that this deviation is due to the pT-dependent V2
flow vector fluctuations, which originate from initial event-by-event geometry fluctuations.
Hydrodynamic calculations [33] are compared to data for the presented centrality classes
and for selected pTbins. Both hydrodynamic calculations from VISH2+1 and iEBE-VISHNU
frameworks qualitatively predict the trend of r2, while the data agree quantitatively better
with iEBE-VISHNU. In addition, the CMS measurements [41, 47] are consistent with our
measurements.
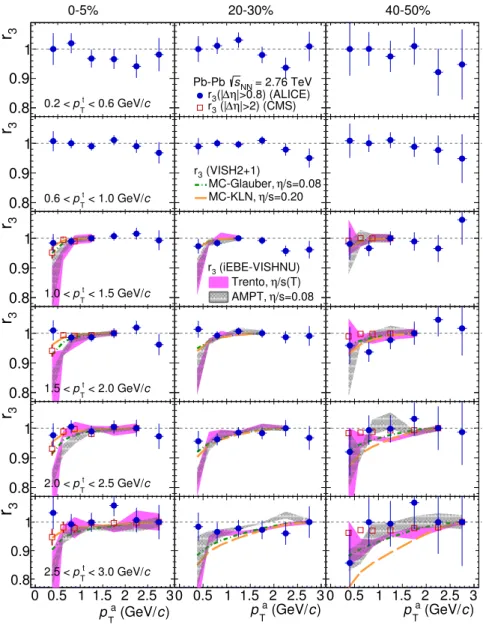
For r3, the results are compatible with unity, and can be described by hydrodynamic
JHEP09(2017)032
0 0.5 1 1.5 2 2.5 3 2 r 0.8 0.9 1 c < 0.6 GeV/ t T p 0.2 < 0 0.5 1 1.5 2 2.5 3 0.8 0.9 1 = 2.76 TeV NN s Pb-Pb |>0.8) (ALICE) η ∆ (| 2 r |>2) (CMS) η ∆ (| 2 r 0 0.5 1 1.5 2 2.5 3 0.8 0.9 1 0 0.5 1 1.5 2 2.5 3 2 r 0.8 0.9 1 c < 1.0 GeV/ t T p 0.6 < 0 0.5 1 1.5 2 2.5 3 0.8 0.9 1 (VISH2+1) 2 r /s=0.08 η MC-Glauber, /s=0.20 η MC-KLN, 0 0.5 1 1.5 2 2.5 3 0.8 0.9 1 0 0.5 1 1.5 2 2.5 3 2 r 0.8 0.9 1 c < 1.5 GeV/ t T p 1.0 < 0 0.5 1 1.5 2 2.5 3 0.8 0.9 1 (iEBE-VISHNU) 2 r /s(T) η Trento, /s=0.08 η AMPT, 0 0.5 1 1.5 2 2.5 3 0.8 0.9 1 0 0.5 1 1.5 2 2.5 3 2 r 0.8 0.9 1 c < 2.0 GeV/ t T p 1.5 < 0 0.5 1 1.5 2 2.5 3 0.8 0.9 1 0 0.5 1 1.5 2 2.5 3 0.8 0.9 1 0 0.5 1 1.5 2 2.5 3 2 r 0.8 0.9 1 c < 2.5 GeV/ t T p 2.0 < 0 0.5 1 1.5 2 2.5 3 0.8 0.9 1 0 0.5 1 1.5 2 2.5 3 0.8 0.9 1 ) c (GeV/ a T p 0 0.5 1 1.5 2 2.5 3 2r
0.8 0.9 1 c < 3.0 GeV/ t T p 2.5 < ) c (GeV/ a T p 0 0.5 1 1.5 2 2.5 3 0.8 0.9 1 ) c (GeV/ a T p 0 0.5 1 1.5 2 2.5 3 0.8 0.9 1 0-5% 20-30% 40-50%Figure 10. The factorisation ratio r2, as a function of pTa in bins of ptT for 0–5%, 20–30% and
40–50% centralities in Pb–Pb collisions at √sNN = 2.76 TeV, is presented (solid circles). CMS measurements are presented by open square [41]. Hydrodynamic calculations with MC-Glauber initial conditions and η/s = 0.08 [33] and with MC-KLN initial conditions and η/s = 0.20 [33], with Trento initial conditions and temperature dependent η/s [60] and AMPT initial conditions and η/s = 0.08 [60] are shown in green dot-dash, orange dashed curves, and magenta and grey shaded areas, respectively.
uncertainties. The factorisation is valid over a wider range of pa
T, ptT and centrality ranges,
as opposed to r2. The possible breakdown of factorisation, if it exists, is within 10% when
both pTa and ptT are below 3 GeV/c. The CMS measurements [41, 47] are consistent with
the r3 results presented here despite the fact that the pseudorapidity gaps are different
between the two measurements. Better agreements with hydrodynamic calculations are observed with VISH2+1.
JHEP09(2017)032
0 0.5 1 1.5 2 2.5 3 3 r 0.8 0.9 1 c < 0.6 GeV/ t T p 0.2 < 0 0.5 1 1.5 2 2.5 3 0.8 0.9 1 = 2.76 TeV NN s Pb-Pb |>0.8) (ALICE) η ∆ (| 3 r |>2) (CMS) η ∆ (| 3 r 0 0.5 1 1.5 2 2.5 3 0.8 0.9 1 0 0.5 1 1.5 2 2.5 3 3 r 0.8 0.9 1 c < 1.0 GeV/ t T p 0.6 < 0 0.5 1 1.5 2 2.5 3 0.8 0.9 1 (VISH2+1) 3 r /s=0.08 η MC-Glauber, /s=0.20 η MC-KLN, 0 0.5 1 1.5 2 2.5 3 0.8 0.9 1 0 0.5 1 1.5 2 2.5 3 3 r 0.8 0.9 1 c < 1.5 GeV/ t T p 1.0 < 0 0.5 1 1.5 2 2.5 3 0.8 0.9 1 (iEBE-VISHNU) 3 r /s(T) η Trento, /s=0.08 η AMPT, 0 0.5 1 1.5 2 2.5 3 0.8 0.9 1 0 0.5 1 1.5 2 2.5 3 3 r 0.8 0.9 1 c < 2.0 GeV/ t T p 1.5 < 0 0.5 1 1.5 2 2.5 3 0.8 0.9 1 0 0.5 1 1.5 2 2.5 3 0.8 0.9 1 0 0.5 1 1.5 2 2.5 3 3 r 0.8 0.9 1 c < 2.5 GeV/ t T p 2.0 < 0 0.5 1 1.5 2 2.5 3 0.8 0.9 1 0 0.5 1 1.5 2 2.5 3 0.8 0.9 1 ) c (GeV/ a T p 0 0.5 1 1.5 2 2.5 3 3r
0.8 0.9 1 c < 3.0 GeV/ t T p 2.5 < ) c (GeV/ a T p 0 0.5 1 1.5 2 2.5 3 0.8 0.9 1 ) c (GeV/ a T p 0 0.5 1 1.5 2 2.5 3 0.8 0.9 1 0-5% 20-30% 40-50%Figure 11. The factorisation ratio r3, as a function of pTa in bins of ptT for 0–5%, 20–30% and
40–50% centralities in Pb–Pb collisions at √sNN = 2.76 TeV, is presented (solid circles). CMS measurements [41] are presented by open squares. Hydrodynamic calculations with MC-Glauber initial conditions and η/s = 0.08 [33] and with MC-KLN initial conditions and η/s = 0.20 [33], with Trento initial conditions and temperature dependent η/s [60] and AMPT initial conditions and η/s = 0.08 [60] are shown in green dot-dash, orange dashed curves, and magenta and grey shaded areas, respectively.
6.2 p–Pb collisions
Figure 12 presents v2{2} and v2[2] with |∆η| > 0 and |∆η| > 0.8 for various
multiplic-ity classes in p–Pb collisions at √sNN = 5.02 TeV. It is shown that, after applying the
pseudorapidity gap |∆η| > 0.8, both v2{2} and v2[2] decrease substantially, in particular for more peripheral collisions, mainly due to the reduction of non-flow effects. The ratio v2{2, |∆η| > 0.8}/v2[2,|∆η| > 0.8], shown in figure 13, displays hints of deviations from
JHEP09(2017)032
) c (GeV/ T p 0 1 2 3 4 2 v 0 0.2 0.4 ALICE p-Pb [2,|∆η|>0]sNN = 5.02 TeV 2 v |>0.8] η ∆ [2,| 2 v |>0} η ∆ {2,| 2 v |>0.8} η ∆ {2,| 2 v 0-20% V0-A ) c (GeV/ T p 0 1 2 3 4 0 0.2 0.4 20-40% V0-A Kozlov et.al. [2] 2 v {2} 2 v ) c (GeV/ T p 0 1 2 3 4 40-60% V0-A DPMJET |>0.8] η ∆ [2,| 2 v |>0.8} η ∆ {2,| 2 vFigure 12. v2{2, |∆η| > 0}, v2[2,|∆η| > 0], v2{2, |∆η| > 0.8} and v2[2,|∆η| > 0.8] for various
multiplicity classes of p–Pb collisions at √sNN= 5.02 TeV. DPMJET calculations are presented by red shaded lines for v2{2, |∆η| > 0.8} and blue shaded lines for v2[2,|∆η| > 0.8]. Hydrodynamic
calculations (MUSIC) [62] with modified MC-Glauber initial conditions and η/s = 0.08 for v2{2}
and v2[2] are shown in solid blue and dashed red lines.
unity above pT ≈ 2 GeV/c, but the statistical uncertainties are still too large to draw a firm
conclusion. The DPMJET model [59], which is an implementation of the two-component
Dual Parton Model for the description of interactions involving nuclei, and contains no collective effects, has been used as a benchmark to study the influence of non-flow in p–Pb
collisions [38]. The calculations based on DPMJET simulations are compared to data. It is
observed in figure12that DPMJET overestimates v2 significantly for the presented
multi-plicity classes, and generates higher v2coefficients in lower multiplicity regions. Meanwhile,
figure 13 shows that for v2{2}/v2[2] the agreement between data and DPMJET is better
in low multiplicity p–Pb collisions, where no evidence of anisotropic collectivity is achieved
from previous measurements [36,38]. In addition, the hydrodynamic calculations [62] from
MUSIC v2.0 using a modified MC-Glauber initial state and η/s = 0.08 are also presented in
figures 12 and 13. These calculations in general underpredict the measured v2 coefficients
but agree better with the data in high multiplicity than in low multiplicity classes. It should
be emphasized that in contrast to hydrodynamic calculations, the measured v2{2} and v2[2]
increase (albeit very slightly in particular when the |∆η| gap is applied) from 0–20% to
40–60% multiplicity classes, which indicates that non-flow effects might play a more impor-tant role in low multiplicity events. This could explain the increasing deviation between
data and hydrodynamic calculations with pTand towards lower multiplicity classes, shown
in figure 12. The hydrodynamic calculations reproduce the v2{2}/v2[2] measurements in
the 0–20 % multiplicity class, which seems to indicate that hydrodynamic collectivity is present in high multiplicity p–Pb collisions. However, it is still unclear at the moment why the measured ratio is still reproduced by hydrodynamic calculations for multiplicity class
above 20%, where no significant flow signal is expected to be produced [38]. The
agree-ment might be accidental since the DPMJET and hydrodynamic calculations also agree with each other in this class.
The v3{2} and v3[2] measured with |∆η| > 0 and |∆η| > 0.8 in p–Pb collisions at
√s
NN = 5.02 TeV are shown in figure 14. Both v3{2, |∆η| > 0} and v3[2,|∆η| > 0]
in-crease with pT and also with decreasing multiplicity. The measured v3{2} and v3[2] with
JHEP09(2017)032
) c (GeV/ T p 0 1 2 3 4 [2] 2 / v {2}2 v 0.7 0.8 0.9 1 0-20% V0-A = 5.02 TeV NN s ALICE p-Pb |>0.8] η ∆ [2,| 2 /v |>0.8} η ∆ {2,| 2 v ) c (GeV/ T p 0 1 2 3 4 0.7 0.8 0.9 1 20-40% V0-A [2] (Kozlov et.al.) 2 /v {2} 2 v |>0.8] (DPMJET) η ∆ [2,| 2 /v |>0.8} η ∆ {2,| 2 v ) c (GeV/ T p 0 1 2 3 4 40-60% V0-AFigure 13. The ratio v2{2, |∆η| > 0.8}/v2[2,|∆η| > 0.8] for various multiplicity classes in p–
Pb collisions at √sNN = 5.02 TeV. DPMJET calculations are presented by green shaded lines. Hydrodynamic calculations (MUSIC) [62] with modified MC-Glauber initial conditions and η/s = 0.08 are shown as solid blue lines.
) c (GeV/ T p 0 1 2 3 4 3 v 0 0.05 0.1 0.15 0.2 |>0] η ∆ [2,| 3 v |>0.8] η ∆ [2,| 3 v |>0} η ∆ {2,| 3 v |>0.8} η ∆ {2,| 3 v = 5.02 TeV NN s ALICE p-Pb 0-20% V0-A ) c (GeV/ T p 0 1 2 3 4 0 0.05 0.1 0.15 0.2 [2] (Kozlov et.al.) 3 v (Kozlov et.al.) {2} 3 v 20-40% V0-A ) c (GeV/ T p 0 1 2 3 4 40-60% V0-A
Figure 14. v3{2, |∆η| > 0}, v3[2,|∆η| > 0], v3{2, |∆η| > 0.8} and v3[2,|∆η| > 0.8] for various
multiplicity classes in p–Pb collisions at √sNN= 5.02 TeV. Hydrodynamic calculations (MUSIC) [62] with modified MC-Glauber initial conditions and η/s = 0.08 for v2{2} and v2[2] are shown as solid
blue and dashed red lines.
deviation increasing as a function of pT. The relative influence of non-flow effects appears
to be stronger in v3than in v2measurements. A similar qualitative behaviour was observed
for pT-integrated two-particle cumulants c2{2} and c3{2} in p–Pb collisions, measured as
functions of multiplicity for different|∆η| gaps [36]. It might be worth noting that part of
the remaining non-flow contamination with |∆η| > 0.8, the recoil jet ridge, has a positive
sign contribution for v2 and a negative sign one for v3 for pT > 2 GeV/c. In addition, it
is found that hydrodynamic calculations describe the data better at high multiplicity than
at low multiplicity, while DPMJET generates negative (v3[2])2 values for all multiplicity
classes and thus cannot be shown here for comparison. Furthermore, the deviations be-tween v3{2, |∆η| > 0.8} and v3[2,|∆η| > 0.8] are not observed for the presented pT region.
There is no indication of pT-dependent V3 flow vector fluctuations in p–Pb collisions.
Figure 15shows r2(|∆η| > 0.8) measurements as a function of pTa in three ptT intervals
for multiplicity classes 0–20%, 20–40% and 40–60% in p–Pb collisions at √sNN = 5.02 TeV.
The r2(|∆η| > 0.8) deviates from unity when the pTt and pTa are well away from each
other (most pronouncedly in the lowest and highest pTt bins) with the trend being
simi-lar for all multiplicity classes. As mentioned earlier, the deviation is more significant at high multiplicity. In overlapping pTt and pTa intervals, the r2 measurements in the highest
JHEP09(2017)032
multiplicity p–Pb events are consistent with those made by CMS collaboration [47]. The
breakdown of factorisation is more pronounced in high multiplicity p–Pb collisions than
in the 40–50% centrality class in Pb–Pb collisions (see figure 10). The DPMJET
calcu-lations are presented for comparison. It is clearly seen that DPMJET overestimates the
deviations of r2 from unity in the high multiplicity region, nevertheless, the calculation
describes the data better in low multiplicity events in which non-flow effects are dominant. At the same time, these measurements are found to be compatible with hydrodynamic calculations using modified MC-Glauber initial conditions and η/s = 0.08. When selecting the triggered particles from 0.6 < pt
T <1.0 GeV/c or 1.0 < pTt < 1.5 GeV/c, the trend of r2 looks similar to that of v2{2}/v2[2], mainly because the mean pT of charged particles is within 0.6 <⟨pT⟩ < 1.0 GeV/c [63].
7 Summary
Searches for pT-dependent flow vector fluctuations are performed by measuring vn{2}/vn[2]
and rn in Pb–Pb collisions at √sNN = 2.76 TeV and p–Pb collisions at √sNN = 5.02 TeV.
In Pb–Pb collisions, both v2{2}/v2[2] and r2 show deviations from unity, and the r2results are consistent with previous measurements from the CMS collaboration. These effects are more pronounced in the most central collisions and cannot be explained solely by non-flow
effects. Therefore, these results suggest the presence of possible V2 vector fluctuations in
Pb–Pb collisions. It further implies that the traditional v2{2} results should be interpreted
precisely as the correlations of the azimuthal angle of produced particles with respect to
the pT integrated flow vector over a certain kinematic region. Future comparisons between
theoretical calculations and experimental measurements should be based on the same kine-matic conditions. These comparisons, performed under carefully defined precisely matching kinematic conditions, are crucial to constrain the initial conditions and precisely extract
the transport properties of the produced matter, without possible bias from additional pT
-dependent flow vector fluctuations. Meanwhile, no significant deviation of v3{2}/v3[2] or
v4{2}/v4[2] from unity was observed, meaning that there is no indication of pT-dependent
V3 and V4 vector fluctuations. The comparison to hydrodynamic calculations shows only
the calculations from iEBE-VISHNU with AMPT initial conditions could describe the data quantitatively. The measurements presented in this paper provide a unique approach to constrain the initial conditions and transport properties, e.g. shear viscosity over entropy density ratio η/s of the QGP, complementing the previous anisotropic flow measurements. The results therefore bring new insights into the properties of the QGP produced in rela-tivistic heavy ion collisions at the CERN Large Hadron Collider.
Similar studies were performed in various multiplicity classes in p–Pb collisions.
De-viations of v2{2}/v2[2] and r2 from unity are observed, although with relatively large
statistical fluctuations. For the highest p–Pb multiplicity class, the deviations are sig-nificantly overestimated by DPMJET; however, they are compatible with hydrodynamic calculations using modified MC-Glauber initial conditions and η/s = 0.08. Meanwhile for low multiplicity p–Pb collisions, the data sits between calculations from DPMJET and hy-drodynamics. Neither the DPMJET model, which does not incorporate anisotropic flow,
JHEP09(2017)032
0 1 2 3 2 r 0.6 0.8 1 1.2 < 0.6 GeV/c t T 0.2 < p 0 1 2 3 0.6 0.8 1 1.2 = 5.02 TeV NN s ALICE p-Pb 0 1 2 3 0.6 0.8 1 1.2 0 1 2 3 2 r 0.6 0.8 1 1.2 < 1.0 GeV/c t T 0.6 < p 0 1 2 3 0.6 0.8 1 1.2 |>0.8) (ALICE) η ∆ (| 2 r 0 1 2 3 0.6 0.8 1 1.2 0 1 2 3 2 r 0.6 0.8 1 1.2 < 1.5 GeV/c t T 1.0 < p 0 1 2 3 0.6 0.8 1 1.2 (Kozlov et.al.) 2 r 0 1 2 3 0.6 0.8 1 1.2 0 1 2 3 2 r 0.6 0.8 1 1.2 < 2.0 GeV/c t T 1.5 < p 0 1 2 3 0.6 0.8 1 1.2 |>0.8) (DPMJET) η ∆ (| 2 r 0 1 2 3 0.6 0.8 1 1.2 0 1 2 3 2 r 0.6 0.8 1 1.2 < 2.5 GeV/c t T 2.0 < p 0 1 2 3 0.6 0.8 1 1.2 0 1 2 3 0.6 0.8 1 1.2 0 1 2 3 2 r 0.6 0.8 1 1.2 < 3.0 GeV/c t T 2.5 < p 0 1 2 3 0.6 0.8 1 1.2 0 1 2 3 0.6 0.8 1 1.2 ) c (GeV/ a T p 0 1 2 3 2 r 0.6 0.8 1 1.2 < 4.0 GeV/c t T 3.0 < p ) c (GeV/ a T p 0 1 2 3 0.6 0.8 1 1.2 ) c (GeV/ a T p 0 1 2 3 0.6 0.8 1 1.20-20% V0-A 0-40% V0-A 40-60% V0-A
Figure 15. The factorisation ratio r2, as a function of pTain bins of ptTfor multiplicity classes 0–20%,
20–40% and 40–60% in p–Pb collisions at √sNN= 5.02 TeV, are presented by solid magenta circles. DPMJET calculations are presented by pink shaded areas. Hydrodynamic calculations (MUSIC) with modified MC-Glauber initial conditions and η/s = 0.08 are shown as magenta lines [62].
nor the hydrodynamic model, which does not include non-flow contributions, could provide a quantitative description of the data. Future theoretical developments together with com-parisons to high-precision measurements are crucial to give a certain answer concerning
pT-dependent vector Vn fluctuations in p–Pb collisions.
Acknowledgments
The ALICE collaboration would like to thank all its engineers and technicians for their invaluable contributions to the construction of the experiment and the CERN accelerator
JHEP09(2017)032
teams for the outstanding performance of the LHC complex. The ALICE collaboration gratefully acknowledges the resources and support provided by all Grid centres and the Worldwide LHC Computing Grid (WLCG) collaboration. The ALICE collaboration ac-knowledges the following funding agencies for their support in building and running the ALICE detector: A.I. Alikhanyan National Science Laboratory (Yerevan Physics Insti-tute) Foundation (ANSL), State Committee of Science and World Federation of Scientists
(WFS), Armenia; Austrian Academy of Sciences and Nationalstiftung f¨ur Forschung,
Tech-nologie und Entwicklung, Austria; Ministry of Communications and High TechTech-nologies, National Nuclear Research Center, Azerbaijan; Conselho Nacional de Desenvolvimento
Cient´ıfico e Tecnol´ogico (CNPq), Universidade Federal do Rio Grande do Sul (UFRGS),
Financiadora de Estudos e Projetos (Finep) and Funda¸c˜ao de Amparo `a Pesquisa do
Es-tado de S˜ao Paulo (FAPESP), Brazil; Ministry of Science & Technology of China (MSTC),
National Natural Science Foundation of China (NSFC) and Ministry of Education of China (MOEC) , China; Ministry of Science, Education and Sport and Croatian Science Foun-dation, Croatia; Ministry of Education, Youth and Sports of the Czech Republic, Czech Republic; The Danish Council for Independent Research — Natural Sciences, the Carlsberg Foundation and Danish National Research Foundation (DNRF), Denmark; Helsinki
Insti-tute of Physics (HIP), Finland; Commissariat `a l’Energie Atomique (CEA) and Institut
Na-tional de Physique Nucl´eaire et de Physique des Particules (IN2P3) and Centre NaNa-tional de
la Recherche Scientifique (CNRS), France; Bundesministerium f¨ur Bildung, Wissenschaft,
Forschung und Technologie (BMBF) and GSI Helmholtzzentrum f¨ur Schwerionenforschung
GmbH, Germany; General Secretariat for Research and Technology, Ministry of Education, Research and Religions, Greece; National Research, Development and Innovation Office, Hungary; Department of Atomic Energy Government of India (DAE) and Council of Sci-entific and Industrial Research (CSIR), New Delhi, India; Indonesian Institute of Science, Indonesia; Centro Fermi — Museo Storico della Fisica e Centro Studi e Ricerche Enrico Fermi and Istituto Nazionale di Fisica Nucleare (INFN), Italy; Institute for Innovative Sci-ence and Technology , Nagasaki Institute of Applied SciSci-ence (IIST), Japan Society for the Promotion of Science (JSPS) KAKENHI and Japanese Ministry of Education, Culture, Sports, Science and Technology (MEXT), Japan; Consejo Nacional de Ciencia
(CONA-CYT) y Tecnolog´ıa, through Fondo de Cooperaci´on Internacional en Ciencia y Tecnolog´ıa
(FONCICYT) and Direcci´on General de Asuntos del Personal Academico (DGAPA),
Mex-ico; Nederlandse Organisatie voor Wetenschappelijk Onderzoek (NWO), Netherlands; The Research Council of Norway, Norway; Commission on Science and Technology for
Sustain-able Development in the South (COMSATS), Pakistan; Pontificia Universidad Cat´olica del
Per´u, Peru; Ministry of Science and Higher Education and National Science Centre, Poland;
Korea Institute of Science and Technology Information and National Research Foundation of Korea (NRF), Republic of Korea; Ministry of Education and Scientific Research, In-stitute of Atomic Physics and Romanian National Agency for Science, Technology and Innovation, Romania; Joint Institute for Nuclear Research (JINR), Ministry of Education and Science of the Russian Federation and National Research Centre Kurchatov Institute, Russia; Ministry of Education, Science, Research and Sport of the Slovak Republic, Slo-vakia; National Research Foundation of South Africa, South Africa; Centro de Aplicaciones
JHEP09(2017)032
Tecnol´ogicas y Desarrollo Nuclear (CEADEN), Cubaenerg´ıa, Cuba, Ministerio de Ciencia
e Innovacion and Centro de Investigaciones Energ´eticas, Medioambientales y Tecnol´ogicas
(CIEMAT), Spain; Swedish Research Council (VR) and Knut & Alice Wallenberg Founda-tion (KAW), Sweden; European OrganizaFounda-tion for Nuclear Research, Switzerland; NaFounda-tional Science and Technology Development Agency (NSDTA), Suranaree University of Technol-ogy (SUT) and Office of the Higher Education Commission under NRU project of Thailand, Thailand; Turkish Atomic Energy Agency (TAEK), Turkey; National Academy of Sciences of Ukraine, Ukraine; Science and Technology Facilities Council (STFC), United Kingdom; National Science Foundation of the United States of America (NSF) and United States Department of Energy, Office of Nuclear Physics (DOE NP), United States of America.
Open Access. This article is distributed under the terms of the Creative Commons
Attribution License (CC-BY 4.0), which permits any use, distribution and reproduction in
any medium, provided the original author(s) and source are credited.
References
[1] E.V. Shuryak, Quark-gluon Plasma and Hadronic Production of Leptons, Photons and Psions,Phys. Lett. B 78 (1978) 150[INSPIRE].
[2] E.V. Shuryak, Quantum Chromodynamics and the Theory of Superdense Matter,Phys. Rept.
61 (1980) 71[INSPIRE].
[3] J.-Y. Ollitrault, Anisotropy as a signature of transverse collective flow,Phys. Rev. D 46
(1992) 229[INSPIRE].
[4] S.A. Voloshin, A.M. Poskanzer and R. Snellings, Collective phenomena in non-central nuclear collisions,arXiv:0809.2949[INSPIRE].
[5] U. Heinz and R. Snellings, Collective flow and viscosity in relativistic heavy-ion collisions,
Ann. Rev. Nucl. Part. Sci. 63 (2013) 123[arXiv:1301.2826] [INSPIRE].
[6] S. Voloshin and Y. Zhang, Flow study in relativistic nuclear collisions by Fourier expansion of Azimuthal particle distributions,Z. Phys. C 70 (1996) 665[hep-ph/9407282] [INSPIRE].
[7] A.M. Poskanzer and S.A. Voloshin, Methods for analyzing anisotropic flow in relativistic nuclear collisions,Phys. Rev. C 58 (1998) 1671[nucl-ex/9805001] [INSPIRE].
[8] A.P. Mishra, R.K. Mohapatra, P.S. Saumia and A.M. Srivastava, Super-horizon fluctuations and acoustic oscillations in relativistic heavy-ion collisions,Phys. Rev. C 77 (2008) 064902
[arXiv:0711.1323] [INSPIRE].
[9] A.P. Mishra, R.K. Mohapatra, P.S. Saumia and A.M. Srivastava, Using cosmic microwave background radiation analysis tools for flow anisotropies in relativistic heavy-ion collisions,
Phys. Rev. C 81 (2010) 034903[arXiv:0811.0292] [INSPIRE].
[10] J. Takahashi et al., Topology studies of hydrodynamics using two particle correlation analysis,
Phys. Rev. Lett. 103 (2009) 242301[arXiv:0902.4870] [INSPIRE].
[11] B. Alver and G. Roland, Collision-geometry fluctuations and triangular flow in heavy-ion collisions,Phys. Rev. C 81 (2010) 054905[Erratum ibid. C 82 (2010) 039903]
[arXiv:1003.0194] [INSPIRE].
[12] B.H. Alver, C. Gombeaud, M. Luzum and J.-Y. Ollitrault, Triangular flow in hydrodynamics and transport theory,Phys. Rev. C 82 (2010) 034913 [arXiv:1007.5469] [INSPIRE].
JHEP09(2017)032
[13] D. Teaney and L. Yan, Triangularity and Dipole Asymmetry in Heavy Ion Collisions, Phys.Rev. C 83 (2011) 064904[arXiv:1010.1876] [INSPIRE].
[14] M. Luzum, Collective flow and long-range correlations in relativistic heavy ion collisions,
Phys. Lett. B 696 (2011) 499[arXiv:1011.5773] [INSPIRE].
[15] BRAHMS collaboration, I. Arsene et al., Quark gluon plasma and color glass condensate at RHIC? The Perspective from the BRAHMS experiment,Nucl. Phys. A 757 (2005) 1
[nucl-ex/0410020] [INSPIRE].
[16] PHOBOS collaboration, B.B. Back et al., The PHOBOS perspective on discoveries at RHIC,Nucl. Phys. A 757 (2005) 28 [nucl-ex/0410022] [INSPIRE].
[17] STAR collaboration, J. Adams et al., Experimental and theoretical challenges in the search for the quark gluon plasma: The STAR collaboration’s critical assessment of the evidence from RHIC collisions,Nucl. Phys. A 757 (2005) 102[nucl-ex/0501009] [INSPIRE].
[18] PHENIX collaboration, K. Adcox et al., Formation of dense partonic matter in relativistic nucleus-nucleus collisions at RHIC: Experimental evaluation by the PHENIX collaboration,
Nucl. Phys. A 757 (2005) 184[nucl-ex/0410003] [INSPIRE].
[19] ALICE collaboration, Elliptic flow of charged particles in Pb-Pb collisions at 2.76 TeV,
Phys. Rev. Lett. 105 (2010) 252302[arXiv:1011.3914] [INSPIRE].
[20] ALICE collaboration, Higher harmonic anisotropic flow measurements of charged particles in Pb-Pb collisions at √sNN= 2.76 TeV,Phys. Rev. Lett. 107 (2011) 032301
[arXiv:1105.3865] [INSPIRE].
[21] ALICE collaboration, Elliptic flow of identified hadrons in Pb-Pb collisions at √s
NN= 2.76 TeV,JHEP 06 (2015) 190[arXiv:1405.4632] [INSPIRE].
[22] ALICE collaboration, Anisotropic flow of charged particles in Pb-Pb collisions at √s
NN= 5.02 TeV,Phys. Rev. Lett. 116 (2016) 132302[arXiv:1602.01119] [INSPIRE]. [23] ALICE collaboration, Linear and non-linear flow modes in Pb-Pb collisions at
√s
NN= 2.76 TeV,arXiv:1705.04377[INSPIRE].
[24] ATLAS collaboration, Measurement of the pseudorapidity and transverse momentum dependence of the elliptic flow of charged particles in lead-lead collisions at √sNN = 2.76 TeV with the ATLAS detector,Phys. Lett. B 707 (2012) 330[arXiv:1108.6018] [INSPIRE].
[25] ATLAS collaboration, Measurement of the azimuthal anisotropy for charged particle production in √sNN= 2.76 TeV lead-lead collisions with the ATLAS detector, Phys. Rev. C
86 (2012) 014907[arXiv:1203.3087] [INSPIRE].
[26] ATLAS collaboration, Measurement of the distributions of event-by-event flow harmonics in lead-lead collisions at = 2.76 TeV with the ATLAS detector at the LHC,JHEP 11 (2013) 183
[arXiv:1305.2942] [INSPIRE].
[27] CMS collaboration, Centrality dependence of dihadron correlations and azimuthal anisotropy harmonics in PbPb collisions at √sNN = 2.76 TeV,Eur. Phys. J. C 72 (2012) 2012
[arXiv:1201.3158] [INSPIRE].
[28] CMS collaboration, Measurement of the elliptic anisotropy of charged particles produced in PbPb collisions at √sNN = 2.76 TeV,Phys. Rev. C 87 (2013) 014902[arXiv:1204.1409]
[INSPIRE].
[29] CMS collaboration, Azimuthal anisotropy of charged particles at high transverse momenta in PbPb collisions at √sNN = 2.76 TeV,Phys. Rev. Lett. 109 (2012) 022301[arXiv:1204.1850]
JHEP09(2017)032
[30] ALICE collaboration, Correlated event-by-event fluctuations of flow harmonics in Pb-Pbcollisions at √sNN= 2.76 TeV,Phys. Rev. Lett. 117 (2016) 182301[arXiv:1604.07663]
[INSPIRE].
[31] H. Song, Y. Zhou and K. Gajdosova, Collective flow and hydrodynamics in large and small systems at the LHC,Nucl. Sci. Tech. 28 (2017) 99[arXiv:1703.00670] [INSPIRE].
[32] F.G. Gardim, F. Grassi, M. Luzum and J.-Y. Ollitrault, Breaking of factorization of two-particle correlations in hydrodynamics,Phys. Rev. C 87 (2013) 031901
[arXiv:1211.0989] [INSPIRE].
[33] U. Heinz, Z. Qiu and C. Shen, Fluctuating flow angles and anisotropic flow measurements,
Phys. Rev. C 87 (2013) 034913[arXiv:1302.3535] [INSPIRE].
[34] ALICE collaboration, Harmonic decomposition of two-particle angular correlations in Pb-Pb collisions at √sNN= 2.76 TeV,Phys. Lett. B 708 (2012) 249[arXiv:1109.2501] [INSPIRE]. [35] ALICE collaboration, Long-range angular correlations on the near and away side in p-Pb
collisions at √sNN= 5.02 TeV,Phys. Lett. B 719 (2013) 29[arXiv:1212.2001] [INSPIRE]. [36] ALICE collaboration, Long-range angular correlations of π, K and p in p-Pb collisions at
√s
NN= 5.02 TeV,Phys. Lett. B 726 (2013) 164[arXiv:1307.3237] [INSPIRE].
[37] ALICE collaboration, Multiplicity dependence of pion, kaon, proton and lambda production in p-Pb collisions at √sNN= 5.02 TeV,Phys. Lett. B 728 (2014) 25 [arXiv:1307.6796]
[INSPIRE].
[38] ALICE collaboration, Multiparticle azimuthal correlations in p-Pb and Pb-Pb collisions at the CERN Large Hadron Collider,Phys. Rev. C 90 (2014) 054901[arXiv:1406.2474]
[INSPIRE].
[39] ATLAS collaboration, Observation of Associated Near-Side and Away-Side Long-Range Correlations in √sNN= 5.02 TeV Proton-Lead Collisions with the ATLAS Detector,Phys.
Rev. Lett. 110 (2013) 182302[arXiv:1212.5198] [INSPIRE].
[40] ATLAS collaboration, Measurement with the ATLAS detector of multi-particle azimuthal correlations in p + P b collisions at √sNN = 5.02 TeV,Phys. Lett. B 725 (2013) 60
[arXiv:1303.2084] [INSPIRE].
[41] CMS collaboration, Studies of azimuthal dihadron correlations in ultra-central PbPb collisions at √sNN= 2.76 TeV,JHEP 02 (2014) 088[arXiv:1312.1845] [INSPIRE]. [42] CMS collaboration, Multiplicity and transverse momentum dependence of two- and four-particle correlations in pPb and PbPb collisions,Phys. Lett. B 724 (2013) 213
[arXiv:1305.0609] [INSPIRE].
[43] CMS collaboration, Study of the production of charged pions, kaons and protons in pPb collisions at √sNN= 5.02 TeV,Eur. Phys. J. C 74 (2014) 2847[arXiv:1307.3442]
[INSPIRE].
[44] CMS collaboration, Long-range two-particle correlations of strange hadrons with charged particles in pPb and PbPb collisions at LHC energies,Phys. Lett. B 742 (2015) 200
[arXiv:1409.3392] [INSPIRE].
[45] CMS collaboration, Evidence for Collective Multiparticle Correlations in p-Pb Collisions,
Phys. Rev. Lett. 115 (2015) 012301[arXiv:1502.05382] [INSPIRE].
[46] LHCb collaboration, Measurements of long-range near-side angular correlations in √s
NN= 5 TeV proton-lead collisions in the forward region,Phys. Lett. B 762 (2016) 473

![Figure 2. v 2 [2] with |∆η| > 0 (circles), |∆η| > 0.4 (diamonds) and |∆η| > 0.8 (squares) for various](https://thumb-eu.123doks.com/thumbv2/123dokorg/5574302.66724/10.892.155.737.121.489/figure-η-gt-circles-η-diamonds-squares-various.webp)
![Figure 3. The ratio v 2 {2, |∆η| > 0.8}/v 2 [2, |∆η| > 0.8] in Pb–Pb collisions at √ s NN = 2.76 TeV](https://thumb-eu.123doks.com/thumbv2/123dokorg/5574302.66724/11.892.156.733.123.488/figure-the-ratio-pb-pb-collisions-nn-tev.webp)
![Figure 5. v 3 [2] with different |∆η| gaps is presented in Pb–Pb collisions at √ s NN = 2.76 TeV](https://thumb-eu.123doks.com/thumbv2/123dokorg/5574302.66724/12.892.152.739.610.917/figure-different-gaps-presented-pb-pb-collisions-tev.webp)
![Figure 6. The ratio v 3 {2, |∆η| > 0.8}/v 3 [2, |∆η| > 0.8] in Pb–Pb collisions at √ s NN = 2.76 TeV](https://thumb-eu.123doks.com/thumbv2/123dokorg/5574302.66724/13.892.157.741.121.433/figure-the-ratio-pb-pb-collisions-nn-tev.webp)
![Figure 8. v 4 [2] with different |∆η| gaps is presented in Pb–Pb collisions at √ s NN = 2.76 TeV](https://thumb-eu.123doks.com/thumbv2/123dokorg/5574302.66724/14.892.153.739.613.916/figure-different-gaps-presented-pb-pb-collisions-tev.webp)
![Figure 9. The ratio v 4 {2, |∆η| > 0.8}/v 4 [2, |∆η| > 0.8] in Pb–Pb collisions at √ s NN = 2.76 TeV](https://thumb-eu.123doks.com/thumbv2/123dokorg/5574302.66724/15.892.159.739.121.433/figure-the-ratio-pb-pb-collisions-nn-tev.webp)