U
NIVERSITÀ DELLA
C
ALABRIA
Dipartimento di Matematica
Dottorato di Ricerca in Matematica ed Informatica
XXII ciclo
Tesi di Dottorato
Knowledge Discovery in Bioinformatics
:
from Simple to Complex Structures
I wish to thank my PhD advisor prof. Luigi Palopoli for the precious advices that led me through my personal and professional growth.
I wish to thank my parents and my sisters for their faithful support.
I wish to thank my best friend Ilario for always being close, despite the distance. Last but not least, a special thank to Sweetie for his help and moral support, for sharing with me dreams and expectations, notwithstanding the dark road along which we are walking together.
died in Place du Carrousel and to Jacques Pr´evert
who portrayed him so well. To Sweetie
Life is the point upon which the whole universe lies. However, the knowledge about life machinery is very poor in comparison to the complexity of biological processes regulating it. Many efforts have been done to better understand mechanisms under-lying life, grasp the key concepts about the processes of birth, growth and death and trim the incompleteness of the knowledge about life basic elements.
This thesis is meant to be helpful in this direction, trying to enlighten some shady issues relevant in bioinformatics. In particular, the work that has been done tries to clarify some biological processes regulating cell life cycle in different organisms, by comparing their simple and complex building blocks.
On the one hand, simple biological structures (i.e., proteins) have been analyzed. This way, the unknown functions of uncharacterized proteins or the biological pro-cesses in which they are involved can be determined. To this aim two approaches have been devised:
• PQSC-FCNN: a tool for predicting protein quaternary structure, which is related
to the biological function of the protein when involved in specific biological pro-cesses.
• Bi-Grappin: a tool for annotating proteins with functional information by
com-paring protein-protein interaction networks.
On the other hand, complex biological structures (i.e, biological networks) of different organisms have been explored. This way, functional modules conserved during the evolution can be identified. In this respect, two approaches have been proposed:
• Sub-Grappin: a tool for the pairwise alignment of protein-protein interaction
net-works.
The above mentioned approaches have been proved, by experimental evaluations, to be able to discover significant biological results. This is promising since it allows to help in complementing the knowledge about biological processes regulating the cell life cycle. This way, by looking within the simple elements of life (i.e., living cells) the knowledge beyond these simple elements can be grasped.
A look to the future research perspectives, in this promising research area, hints that the efforts payed in this direction can be greatly rewarded through the results that will be obtained in the long term.
Rende (CS), Italy, Valeria Fionda
Part I Bioinformatics: Background and Uptake
1 Introduction and Overview . . . . 3
1.1 Main Contributions . . . 5 1.2 Problem Description . . . 5 1.3 Outlook . . . 7 1.3.1 Thesis’ Structure . . . 7 1.3.2 Reader’s Guide . . . 8 1.3.3 Publications . . . 10 2 Background . . . . 11 2.1 Background on Proteins . . . 11
2.1.1 Protein Primary Structure . . . 13
2.1.2 Protein Secondary Structure . . . 13
2.1.3 Protein Tertiary Structure . . . 14
2.1.4 Protein Quaternary Structure . . . 15
2.2 Biological Networks . . . 17
2.2.1 Transcriptional Regulatory Networks . . . 17
2.2.2 Signal Transduction Networks . . . 18
2.2.3 Metabolic Networks . . . 18
2.2.4 Protein-Protein Interaction Networks . . . 19
2.2.5 Domain Interaction Networks . . . 19
2.2.6 Gene Co-Expression Networks . . . 20
2.2.7 Genetic Interaction Networks . . . 20
2.2.8 The Cell: a Network of Networks . . . 20
2.2.9 Biological Network Modeling . . . 21
2.3 Protein Function Prediction . . . 21
2.4 Biological Network Analysis . . . 22
Part II Protein Function Prediction
3 Protein Function Prediction: the State of the Art . . . . 27
3.1 Protein Function . . . 27
3.2 Protein Function Prediction . . . 28
3.2.1 Homology Search and Transfer of Annotations . . . 28
3.2.2 Function Inference by Genomic Context . . . 32
3.2.3 Phylogenomic Approaches . . . 34
3.2.4 Protein Interaction Networks . . . 36
3.3 Protein Quaternary Structure Prediction . . . 36
3.4 Protein Function Prediction by PPI networks analysis . . . 38
3.5 Concluding Remarks . . . 40
4 Protein Quaternary Structure Prediction . . . . 41
4.1 Introduction . . . 41
4.2 Related Work . . . 43
4.3 Classification through PQSC-FCNN . . . 44
4.4 Experiments . . . 47
4.5 Concluding Remarks . . . 51
5 Bi-Grappin:Functional Similarity Search by PPI Network Analysis . . . 53
5.1 Introduction . . . 53
5.2 A Technique for Protein Similarity Refinement . . . 55
5.2.1 The Bi-Grappin Algorithm . . . 56
5.2.2 Application Cases . . . 59
5.3 Related Work . . . 64
5.4 Experimental Validation . . . 64
5.4.1 Functional Orthologs Detection . . . 65
5.4.2 Common Processes Detection . . . 68
5.5 Concluding Remarks . . . 71
Part III Network Alignment 6 Network Alignment Techniques: an Overview . . . . 75
6.1 PPI Network Alignment . . . 75
6.2 An Overview on PPI Network Alignment Techniques . . . 76
6.2.1 Local Network Alignment Methods . . . 76
6.2.2 Global Alignment Methods . . . 81
6.3 Discussion . . . 83
7 Sub-Grappin: Extracting Similar Subgraphs across PPI Networks . . . . 85 7.1 Introduction . . . 85 7.2 Preliminaries . . . 87 7.3 Methods . . . 89 7.3.1 Bi-Grappin . . . 89 7.3.2 Collapse . . . 90 7.3.3 Sub-Grappin . . . 92 7.4 Related Work . . . 95 7.5 Results . . . 96 7.5.1 Validation Measures . . . 96
7.5.2 Settings and Configurations . . . 98
7.5.3 Comparison with Existing Methods . . . 100
7.5.4 Discussion . . . 101
7.6 Concluding Remarks . . . 104
Part IV Network Querying 8 PInG-Q: a Tool for Protein Interaction Graph Querying . . . 109
8.1 Introduction . . . 109
8.2 The Proposed Approach . . . 110
8.2.1 Technical details . . . 113
8.3 Related Work . . . 117
8.4 Experimental Results . . . 118
8.4.1 Querying D. melanogaster and C. elegans by S. cerevisiae . . 119
8.4.2 Querying H. sapiens by S. cerevisiae . . . 122
8.5 Concluding Remarks . . . 123
9 Biological Network Querying Systems: Analysis and Comparison . . . 125
9.1 Introduction . . . 125
9.2 Preliminaries . . . 126
9.2.1 Biological Network Modeling . . . 126
9.2.2 Node Similarity Computation . . . 128
9.2.3 Approximation Handling . . . 129
9.2.4 Problem Statement . . . 130
9.3 Methods . . . 131
9.3.1 Methods Developed to Query PPI Networks . . . 132
9.3.2 Methods Developed to Query Metabolic Networks . . . 135
9.3.3 Methods Developed to Query Varied Biological Networks . . 138
9.3.4 Methods Developed to Query General Biological Graphs . . . 140
9.4 Coarse-Grain Comparison . . . 141
9.4.1 Supported Query Structure . . . 142
9.4.2 Adoption of Exact versus Heuristic Algorithms . . . 143
9.4.3 Computational Complexity . . . 143
9.5 Discussion . . . 147
9.6 Concluding Remarks . . . 147
Part V Conclusions and Future Trends 10 Conclusions and Future Trends . . . 151
10.1 Content Summary . . . 151
10.2 Contributions . . . 152
10.2.1 Simple Biological Structures . . . 152
10.2.2 Complex Biological Structures . . . 153
10.3 Future Trends . . . 154
10.4 Concluding Remarks . . . 155
1.1 Relations between bioinformatics tasks. . . 4
1.2 Simple and complex structures exploited in bioinformatics. . . 4
1.3 The three main ways of comparing biological networks. . . 6
1.4 Structure of the thesis and chapter dependencies . . . 9
2.1 Different levels of protein structures. . . 12
2.2 Two examples of protein secondary structure: α helix and β sheet. . . . 14
2.3 An example of protein tertiary structure. . . 15
2.4 An example of protein quaternary structure. . . 16
2.5 Examples of graph structure. . . 17
2.6 An example of biological network graph GN. . . . 21
2.7 Comparing biological networks: the three main ways. . . 24
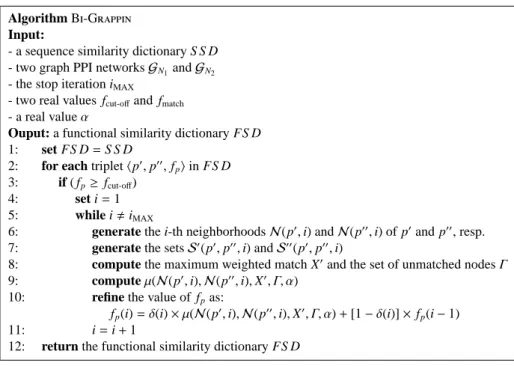
5.1 The Bi-Grappin algorithm. . . 58
5.2 Example 1: increasing of the initial similarity value. . . 60
5.3 Example 2: decreasing of the initial similarity value. . . 62
5.4 Example 3: a final comprehensive example. . . 63
5.5 Some interesting pairings in (a) yeast and fly; (b) yeast and worm. . . . 70
5.6 Yeast and fly Rnp11 1-neighborhood: (a) available and (b) enriched. . 70
6.1 (a) Node insertion; (b) node mismatch; (c) edge insertion. . . 76
7.1 The Collapse algorithm. . . 91
7.2 The Sub-Grappin algorithm. . . 92
7.3 (a) RSD for G′Nand G′′N; (b) the two networks G′Nand G′′N. . . 94
7.4 Gb′ Nand bG ′′ N(a) OSD and (b) after the first iteration of Collapse. . . . 94
7.5 (a) OSD for bG′ Nand bG ′′ Nand (b) bG ′ Nand bG ′′ N. . . 94
7.6 The two pairs of subgraphs extracted by Sub-Grappin. . . 95
7.7 The aligned proteasome subgraphs of (a) yeast and (b) human. . . 103
8.1 The PInG-Q algorithm. . . 111
8.2 (a) Node insertion; (b) node deletion. . . 114
8.3 Comparison on the longer mating-pheromone response pathway. . . 120
8.4 Comparison on the functional module from Spirin and Mirny [192]. . 121
8.5 Querying H. sapiens by S. cerevisiae: example 1 . . . 122
8.6 Querying H. sapiens by S. cerevisiae: example 2 . . . 123
9.1 An example of (a) undirected and (b) directed graph . . . 127
9.2 An example of biological network graph GN. . . 128
9.3 (a) The query sub-network; (b) the target network; (c) a solution. . . 130
9.4 (a)-(c) Query examples; (d) target network and (e) similarity ratings. 131 9.5 (a) Query; (b) target network; and (c) PATHBLAST alignment graph. 132 9.6 (a) Query; (b) target network; and (c) QNet solutions. . . 133
9.7 (a) Query proteins; (b) target network; and (c) Torque solutions. . . 135
9.8 (a) Query; (b) target network; and (c) PInG-Q solutions. . . 136
9.9 (a) Query; (b) target network; and (c) MetaPathwayHunter solutions. 137 9.10 (a) Query; (b) target network; and (c) MetaPAT solutions. . . 138
9.11 (a) Query; (b) target network; and (c) PathMatch graph G′. . . 140
9.12 (a) Query; (b) target network; and (c) GraphMatch solutions. . . 140
2.1 The nomenclature used to identify protein quaternary structures . . . 16
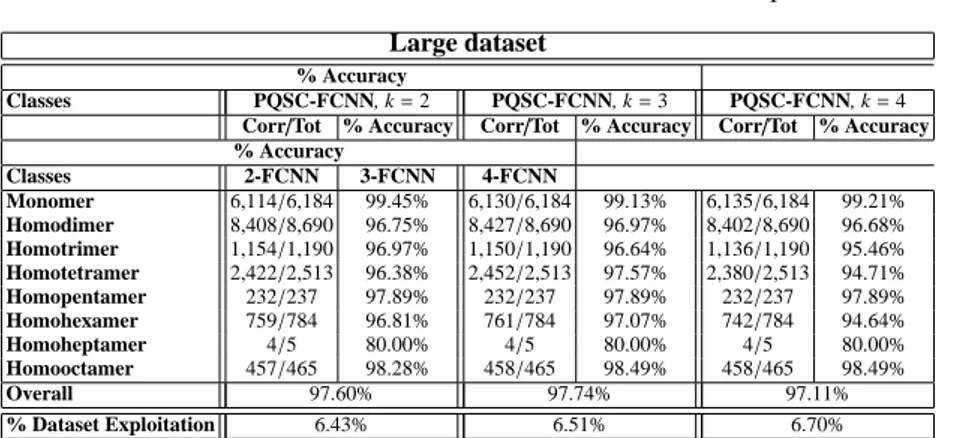
4.1 Precision of 2-FCNN, 3-FCNN, 4-FCNN on a 20,068 protein dataset. 47 4.2 Condensed sets related to the dataset of 20,068 proteins. . . 48
4.3 Comparison of precision scores obtained by PQSC-FCNN and NNA. 49 4.4 Precision of 2-FCNN, 3-FCNN, 4-FCNN on a 33,273 protein dataset. 50 4.5 Condensed sets related to the dataset of 33,273 proteins. . . 50
4.6 Precision of 2-FCNN, 3-FCNN, 4-FCNN on a 31,807 protein dataset. 51 4.7 Condensed sets related to the dataset of 31,807 proteins. . . 51
5.1 Functional orthologs detection in yeast and fly networks. . . . 66
5.2 Functional orthologs detection in yeast and worm networks. . . . 67
5.3 Best score pairs of proteins in: yeast and fly; yeast and worm. . . . 69
6.1 Overall comparison of the PPI network alignment methods. . . 83
7.1 List of acronyms and abbreviations . . . 93
7.2 The Sub-Grappin system configurations. . . 100
7.3 The total number of discovered subgraph pairs. . . 100
7.4 The maximum sizes of the conserved subgraphs pairs discovered. . . . 100
7.5 Comparison between Sub-Grappin and NetworkBlast-M . . . 101
7.6 Validation scores for the three discussed subgraph alignments . . . 102
7.7 Protein similarity scores for the proteasome complex . . . 102
7.8 Protein similarity scores for the PP2A complex . . . 103
7.9 Protein similarity scores for the cytoskeleton complex . . . 105
9.1 Notation used in the chapter. . . 131
9.2 Comparison summary . . . 145
Introduction and Overview
The development of biotechnology, that is, the application of the principles of en-gineering and technology to the life sciences, has led to the birth of a new field of research: Bioinformatics. Bioinformatics was born at the end of the 70s when the emerging ICTs found a wide use in the project of genome sequencing.
Several definitions of Bioinformatics have been proposed, all of which underline the role of this research area as a bridge linking life science and computer science. The National Center for Biotechnology Information (NCBI), for instance, defines bioinformatics as:
“Bioinformatics is the field of science in which biology, computer science, and information technology merge into a single discipline. There are three important sub-disciplines within bioinformatics: the development of new algorithms and statistics with which to assess relationships among members of large data sets; the analy-sis and interpretation of various types of data including nucleotide and amino acid sequences, protein domains, and protein structures; and the development and imple-mentation of tools that enable efficient access and management of different types of information.”
Generally speaking, bioinformatics tasks can be subdivided in two main groups: the first group concerns the design and maintenance of biological data banks while the second one is related to the design of algorithms and systems for data manip-ulation and knowledge discovery. As matter of fact, these two strands of research cross-fertilize each other, as also exemplified in Figure 1.1. In particular, on the one hand, software and algorithms are developed by exploiting biological data banks, from which biological data useful for their evaluation are extracted. On the other hand, by exploiting bioinformatics systems, new information is inferred and, possi-bly, used to enrich available data banks.
In this general context, this thesis focuses in particular on the design and im-plementation of new algorithmic and software solutions to address relevant bioinfor-matics problems, such as protein function prediction, network alignment and network
querying.
In the last few years, biological data banks were populated with a very large amount of data produced by research in Systems Biology. These data convey
infor-Fig. 1.1. Relations between bioinformatics tasks.
mation about single macromolecules such as proteins and genes which can be seen as the cell building blocks, as well as the interactions among such macromolecules. Starting from these interaction data it is possible to build more complex bioinformat-ics structures as shown in Figure 1.2. For instance, interactions among proteins are exploited to build protein-protein interaction networks, whereas biochemical reac-tions involving enzymes and metabolites are used to build metabolic networks.
To properly look up the large amount of biological data, available in the plethora of biological data, banks and mine useful information, the design and development of automatic tools has become crucial.
At the beginning, the interest of researchers was focused merely on tools to mine bio-sequences. In fact, several efforts have been paid for genome sequencing and designing procedures to compare biological sequences to search for similar regions. In this respect, notable examples are the Needleman and Wunsch algorithm [146] for global sequence alignment, and the Smith and Waterman algorithm [189] for local sequence alignment. These basic tools, then, evolved giving birth to very popular sequence alignment tools, such as FASTA [160] and BLAST [202]. At the same
time, algorithms for motif search1 and identification of coding regions in genomic sequences were also developed.
More recently, the study of proteins, protein relations and macromolecules com-plex structures has gained momentum. In particular, by looking at proteins as inde-pendent macromolecules, a relevant task has become the prediction of protein func-tions, with the aim of properly understanding the role of uncharacterized proteins within living cells. However, the observation that proteins, and macromolecules in general, can be better characterized by analyzing their interaction patterns has given birth to the definition of a formal model, grounded on the graph theory, to represent the set of molecular interactions of an organism referred to as Biological Networks. Hence, biological networks can be fed as input to graph-based techniques that would try to infer new information about cellular activity and evolutive processes of the species. Indeed, by comparing the biological networks of two different species the transfer of knowledge, from one species to another, is also possible by identifying similar regions in the two input networks.
The aim of this thesis is also that of investigating the applications and opportuni-ties in this latter group of bioinformatics tasks and provide useful tools to overcome some of the relevant problems thereof.
1.1 Main Contributions
The goal of this thesis is to provide innovative software tools for knowledge dis-covery in bioinformatics concerning the analysis of both simple (i.e., proteins) and complex (i.e., protein-protein interaction networks) structures. In particular, some ef-forts have been paid to predict the functions of uncharacterized proteins and discover functional modules in protein-protein interaction networks. A comprehensive exper-imental evaluation is also provided to substantiate the effectiveness of the proposed approaches from a biological point of view.
1.2 Problem Description
Proteins are essential parts of organisms which participate in virtually every pro-cess within cells. Many proteins work as biochemical catalysators, also known as enzymes, that catalyze the reactions occurring in living organisms. Proteins can in-teract with other molecules to perform storage and transport functions. Moreover, these fundamental components provide mechanical support and shape to tissues and mechanical work as, for example, the muscular contraction. Finally, several proteins have an essential role in decoding cellular information. Therefore, understanding the functions performed by proteins within the cell is a key bioinformatics task.
The function of a protein is determined by its three-dimensional structure. The tools developed to face this task, providing information about the three-dimensional
1A motif is a nucleotide or amino-acid sequence pattern that is widespread and has, or is
folding of a given protein, are also useful to understand the function performed by the latter.
The first part of this thesis is oriented to protein function prediction, accom-plished by using two different methods:
• PQSC-FCNN: a protein quaternary structure prediction tool that leverages the
number of polypeptidic chains within a given protein;
• Bi-Grappin: based on the analysis of protein-protein interactions and, in
particu-lar, on the idea that similar proteins have similar interaction profiles.
However, biological processes regulating the cell life cycle stem from complex interactions among cell constituents. Therefore, the behavior of the cell can be deeply understood if the analysis is not limited to a mere individual study of cell building blocks (e.g., proteins, genes) but also encompasses more complex structures (e.g., protein complexes). In this respect, recently, some automatic tools have been devel-oped, which aim at mining new knowledge about cellular processes by exploiting interaction data. These tools exploit Biological Networks as a formal model to en-code molecular interactions among cell building blocks.
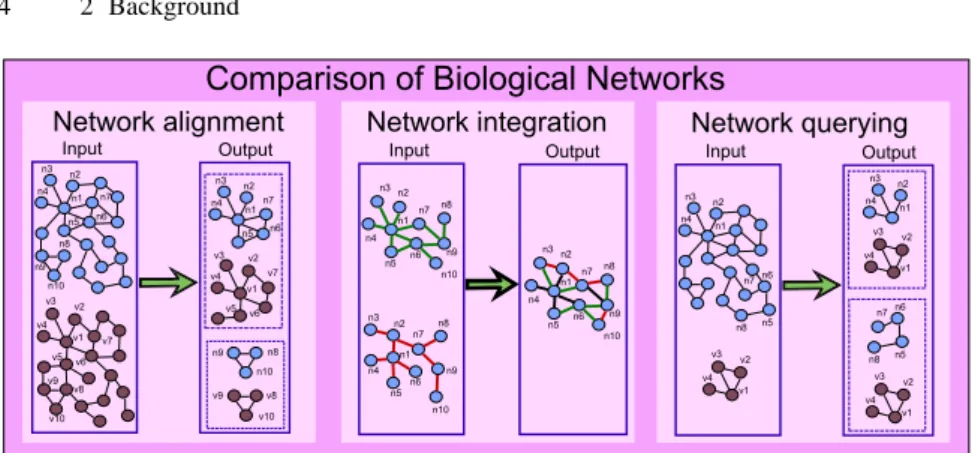
In this context, there are several ways to compare biological networks, but
net-work alignment, netnet-work integration and netnet-work querying, have surely to be
re-garded as the most significant ones [181]. In Figure 1.3 these concepts are summa-rized.
Fig. 1.3. The three main ways of comparing biological networks.
Network alignment is the process of globally comparing two or more networks
of the same type belonging to different species, in order to identify similarity and dissimilarity regions. Network alignment is commonly applied to detect conserved sub-networks, which are likely to represent common functional modules [184].
Network integration is the process of combining several networks of the same
species, representing different kinds of interactions (e.g., protein, metabolic), to study their interrelations. For instance, network integration techniques have been
used to predict protein interactions and identify protein modules [98, 236].
Finally, network querying techniques search a whole biological network to identify conserved occurrences of a given query module, which can be used for transfer-ring biological knowledge from one species to another (or possibly within the same species). Indeed, since the query generally encodes a well-characterized functional module (e.g., the MAPK cascade in yeast), its occurrences in the queried network (e.g., the MAPK cascade in human) suggest that the latter (and then the correspond-ing organism) features the function encoded by the former.
The second part of this thesis concerns the comparative analysis of biological networks and, in particular, protein-protein interaction (or PPI) networks. More pre-cisely, two tools have been developed, namely:
• Sub-Grappin: a tool to preform network alignment; • PInG-Q: a tool to query PPI networks.
1.3 Outlook
This section provides the reader with an overview on the content of this thesis. More-over, a chapter dependency schema is also sketched. This schema is intended to help the reader in following the path that motivated each individual chapter and under-stand how chapters are connected to one another.
1.3.1 Thesis’ Structure
Part I comprises two chapters (i.e., chapters 1 and 2). Chapter 1 introduces and motivates the work presented in the other chapters. Moreover, a reader’s guide is presented. Chapter 2 provides some background; in particular, some information is given both on simple (i.e., proteins) and complex (i.e., biological networks) biolog-ical strictures . Moreover, an overview on the motivations behind the study of both these structures (i.e., protein function prediction and biological network analysis) is provided. Overall, the aim of this chapter is to grip the reader’s interest and create a well-founded motivation for the work done in later chapters.
Part II comprises three chapters (i.e., chapters 3, 4 and 5). Chapter 3 charts the state of the art in protein function prediction. This background is necessary to prop-erly understand the motivations of the work presented in the two subsequent chap-ters (i.e., chapchap-ters 4 and 5). In particular, Chapter 4 is focused on the prediction of the quaternary structure of proteins, which characterizes the biological function of a protein when involved in specific biological processes. In Chapter 5, the tool Bi-Grappin, whose aim is to compute protein functional similarity across protein in-teraction networks of different organisms, is presented. This tool can be useful when comparing two networks, one of which is well-characterized while the other one is uncharacterized, to predict the unknown functions of proteins.
Part III comprises two chapters (i.e., chapters 6 and 7). In Chapter 6, the ap-proaches presented in the literature for aligning two or more biological networks are described. This is useful to understand the advantages and disadvantages of the approach we developed for the same purpose, which is called Sub-Grappin and is discussed in Chapter 7.
Part IV consists of two chapters (i.e., chapters 8 and 9). In Chapter 8, a novel approach to querying protein interaction networks, called PInG-Q, is presented. The aim of Chapter 9 is that of analyzing and comparing tools devised to query biolog-ical networks, also considering the method presented in Chapter 8. This analysis is intended to help in understanding problems and research issues, state of the art and opportunities for researchers working in this area.
Finally, Part V sketches final conclusions and discusses future trends in the bioin-formatics fields. Here, the contribution of the present thesis will be once more out-lined w.r.t. the motivations and requirements identified at the beginning.
1.3.2 Reader’s Guide
The present thesis has been written following a logical path interconnecting the var-ious research contributions. However, it is possible to recognize two main threads. The first is related to bioinformatics simple structures (i.e., proteins) considered as single macromolecules and is discussed in Part II. The second part is related to Bio-logical Network analysis and concerns Part III and IV.
As for the first thread, a reader interested in this specific problem can focus on Part II even if the content included in the introductory chapter and the second one have to be considered as compulsory premises to it. Part II has been logically divided in three sub-parts. The Chapter 3 gives some background necessary to understand the problem of protein function prediction and draws the state of the art in this area. This introductory chapter is a must to understand the subsequent two chapters (Chapter 4 and 5). In facts, Chapter 3 motivates the tools proposed in chapters 4 and 5.
As for the second thread (i.e., Biological Network analysis), a reader interested in this specific problem may only focus on parts III or IV; also in this case the intro-ductory chapter and the second chapter become a must.
Part III has been logically divided in two sub-parts. Chapter 6 gives some background necessary to understand the problem of network alignment and draws an overview of the state of the art related to global and local alignment tools. This introductory chapter is a premise to the subsequent chapter (Chapter 7). In fact, Chapter 6 moti-vates the tool proposed in Chapter 7.
Part IV has been also logically divided in two sub-parts. In Chapter 8, a tool for querying protein interaction networks is presented and evaluated. In Chapter 9, this tool is compared with the state of the art. Moreover, Chapter 9 also provides a com-parative overview of biological network querying systems, by exploiting an illustra-tive example.
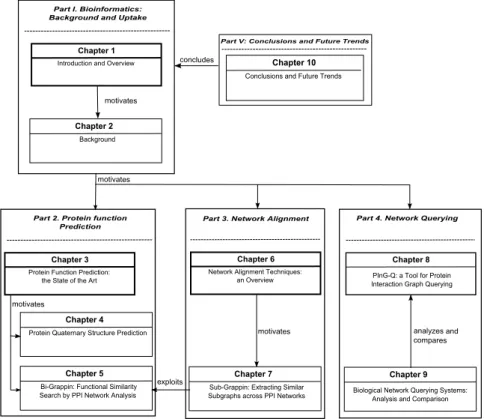
Figure 1.4 summarizes chapters organization and provides links between the work presented in the different parts and chapters in order to allow the reader to
choose the parts on which s/he is interested. In particular, two kinds of dependen-cies between parts and three between chapters are depicted. The relation concludes between Part I and Part V indicates that Chapter 10 analyzes the claims presented in Part I on the basis of the research discussed in the various parts. The relations
motivates from a Part (or Chapter) to another Part (or Chapter) indicates that the
content of the former provides the information necessary to motivate the contribu-tions introduced in the latter. For example, the relacontribu-tions motivates from Part I to parts II, III and IV indicates that the content of Part I provides the information necessary to understand why the tools presented in Parts II, III and IV have been developed. The relation exploits indicates that the contribution introduced in Chapter 7 uses as a sub-procedure the method presented in Chapter 5. To correctly understand how the system discussed in Chapter 7 works, the reader is suggested to also read Chapter 5. The relation analyzes and compares indicates that the tool described in Chapter 8 is compared w.r.t. the state of the art in Chapter 9.
1.3.3 Publications
Part of the material of the thesis has been published in some journals, conferences and books :
Journals
• V. Fionda, L. Palopoli, S. Panni, S. Rombo. “A technique to search for functional
similarities in protein-protein interaction networks”. International. Journal on
Data Mining and Bioinformatics. Vol. 3(4), pp. 431-453, 2009. Book Chapters
• V. Fionda, L. Palopoli. “Network Querying Techniques for PPI network
Compar-ison”. Chapter XVII. In: Biological data mining in protein interaction networks
(Xiao-Li Li, See-Liong Ng, Eds.), IGI Publishing. ISBN:978-1605663982. pp.
312-334, 2009.
Conferences
• Valeria Fionda, Simona Panni, Luigi Palopoli and Simona E. Rombo. “sc
Bi-GRAPPIN: Bipartite GRAph based Protein-Protein Interaction Networks sim-ilarity search”. In Proceedings of IEEE International Conference on
Bioinfor-matics and Biomedicine (BIBM’07). Silicon Valley, USA, 2-4 November, pp.
355-361, 2007.
• Fabrizio Angiulli, Valeria Fionda and Simona E. Rombo. “Protein Data
Conden-sation for Effective Quaternary Structure Classification”. In Proceedings of
Inter-national Conference on Intelligent Data Engineering and Automated Learning (IDEAL’07). Birmingham, UK, 16-19 December, pp. 810-820, 2007.
• Valeria Fionda, Simona Panni, Luigi Palopoli and Simona E. Rombo. “Singling
out functional similarities in graph databases”. In Proceedings of the Sixteenth
Italian Symposium on Advanced Database Systems (SEBD 08). Mondello (PA),
22-25 June, pp. 271-278, 2008
• Valeria Fionda, Simona Panni, Luigi Palopoli and Simona E. Rombo.
“Protein-protein interaction network querying by a ’focus and zoom’ approach”. In
Pro-ceedings of the 2nd International Conference on Bioinformatics Research and Development (Bird’08). Vienna, 7-9 July, pp. 331-346, 2008.
• Valeria Fionda, Gialuigi Greco. “Charting the Tractability Frontier of Mixed
Multi-Unit Combinatorial Auctions”. In Proceedings of the 21st International
Joint Conference on Artificial Intelligence (IJCAI’09). Pasadena, CA, USA,
11-17 July. pp. 134-139, 2009.
• Valeria Fionda, Simona Panni, Luigi Palopoli and Simona E. Rombo.
“Extract-ing similar sub-graphs across PPI Networks”. In Proceed“Extract-ings of the 2nd
Inter-national Conference on Bioinformatics Research and Development (ISCIS’09).
Background
Summary. In this chapter, some background necessary to understand the topic and the
mo-tivation of this thesis is provided. In particular, across this chapter, some information will be given regarding both simple biological structures (i.e., proteins) (Section 2.1) and complex biological strictures (i.e., biological networks) (Section 2.2). Moreover, an overview of the motivation behind the study of both these types of structure (i.e., protein function prediction and biological network analysis) is provided in Section 2.3 and Section 2.4.
2.1 Background on Proteins
Genes are segments of DNA that code for proteins inside the cell. Transcription is the process by which the enzyme (that is a protein working as a biochemical catalysator) RNA polymerase, reads the sequence of bases on a gene and constructs an mRNA molecule from that sequence. Translation is the process by which a ribosome, a macromolecular assembly, reads the information contained in the mRNA molecule and synthesizes a protein molecule from the sequence on the mRNA molecule. Thus, each protein molecule is a product of the gene that codes for it. In turn, proteins are responsible for carrying out various functions inside the cell. For instance, many pro-teins work as enzymes that catalyze the reactions that occur in living organisms or they can interact with other molecules for performing storage and transport functions. Moreover, these fundamental components provide mechanical support and shape to tissues and mechanical work as, for example, muscular contraction. Finally, several proteins have an essential role in the decoding of cellular information and also regu-late the transcription of a gene to an mRNA molecule.
Proteins are macromolecules composed by linear polymers, or chains, of amino acids. All organisms use the same set of 20 amino acids as building blocks in the protein synthesis. The variations of the order in which amino acids are connected and their total number let to obtain an almost unlimited number of proteins.
The primary structure of a protein is the sequence of its amino acids, forming the polypeptidic chain. The 20 amino acids are known as α-amino acids since they are composed by an amide group and a carboxylic group, bind to the C-2, also known
as α carbon. The α carbon also binds hydrogen atoms and a side chain, called −R. The side chain is distinctive to each amino acid. The amino acids are bound to one another by the condensation of a α-carboxylic group of one amino acid to the amide group of another amino acid to form a chain. This bond is known as peptidic bond and the involved amino acids are called residues. The free amide and carboxylic groups at the opposite extremities of the peptidic chain are called N-terminal (amide terminal) and C-terminal (carboxylic terminal). Conventionally, all the residues of a peptidic chain are numbered starting from N-terminals.
On the basis of protein complexity, a protein can have at most four levels of struc-tural organization (see Figure 2.1). The primary structure is the amino acid sequence and describes the one-dimensional structure of a protein. The other three levels en-code the protein three-dimensional structure. In more detail, the polypeptidic chain patterns that regularly repeat into the protein denote the secondary structure. The ter-tiary structure is related to the three-dimensional structure of the whole polypeptide. The Quaternary Structure is related to the arrangement of two or more polypeptidic chains in one polymer.
Alterations of the conditions of the environment, or some chemical treatments, may lead to a destruction of the native conformation of proteins with the subsequent loos-ing of their biological activities. This process is called denaturation.
Fig. 2.1. Different levels of protein structures.
The central dogma of molecular biology was first enunciated by Francis Crick in 1958 [43] and re-stated in a paper appeared in the Nature journal published in 1970 [44]: “The central dogma of molecular biology deals with the detailed residue-by-residue transfer of sequential information. It states that information cannot be transferred back from protein to either protein or nucleic acid”. In other words, the central dogma of molecular biology is that genes may perpetuate themselves and work through their expression in form of proteins, but it is not possible to go the other way around and obtain the gene sequence from the protein. Note that the ex-pression of a gene is its product, that is, the protein for which the gene encodes information.
perpetuate through the replication. More precisely, the genetic information is repre-sented both by DNA and RNA. In fact, while cells use only DNA, some viruses, the
retroviruses, have their genome encoded into the RNA, which is replicated into the
infected cells.
The DNA uses four nucleotides: adenine (A), guanine (G), cytosine (C) e thymine (T). Since it is not possible to represent each of the 20 different amino acid by a nucleotide, each amino acid corresponds to a group of nucleotides. By choosing words composed by two nucleotides only 42= 16 combinations can be obtained.
In-stead, by choosing words composed by three nucleotides 43 = 64 combinations can
be obtained, that are sufficient to encode the 20 amino acids. Thus, a code of three or more nucleotides is necessary and the one made of three nucleotides seems to be valid for all organisms. Each triplet is called codon. All the 64 codons specify amino acids except three of them, that are stop triplets, and are stop signals in the transduc-tion process. Since 61 codons are used to encode 20 amino acids, multiple triplets may encode for the same amino acid, and in general these have the same first two nucleotides and different third nucleotides. The starting triplet is the one encoding the methionine amino acid: all proteins start with this amino acid. The transduction process ends and the protein is released when one of the three stop triplets is recog-nized.
2.1.1 Protein Primary Structure
The primary structure of a protein is the linear sequence of its amino acids. The amino acid sequence of a protein is determined by the gene that encodes for it. The differences between two primary structures reflect the evolutive mutations. The amino acid sequences of related species are with high probability similar and the number of differences in their amino acid sequences are a measure of how far in the time the divergence between the two species is located: the more distant the species are the more different the protein amino acid sequences are.
The amino acid residues essential for a given protein to maintain its function are conserved during the evolution. On the contrary, the residues that are less impor-tant for a particular protein function can be substituted by other amino acids. It is important to note that some proteins have a higher number of substitutable amino acids than others, thus proteins can evolve at different speeds. Generally, the study of molecular evolution is focused on family of proteins. Proteins belonging to the same family are called homologous and the tracing of the evolution process starts from the identification of such families. Homologous are identified by using spe-cialized amino acids sequence alignment algorithms that, by analyzing two or more sequences, search for their correspondences.
2.1.2 Protein Secondary Structure
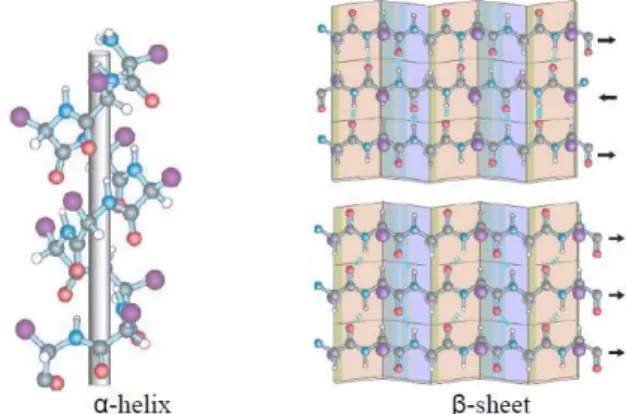
The secondary structure is referred to the general three-dimensional form of lo-cal segments of proteins. It does not describe specific atomic positions in three-dimensional space, but is defined by patterns of hydrogen bonds between backbone
amide and carboxylic groups. The secondary structure is related to the spacial ar-rangement of amino acid residues that are neighbors in the primary structure. The secondary structure is the repetition of four substructures that are: α helix, β sheet,
βturn, Ω loop. The most common secondary structures are alpha helices and beta sheets (see Figure 2.2).
A common method for determining protein secondary structure is far-ultraviolet (far-UV, 170-250 nm) circular dichroism. A less common method is infrared spec-troscopy, which detects differences in the bond oscillations of amide groups due to hydrogen-bonding. Finally, secondary-structure contents may be accurately esti-mated using the chemical shifts of an unassigned NMR spectrum.
Fig. 2.2. Two examples of protein secondary structure: α helix and β sheet.
2.1.3 Protein Tertiary Structure
The tertiary structure of a protein is its three-dimensional structure, as defined by the atomic coordinates. The function of a protein is determined by its three-dimensional structure and the three-dimensional structure depends on the primary structure. Ef-forts to predict tertiary structure from the primary structure are generally known as protein structure prediction. However, the environment in which a protein is syn-thesized and allowed to fold are significant determinants of its final shape and are usually not directly taken into account by current prediction methods.
The biological activity of a protein is related to the conformation the protein assumes after the folding of the polypeptidic chain. The conformation of a molecule is a spacial arrangement that depends on the possibility for the bonds to spin. In physiologic conditions a protein has only one stable conformation, known as native conformation.
On the contrary of secondary structure, the tertiary structure also takes into ac-count amino acids that are far in the polypeptidic sequence and belong to different secondary structures but interact with one another.
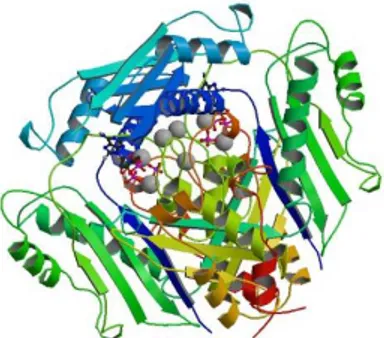
To date, the majority of known protein structures have been determined by the ex-perimental technique of X-ray crystallography. A second common way of determin-ing protein structures uses NMR, which provides somewhat lower-resolution data in general and is limited to relatively small proteins.
An example of tertiary structure as reported by the PDB database1 is shown in
Figure 2.3. This figure represents the tertiary structure of the S-Adenosylmethionine
Synthetase with 8-BR-ADP.
Fig. 2.3. An example of protein tertiary structure.
2.1.4 Protein Quaternary Structure
Many proteins are assemblies of more than one polypeptide chain, known as protein subunits. In addition to the tertiary structure of the subunits, multiple-subunit proteins possess a quaternary structure, which is the three-dimensional spacial arrangement of the several polypeptidic chains, corresponding to protein subunits.
According to this structure, the protein can be subdivided in two groups: homo-oligomers and hetero-homo-oligomers. The first group is made of proteins composed by only one type of subunit, while the second one is made of proteins that are composed by different types of subunits. The proteins belonging to the first group are those having structural and supporting roles, while the proteins belonging to the second one have dynamic functions.
Protein quaternary structures can be determined using a variety of experimental techniques that require a sample of proteins in a variety of experimental conditions. The experiments often provide an estimate of the mass of the native protein and, to-gether with knowledge of the masses and/or stoichiometry of the subunits, allow the quaternary structure to be predicted with a fixed accuracy. However, it is not always possible to obtain a precise determination of the subunit composition. The number of subunits in a protein complex can often be determined by measuring the hydro-dynamic molecular volume or mass of the intact complex, which requires native solution conditions.
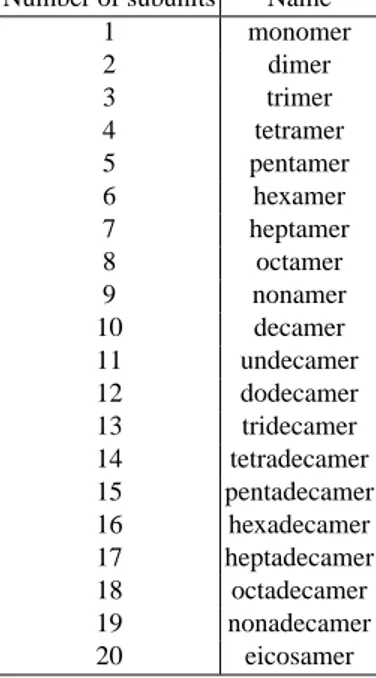
Table 2.1 reports the nomenclature used to identify protein quaternary structures. The number of subunits in an oligomeric complex are described using names that end in -mer (Greek for “part, subunit”).
Number of subunits Name
1 monomer 2 dimer 3 trimer 4 tetramer 5 pentamer 6 hexamer 7 heptamer 8 octamer 9 nonamer 10 decamer 11 undecamer 12 dodecamer 13 tridecamer 14 tetradecamer 15 pentadecamer 16 hexadecamer 17 heptadecamer 18 octadecamer 19 nonadecamer 20 eicosamer
Table 2.1. The nomenclature used to identify protein quaternary structures
Figure 2.4 shows an example of the quaternary structure of a protein. The qua-ternary structure reported in the figure is a tetramer and is related to a potassium ion channel protein from Streptomyces lividans.
The quaternary structure is important, since it characterizes the biological func-tion of proteins when involved in specific biological processes. Unfortunately, qua-ternary structures are not immediately deducible from protein amino acid sequences.
2.2 Biological Networks
Biological networks, which store information about molecular relations and interac-tions, can be conveniently represented as graphs. A graph is built from a set of nodes or vertices, representing cellular building blocks (e.g, proteins or genes), and a set of edges (directed or undirected), representing interactions (see Figure 2.5). A graph is a pair G = (V, E), where V is the set of nodes and E is the set of edges, so that the elements from E are pairs of elements of V. In an undirected graph, an edge linking nodes A and B represents a mutual interaction. Conversely, in a directed graph, each edge represents the flow of material or information from a source node to a target node.
(a) An example of undirected graph (b) An example of directed graph
Fig. 2.5. Examples of graph structure.
Different types of graphs are used to represent different types of biological net-works, each of which stores information about interactions related to specific entities or molecules [1]. Relevant kinds of networks include: transcriptional regulatory
net-works, signal transduction netnet-works, metabolic netnet-works, protein-protein interaction networks (or PPI network), domain interaction networks, Gene Co-Expression Net-works and genetic interaction netNet-works.
2.2.1 Transcriptional Regulatory Networks
As already pointed out in Section 2.1, the transcription of a gene to an mRNA molecule is regulated by proteins referred to as transcription factors. A transcrip-tion factor may activate or inhibit the expression of a gene inside the cell by binding to regions upstream or downstream of the gene on the DNA molecule. This process may, in turn, facilitate or prevent RNA polymerase from binding and initiating the transcription of the gene. Thus, the genes inside cells interact with each other via intermediate transcription factors to influence each others expression.
The set of genes interactions inside the cell is referred to as the transcriptional
regulatory network. This kind of network can be modeled as a graph having two
types of nodes, representing the transcriptional factors and the mRNAs of the target genes, respectively. Moreover, it has two types of directed edges, representing tran-scriptional regulation and translation, respectively. A simpler graph model combines genes with transcriptional factors they encode, to obtain a graph all the nodes of which represent genes. In this latter representation, an edge connects a source gene to a target gene if the former produces RNA or a protein acting as a transcriptional activator or inhibitor of the latter. An activator gene is the source of a positive reg-ulatory connection, while an inhibitor gene is the source of a negative regreg-ulatory connection.
2.2.2 Signal Transduction Networks
Cells use signaling pathways and regulatory mechanisms to coordinate multiple functions. For instance, inside the cell, the proteins interact with each other to influ-ence each other’s activity. Moreover, extracellular signals are mediated to the inside of a cell by protein-protein interactions of signaling molecules. The signal
transduc-tion networks store informatransduc-tion about the processes through which a cell converts
one kind of signal or stimulus into another by protein-protein interactions. In partic-ular, the signal transduction corresponds to the propagation of molecular or physical signals (for example, sensory stimuli) from a cell’s exterior to its intracellular re-sponse mechanisms.
In the graphs modeling signal transduction networks, vertices represent proteins and directed edges represent the protein-protein interactions that work as signal con-verters.
2.2.3 Metabolic Networks
Metabolic networks represent the set of biochemical reactions that are responsible
for the uptake of nutrients from the external environment and their conversion into other molecules required for the growth and maintenance of the cell. Each reaction takes in input some metabolites and produces as output other metabolites. Moreover, metabolic reactions are catalyzed by enzymes.
Metabolic networks can be represented as weighted tripartite graphs with three types of nodes (i.e., metabolites, reactions and enzymes) and two types of edges representing mass flow and catalytic regulation, respectively. The first type of edge connects reactants to reactions and reactions to products. The second type connects enzymes to the reactions they catalyze.
Simpler graph models have also been proposed. In particular, metabolic networks can be represented as bipartite graphs consisting of two types of nodes, which are metabolites and reactions. Each reaction node has an incoming edge from each re-actant metabolite and one outgoing edge to each product metabolite. In the bipartite metabolic graph, there are no direct links between either two metabolites or two reac-tions. Another bipartite graph representation considers as the two partitions of nodes
the chemical compounds and the enzymes, respectively. For each enzyme node, an incoming edge occurs with each of its substrate nodes and an outgoing edge occurs with each of its product nodes.
The metabolic networks sometimes are also represented as unipartite graphs (which could be directed or undirected) in which there is only one type of node. For instance, a simple model is a directed graph in which nodes represent enzymes and directed edges connect pairs of enzymes for which the product of the source enzyme is a substrate of the sink enzyme. In another simple model, nodes represent metabolites and directed edges represent enzymes that catalyze a reaction having the source metabolite as the reactant and the sink metabolite as the product.
2.2.4 Protein-Protein Interaction Networks
A protein-protein interaction network stores the information about the interactome of a given organisms, that is the whole set of its protein-protein interactions. In graphs modeling protein-protein interaction (PPI) networks , the nodes represent proteins and the edges are undirected and possibly weighted, with two proteins connected if they bind. Edge weight may be used to incorporate reliability information concerning the interaction.
Since protein-protein interactions are very important in regulating cell life cycle, there are a multitude of methods to detect them. Each of these method has its own strengths and weaknesses, especially with regard to the sensitivity and specificity. A high sensitivity means that many real interactions are detected. A high specificity indicates that most of the interactions detected are also occurring in reality. Thus, the reliability weights are important to take into account reliability, in terms of sensitivity and specificity, of the method used to detect interactions.
It is important to note that, since protein interactions are often obtained from pro-tein complex detection and not really as binary interactions, a more complex model may be more informative. In fact, the use of hyper-graphs, instead of simple graphs, might be usefully adopted to model protein complexes.
2.2.5 Domain Interaction Networks
Domains are independently folded modules of a protein. A domain-domain
interac-tion (DDI) network is constructed when each protein in a PPI network is replaced
by one or more nodes representing its constituent domains. In this type of network, edges connecting two proteins are transformed to connect the corresponding domain nodes. Since most of the known proteins are composed by more than one domain, a domain-domain interaction network usually gets much larger than the original protein-protein interaction network. However, different proteins (often functionally unrelated) frequently share identical domains and, therefore, one domain node in a DDI network usually appears multiple times in the context of different proteins.
A similar type of network is the domain co-occurrence network, in which each domain is represented by a single node. In this type of network two nodes are con-nected by an edge when the corresponding domains occur in the same protein at least once.
2.2.6 Gene Co-Expression Networks
The gene co-expression networks store information about transcription that takes place at the same time or under the same conditions. In these networks, each gene corresponds to a node and edges connect genes that are co-expressed. These net-works are constructed by large-scale DNA microarray experiments, and the un-ordered composition of a pair of co-expressed genes leads to the undirected nature of the networks. Starting from microarray gene expression data, the concordance of gene expression is measured with a Pearson correlation producing a Pearson cor-relation matrix. According to a first type of model, this matrix is dichotomized to arrive at an adjacency matrix. Binary values in the adjacency matrix correspond to an unweighted graph. Using this representation some genes are connected and all connections are equivalent.
A more complex model takes into account edge weights to store information about the absolute value of the Pearson correlation. In this type of representation all genes are connected and edge weights denote connection strengths between gene pairs.
2.2.7 Genetic Interaction Networks
Inactivation of most genes, in any organism, has little discernible effects on cell func-tioning under laboratory conditions. However, inactivating specific rare combina-tions of such non-essential genes can have profound effects on the organism under exactly the same conditions. In general, two genes are said to genetically interact if a mutation in one gene either suppresses or enhances the phenotype of a mutation in its partner gene. In the graphs modeling genetic interaction networks, nodes are genes and edges represent genetic interactions.
2.2.8 The Cell: a Network of Networks
It is important to underline that all the kinds of biological networks discussed above (e.g., metabolic, transcriptional regulatory or protein-protein interaction networks) are not independent of each other inside the cell. For instance, the state of the genes in the transcriptional regulatory network determines the activity of the metabolic net-work. On the other hand, the concentration of metabolites in the metabolic network determines the activity of transcription factors or proteins which regulate the expres-sion of genes in the regulatory network. Thus, the biological networks together form a network of networks inside the cell that determines the overall behaviour of the corresponding organism.
2.2.9 Biological Network Modeling
On the more formal side, considering only unipartite graphs, a biological network N is commonly represented by a (possibly directed) graph GN =hVN,ENi (see Figure
2.6). In this graph, the set of nodes (or vertices) VN denotes a set of cell building blocks (e.g., proteins, enzymes, metabolites, genes) and the set of edges ENencodes
the interactions between pairs of nodes.
In the most general definition, each edge ei j ∈ EN takes the form of a triplet
eN
i j = hvi,vj,li, ji where vi,vj ∈ VN are the interacting cell components and li, j is
the label associated to that edge (in PINs, for example, the edge label may encode the reliability of that interaction to actually occur).
Fig. 2.6. An example of biological network graph GN.
2.3 Protein Function Prediction
Proteins are essential parts of organisms and participate in virtually every process within cells. Many proteins work as biochemical catalysators, known also as en-zymes, that catalyze the reactions occurring in living organisms. Proteins can also interact with other molecules to perform storage and transport functions. Moreover, these fundamental components provide mechanical support and shape to tissues and mechanical work as, for example, the muscular contraction. Finally, several proteins have an essential role in decoding cellular information. Therefore, understanding the functions performed by proteins within the cell is a key issue in bioinformatics.
Recently, a large amount of protein sequences has been made available as a result of whole genome sequencing project of many organisms. However, it is almost im-possible to reveal their potential functions by experimental methods only. Moreover, there is a fast increasing in the number of proteins whose structures are known but whose functions are not. Seeing that experimental methods alone are not sufficient, a great attention is given to the computational approaches in which plenty of protein functions can be predicted simultaneously with reasonable accuracy. Therefore, com-putational protein function prediction methods prove themselves a powerful tools for biological research.
Protein function prediction methods can be basically classified according to in-formation sources:
• Sequence-based approaches, that are the most basic methods. They exploit
se-quence alignment, sese-quence motif and domain information;
• Structure-based approaches, that make use of structural information. They
com-pare whole three-dimensional shapes;
• Protein-protein interaction-based approaches. There are several different
meth-ods such as global mapping of unknown proteins or evidence integration in PPI networks.
The fundamental idea of sequence-based protein function prediction is the de-tection of similar protein sequences by database searching, assuming that similar sequences might have similar functions. For this purpose, several alignment algo-rithms, such as BLAST [202], can be used. But it is important to note that: (a) on the one hand, similar sequences not always have similar function and (b) on the other hand, dissimilar sequences have similar function at times. Thus, sequence space do not correspond with function space.
Structure-based protein function prediction uses structure information and is sim-ilar to sequence-based prediction. The basic assumption is that proteins with simsim-ilar structure might have similar function. Protein function is strongly related with its structure since a protein works by interacting with other proteins or chemicals and its structure limits the possibility of its interaction modes. Moreover, structure simi-larity could fill the gap that is overlooked with sequence-based methods. In fact, low sequence similar proteins may have a significant structural similarity.
Protein-protein interaction (PPI) information have determined protein physical interaction maps for several organisms. These physical interactions are comple-mented by the other types of information discussed in Section 2.2 and shared evo-lutionary history. The protein-protein interaction data can be used to predict protein function by the observation that if protein p and protein p′interact, they are func-tionally close to each another. Moreover, similar proteins have similar interacting patterns. Thus, if p and p′interact with p1 and p′1, and p1 and p′1 are similar, it is
possible to infer that also p and p′are functional related.
2.4 Biological Network Analysis
Cell behavior and function cannot be deeply understood through a mere analysis of its individual building blocks (e.g., proteins, genes). In fact, biological processes reg-ulating cell life cycle stem from complex interactions among cell constituents. In the last few years, several techniques have been developed to discover such interactions and the amount of data made available in several databases (e.g., DIP [175], MINT [33], KEGG [94]) has grown steadily. These datasets promise new and exciting in-sights into the molecular machinery underlying biological systems. However, their analysis is fraught with a range of mathematical and statistical problems. This is par-ticularly true for protein-protein interaction datasets, which suffer from being incom-plete and subject to high error rates (both false positive and false negative). However, to properly look up the large amount of available data and mine useful information,
the design and development of automatic tools has become crucial. These tools lever-age Biological Networks as a formal model to encode molecular interactions among cell building blocks. As already pointed out in Section 2.2, at their most basic ab-straction level, biological networks can be represented as graphs, where groups of connected biomolecules (corresponding to nodes of the graph) “collaborate” to form relatively isolated biological functional unit (corresponding to subgraphs). Biologi-cal graphs can be fed as input to suitable graph-based techniques able to perform topological and functional comparisons. Such techniques exploit specialized algo-rithms to infer new information about cellular activity and evolutive processes of the species, which allows to gain better understanding about the mechanisms underlying life processes [237].
A wide range of statistical and computational methods for the structural, func-tional and comparative analysis of biological networks have been developed. In par-ticular, there are several ways to compare biological networks, but network
align-ment, network integration and network querying, have surely to be regarded as the
most significant ones [181]. Figure 2.7 summarizes the goal of each of these tasks.
Network alignment is the process of globally comparing two or more networks of
the same type belonging to different species in order to identify similarity and dis-similarity regions. Network alignment is commonly applied to detect conserved sub-networks, which are likely to represent common functional modules. As can be seen in Figure 2.7, the input of a network alignment algorithm are two (or, possibly more) biological networks of different organisms and the output are pairs (or, possible sets) of subgraphs (or, possibly simpler structures, such as paths), one for each input net-work, that have been recognized to be similar. For instance, the identification of conserved linear paths may lead to the discovery of signaling pathways, as well as conserved clusters of interactions (subgraphs) may correspond to protein complexes.
Network integration is the process of combining several networks of the same
species, representing different kinds of interactions (e.g., protein, metabolic), to study their interrelations. Since each type of network lends insight into a different slice of biological information, integrating different network types may paint a more comprehensive picture of the overall biological system under study. Commonly, net-works to be integrated are defined over the same set of elements (e.g., the set of proteins of a certain species), and the integration is achieved by merging them into a single network with multiple types of interactions, each drawn from one of the orig-inal networks. As shown in Figure 2.7, the input of a network integration algorithm are two (or, possibly more) biological networks defined over the same set of elements (corresponding to graph nodes) that store different types of information (painted in green for the first input network and in red for the second one). The output is a new network, defined over the same set of elements, that integrates all types of input in-teractions. In particular, in the figure, the interactions belonging to only one of the input networks are reported with the same color used in the corresponding network (green or red), while the interactions stored in both networks are painted in black. A fundamental problem is to identify, in the merged network, functional modules that are supported by interactions of multiple types (for instance, the cluster of nodes
Fig. 2.7. Comparing biological networks: the three main ways.
Finally, network querying techniques search a whole biological network to iden-tify conserved occurrences of a given query module, which can be used for transfer-ring biological knowledge from one species to another (or possibly within the same species). Indeed, since the query generally encodes a well-characterized functional module (e.g., the MAPK cascade in yeast), its occurrences in the queried network (e.g., the MAPK cascade in human) suggest that the latter (and then the correspond-ing organism) features the function encoded by the former. As shown in Figure 2.7, the input of a network querying algorithm are a whole biological network (painted in blue) and a query module (colored in violet) of the same type (for instance, both reporting protein-protein interaction information). The output are all the (possibly approximated) occurrences of the query module into the target network.
2.5 Concluding Remarks
In this chapter some biological and bioinformatics background knowledge, useful to understand the subsequent chapters, has been given. The subsequent parts of this thesis will illustrate the state of the art, and several innovative contribution in protein
function prediction (Part II), network alignment (Part III) and network querying (Part
Protein Function Prediction: the State of the Art
Summary. In this chapter, the state of the art about protein function prediction will be
out-lined. Firstly, in Section 3.1, the notion of “protein function” is discussed. Then, in Section 3.2 an overview of the different methods proposed in the literature to predict protein function is provided. Moreover, in the subsequent sections, two strands of research will be deepened: quaternary structure prediction (Section 3.3) and protein function prediction by PPI networks analysis (Section 3.4).
3.1 Protein Function
The concept of protein function is not very well-defined. In fact, this concept typi-cally includes all the types of activities that a protein is involved in, from molecular to physiological ones. Some categorizations of the types of functions a protein can perform have been proposed in the literature [23, 7]. The first categorization [23] distinguishes among:
• Molecular function: the biochemical function performed by a protein, such as
ligand binding, catalysis of biochemical reactions and conformational changes;
• Cellular function: the function performed when many proteins come together to
perform complex physiological functions, such as operation of metabolic path-ways and signal transduction, to keep the various components of the organism working well;
• Phenotypic function: the integration of the physiological subsystems, consisting
of various proteins performing their cellular functions, and the interaction of this integrated system with environmental stimuli.
Clearly, these three categories are not independent. In fact, the molecular function category is a sub-category of the cellular function category, which is, in its turn, a sub-category of phenotypic function.
A widely used categorization is the Gene Ontology classification scheme [7], which categorizes protein functions into:
• Cellular component: referred to the parts of a cell or its extracellular environment
where the protein is localized;
• Molecular function: the elemental activities of a protein at the molecular level,
such as binding or catalysis;
• Biological process: operations or sets of molecular events with a defined
begin-ning and end, pertinent to the functiobegin-ning of integrated living units: cells, tissues, organs, and organisms.
Often, the protein function prediction is referred to one or more of these cate-gories. In the sense that functional annotation of such categories are transferred from characterized to uncharacterized proteins.
3.2 Protein Function Prediction
There are plenty of proteins which have a totally unknown function. For some of these proteins only the amino acid sequences are known, while for others also pro-tein structures have been provided by the structural genomics centers. Since propro-teins participate in virtually every process within cells, understanding the functions they perform therein is a key bioinformatics task. For this reason, several tools have been developed to infer protein function.
Among the existing software tools, some main strategies can be distinguished:
• homology search and transfer of annotations:
– sequence alignment – structure alignment
• function inference by genomic context
– genomic sequences – gene expression data
• phylogenomic approaches • protein interaction networks
In the following paragraphs such strategies will be discussed in more detail.
3.2.1 Homology Search and Transfer of Annotations
The most basic strand of approaches proposed for predicting protein function is based on homology search. These methods try to infer the unknown function of a protein by finding a protein, with a known function, having either a similar sequence or a similar structure.
Sequence homology is the classical methodology used to infer the function of a novel protein. Indeed, sequence homology has been proved to be effective and reliable for inferring protein function, although its applicability is limited to protein for which substantial sequence similarity to annotated proteins can be found. In fact, in a study involving over a million sequence alignments [173], it was shown that alignments with at least 30% sequence identity correspond in the 90% of the cases