Introduction
Human leukocyte antigen (HLA)-G is a non-classical HLA class I molecule originally identified and characterized in tro-phoblasts where it confers protection to the semi-allogeneic fetus from the maternal immune system.1,2More recently, it
has become evident that HLA-G plays a role in promoting and maintaining tolerance in autoimmunity and organ trans-plantation, and immune escape in cancer and infectious dis-eases. HLA-G is characterized by a relatively low allelic poly-morphism and a highly restricted tissue distribution in com-parison with classical HLA class I molecules. In healthy con-ditions, in addition to trophoblasts, HLA-G expression is restricted to amniotic cells, adult thymic medulla, erythro -blasts, cornea, pancreatic islets, and endothelial and stem cells.3 By alternative splicing of a single mRNA transcript,
seven different HLA-G isoforms, four membrane-bound (HLAG1, G2, G3, and G4) and three soluble (HLAG5, -G6, and -G7) can be generated.4,5 Matrix metalloproteinases
are responsible for the proteolytic cleavage of HLA-G1 from the membrane, and the release of shed HLA-G1.6 Thus far,
the best-characterized isoforms are HLA-G1, the most stable membrane-bound isoform, HLA-G5, and shed HLA-G1.
Several polymorphisms in both the promoter and the 3’ untranslated region (UTR) of the HLA-G gene can influence
its expression.7The best-characterized polymorphism in the
3’UTR is the insertion/deletion (Ins/Del) of 14 base pairs (bp), which has been respectively associated with decreased/increased mRNA stability.8-10The +3142 G/C single
nucleotide polymorphism has also been suggested to control HLA-G expression, since the presence of G may increase the affinity of mRNA for the microRNA (miR)-148a, miR-148b and, miR-152.11,12 Additional less studied single nucleotide
polymorphisms are present in the 3’UTR at positions +3001 T/C, +3003 T/C, +3010 G/C, +3027 C/A, +3035 C/T, and +3196 C/G,13which are potential miRNA-binding sites, and
thus may regulate HLA-G expression,14and +3187 A/G
locat-ed in the proximity of an AU-rich motif, which affects mRNA stability.15These polymorphisms cluster in at least 15
differ-ent haplotypes iddiffer-entified in Brazilian populations,13,16 and a
number of less frequent haplotypes found in other popula-tions.17,18
The functions of HLA-G are oriented towards immune inhi-bition and induction of tolerance. Through direct binding to the inhibitory receptors Immunoglobulin-Like-Transcript (ILT)2 and ILT4, and Killer cell Immunoglobulin-Like Receptor (KIR)2DL4,19HLA-G mediates short-term inhibition of natural
killer (NK) cells,20cytotoxic T-lymphocytes,21B cells,22and
den-dritic cells (DC)23,24and long-term induction of regulatory cells
including HLA-G-expressing T regulatory (Treg) cells,23CD4low
©2015 Ferrata Storti Foundation. This is an open-access paper. doi:10.3324/haematol.2014.113803 The online version of this article has a Supplementary Appendix.
Manuscript received on July 14, 2014 Manuscript accepted on January 29, 2015. Correspondence: [email protected]
Human leukocyte antigen (HLA)-G is a non-classical HLA class I molecule with known immune-modulatory func-tions. Our group identified a subset of human dendritic cells, named DC-10, that induce adaptive interleukin-10-producing T regulatory type 1 (Tr1) cells via the interleukin-10-dependent HLA-G/ILT4 pathway. In this study we aimed at defining the role of HLA-G in DC-10-mediated Tr1 cell differentiation. We analyzed phenotype, func-tions, and genetic variations in the 3’ untranslated region of the HLA-G locus of in vitro-differentiated DC-10 from 67 healthy donors. We showed that HLA-G expression on DC-10 is donor-dependent. Functional studies demon-strated that DC-10, independently of HLA-G expression, secrete 10 and negligible levels of interleukin-12. Interestingly, DC-10 with high HLA-G promote allo-specific anergic T cells that contain a significantly higher frequency of Tr1 cells, defined as interleukin-10-producing (P=0.0121) or CD49b+LAG-3+(P=0.0031) T cells,
com-pared to DC-10 with low HLA-G. We found that the HLA-G expression on DC-10 is genetically imprinted, being associated with specific variations in the 3’ untranslated region of the gene, and it may be finely tuned by microRNA-mediated post-transcriptional regulation. These data highlight the important role of HLA-G in boosting DC-10 tolerogenic activity and confirm that interleukin-10 production by DC-10 is necessary but not sufficient to promote Tr1 cells at high frequency. These new insights into the role of HLA-G in DC-10-mediated induction of Tr1 cells provide additional information for clinical use in Tr1- or DC-10-based cell therapy approaches.
HLA-G expression levels influence the tolerogenic activity
of human DC-10
Giada Amodio,1,2Michela Comi,1,3Daniela Tomasoni,1Monica Emma Gianolini,1,4Roberta Rizzo,5Joël LeMaoult,6
Maria-Grazia Roncarolo,1,2and Silvia Gregori1
1San Raffaele Telethon Institute for Gene Therapy (HSR-TIGET), Division of Regenerative Medicine, Stem Cells and Gene Therapy,
IRCCS San Raffaele Scientific Institute, Milan, Italy; 2Vita-Salute San Raffaele University, Milan, Italy; 3Ph.D Program in Translational
and Molecular Medicine (DIMET), University of Milan-Bicocca, Italy; 4Department of Public Health and Cell Biology, Tor Vergata
University, Rome, Italy; 5Department of Medical Sciences, Section of Microbiology, University of Ferrara, Italy; and 6Service de
Recherches en Hémato-Immunologie, CEA-DSV-DRM, Hôpital Saint-Louis, IUH, Paris, France
and CD8lowsuppressor T cells,25interleukin-10
(IL-10)-pro-ducing T regulatory type 1 (Tr1) cells,26and DC-10.27
DC-10 are a subset of human tolerogenic DC that are present in vivo27-29and can be differentiated in vitro by
cul-turing monocytes in the presence of IL-10. DC-10 secrete IL-10, are CD11c+, express CD14, CD16, HLA-G and ILT4
and, although not activated, display a mature phenotype, being CD86+and HLA-DR+. The secretion of IL-10 and the
expression of membrane-bound HLA-G and ILT4 are crit-ical factors involved in DC-10-mediated induction of Tr1 cells.27 In the present study, we investigated the role of
HLA-G in DC-10-mediated Tr1 cell induction and whether polymorphisms present at the 3’UTR of the gene influence the expression of membrane-bound HLA-G on DC-10.
Methods
The methods are described in full in the Online Supplementary Appendix. Peripheral blood was obtained after informed consent in accordance with the Declaration of Helsinki under protocols approved by the ethical committee of the San Raffaele Telethon Institute for Gene Therapy.
Dendritic cell differentiation
CD14+ monocytes were isolated from peripheral blood
mononuclear cells by positive selection using CD14 MicroBeads (Miltenyi Biotech, Germany) according to the manufacturer’s instructions. Cells were cultured in RPMI 1640 (Lonza, Italy) sup-plemented with 10% fetal bovine serum (FBS) (Lonza, Italy) or with 5% human serum (HS) (EuroClone, Italy), 100 U/mL peni-cillin/streptomycin (Lonza, Italy), 2 mM L-glutamine (Lonza, Italy), (DC medium) at 37°C in the presence of 10 ng/mL recom-binant human (rh)IL-4 (R&D Systems, Minneapolis MN, USA) and 100 ng/mL rhGM-CSF (Genzyme, Seattle, WA, USA) with 10 ng/mL of rhIL-10 (BD, Bioscience, CA, USA) for 7 days to differ-entiate DC-10. Cells cultured with rhIL-4 and rhGM-CSF on day 5 were matured with 1 mg/mL of lipopolysaccharide (Sigma, CA, USA) for 2 more days to generate mature dendritic cells (mDC). At day 7, DC were collected, phenotypically analyzed, and used to stimulate T cells.
Statistical analysis
Sample mean results were compared using the non-parametric Mann-Whitney U test for continuous variables. HLA-G 3’UTR allele and genotype frequencies were obtained by direct count-ing. Allele and genotype frequencies between populations were
compared using the χ2test. The correlation between
membrane-bound HLA-G and ILT4 expression was determined using the
Spearman correlation test. DC-10FBSand DC-10HSwere compared
using a paired t-test. All results are presented as mean values ± standard error of mean (SEM). Differences were regarded as sta-tistically significant at *P<0.05, **P<0.01, and ***P<0.001. The results were analyzed using GraphPad Prism 5.0 (GraphPad Software, Inc. La Jolla, CA, USA).
Results
In vitro differentiated DC-10 express variable levels
of membrane-bound HLA-G
Independently of the donor, DC-10 differentiated in vitro as described in the Methods section were
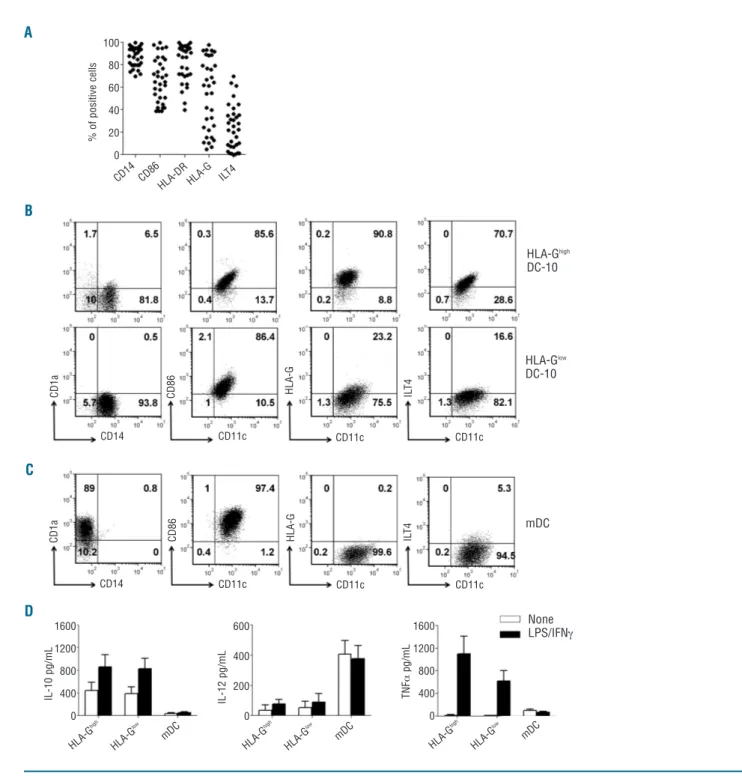
CD11c+CD14+CD1a-CD86+HLA-DR+ (Figure 1A,B). High
variability in the expression of membrane-bound HLA-G (ranging from 3.5% to 97.7%) and of ILT4 (ranging from 0.5% to 70.7%; Figure 1A,B) was observed. Notably, ILT4 expression correlated with that of HLA-G (R2=0.46,
P<0.0001). mDC differentiated from the same donors of DC-10 were CD11c+CD1a+CD14-CD86bright and did not
express HLA-G (<3%) (Figure 1C). Based on the expres-sion of HLA-G, DC-10 were classified as HLA-Ghighand
HLA-Glowwhen the percentage of HLA-G-expressing cells
was higher or lower than 38%, respectively. This thresh-old value was determined as <95% of the confidence interval of the mean of HLA-G-expressing cells among all DC-10 tested.
HLA-Ghighand HLA-GlowDC-10 spontaneously secreted
IL-10 at comparable levels, and negligible levels of IL-12 and tumor necrosis factor-a (Figure 1D). Upon stimulation with lipopolysaccharide and interferon-g, the release of IL-10, but not of IL-12, by DC-10 increased, and no differ-ences were observed between HLA-Ghigh and HLA-Glow
DC-10. Activated HLA-Ghighand HLA-GlowDC-10 secreted
comparable amounts of tumor necrosis factor-a (Figure 1D). As expected, mDC differentiated in vitro from the same donors from whom DC-10 were generated, secreted high levels of IL-12, and limited amounts of tumor necro-sis factor-a, and of IL-10 at steady state and upon activa-tion (Figure 1D).
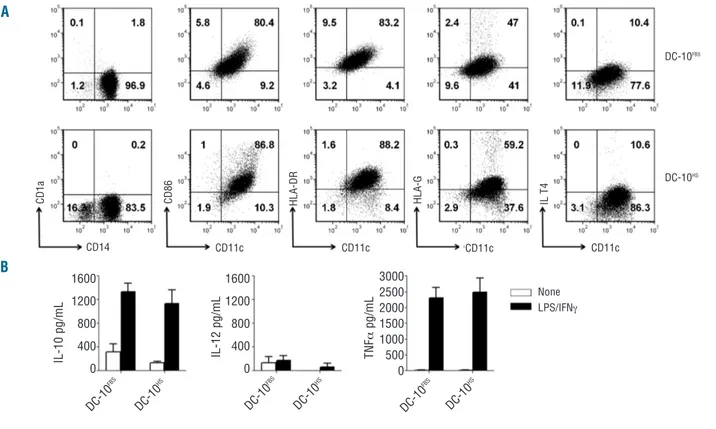
To investigate whether the expression of HLA-G by DC-10 was influenced by the culture conditions used for their differentiation (i.e. the presence of FBS), we com-pared the phenotype and cytokine production profile of DC-10 generated in media supplemented with FBS (DC-10FBS) or HS (DC-10HS). DC-10, independently of the media
used, were CD14+CD1a-CD86+HLA-DR+ and expressed
HLA-G and ILT4 at variable levels (Figure 2A). DC-10FBS
and DC-10HS produced high levels of IL-10 and low
amounts of IL-12 spontaneously and tumor necrosis fac-tor-a upon stimulation (Figure 2B). The culture conditions used for DC-10 generation do not affect the phenotype of differentiated DC.
Overall, DC-10 generated from different donors are mature CD14+ cells, with a high IL-10/IL-12 ratio, and
express variable levels of membrane-bound HLA-G and ILT4.
DC-10 with high membrane-bound HLA-G promote
T-cell anergy
Naïve CD4+T cells stimulated with allogeneic HLA-Ghigh
and HLA-GlowDC-10, at a 10:1 ratio, proliferated at
signif-icantly lower levels compared to T cells primed with mDC generated from the same donor. A reduction in prolifera-tion of 91±7.4% (mean±SEM, n=5) and of 91.3±2.4% (mean±SEM, n=7) induced by HLA-Ghigh and HLA-Glow
DC-10, respectively, was observed (Figure 3A and Online Supplementary Figure S1A). Accordingly, the levels of inter-feron-g secreted by HLA-Ghighor HLA-Glow
DC-10-stimu-lated T cells were lower than those produced by mDC-primed T cells (Figure 3A). Similarly, a reduction in prolife-tration of 82.5±5.2% (mean±SEM, n=8) and low interfer-on-g production was observed when T cells were stimulat-ed with DC-10HS(Figure 3B), confirming that culture
con-ditions do not have an effect on the functional activity of DC-10.
To investigate the function of T cells primed with HLA-Ghighand HLA-GlowDC-10, secondary responses were
eval-uated. After one round of stimulation, T cells primed with HLA-GhighDC-10 [T(DC-10high) cells] were hypo-responsive
to re-activation with mDC differentiated from the same donor used in primary stimulation, showing a reduction in proliferation of 61.9±18% (mean±SEM, n=5) compared to T cells primed with mDC [T(mDC) cells] (Figure 3C and
Online Supplementary Figure S1B). Conversely, T cells obtained with HLA-GlowDC-10 [T(DC-10low) cells] showed
high proliferative responses when re-activated with mDC with a limited reduction in proliferation (40.3±13.8%, mean±SEM, n=7; Figure 3C and Online Supplementary Figure S1B). Interferon-g production by T(DC-10high) cells
Figure 1.In vitro-differentiated DC-10 express variable levels of membrane-bound G. Expression levels of CD14, CD1a, CD11c, CD86,
HLA-DR, HLA-G, and ILT4 on in vitro differentiated DC-10 and mDC were evaluated by FACS analysis. (A) Percentages of cells positive for the
indi-cated markers in 33 independent donors are shown. (B) One representative donor out of 30 HLA-GhighDC-10 donors (upper panels), and one
out of 24 HLA-GlowDC-10 donors (lower panels) are presented. Numbers represent percentages of positive cells in each quadrant. (C) One
rep-resentative donor out of 54 mDC donors is presented. Numbers represent percentages of positive cells in each quadrant. (D) DC-10 were left
unstimulated or stimulated with lipopolysaccharide (LPS) and interferon-g (IFNg) for 2 days. Concentrations of IL-10, IL-12, and tumor necrosis
factor-a (TNFa) in culture supernatants of the indicated cells are shown. Mean±SEM of 11 (HLA-GhighDC-10), 15 (HLA-GlowDC-10), and 26 (mDC)
independent experiments. A B C D HLA-Ghigh DC-10 HLA-Glow DC-10 mDC None LPS/IFNg CD11c CD11c CD11c CD11c CD11c CD11c CD14 HLA -G high CD 14 CD86 HLA -DR HLA -G ILT4 HLA -G low mD C HLA -G high HLA -G low mD C HLA -G high HLA -G low mD C 1600 1200 800 400 0 1600 1200 800 400 0 600 400 200 0 CD14 C D 1 a C D 8 6 C D 8 6 H L A -G H L A -G IL T 4 IL T 4 C D 1 a IL -1 0 p g /m L IL -1 2 p g /m L 100 80 60 40 20 0 % o f p o s it iv e c e ll s T N Fa p g /m L
but not by T(DC-10low) cells re-challenged with mDC was
also reduced compared to that secreted by T(mDC) cells (Figure 3C). These data show that high expression of membrane-bound HLA-G on DC-10 is required to pro-mote T-cell anergy in CD4+T cells.
DC-10 with high membrane-bound HLA-G induce
Tr1 cell differentiation
T(DC-10high) cells contained a significantly higher
fre-quency of IL-10-producing cells (on average 10%) com-pared to both T(DC-10low) cells (on average 3.4%,
Figure 2.DC-10 differentiated with FBS or HS have comparable phenotypes and cytokine profiles. (A) Expression levels of CD14, CD1a, CD11c,
CD86, HLA-DR, HLA-G, and ILT4 on DC-10 differentiated from CD14+cells isolated from the same donor with FBS (DC-10FBS) or HS (DC-10HS)
were evaluated by FACS. One representative donor out of nine tested. Numbers represent percentages of positive cells in each quadrant. (B)
DC-10 were left unstimulated or stimulated with lipopolysaccharide (LPS) and interferon-g (IFNg) for 2 days. Concentration levels of 10, IL-12, and tumor necrosis factor-a (TNFa) in culture supernatants of the indicated cells are shown. Mean±SEM of six independent experiments.
Figure 3.DC-10 with high levels of membrane-bound HLA-G promote T-cell anergy. (A) Naive CD4+T cells were cultured with allogeneic in
vitro-differentiated HLA-GhighDC-10, HLA-GlowDC-10, and mDC (ratio 10:1). Proliferative responses were evaluated 4 days after culture by [3
H]-thymi-dine incorporation for an additional 16 h (left panel). Mean±SEM of five DC-10high, seven DC-10low, and 12 mDC independent experiments.
Interferon-g (IFNg) production was evaluated 4 days after culture (right panel). Mean±SEM of four DC-10high, six DC-10low, and ten mDC
independ-ent experimindepend-ents. (B) Naïve CD4+T cells were cultured with allogeneic in vitro-differentiated DC-10FBS, and DC-10HSfrom CD14+cells isolated
from the same donor (ratio 10:1). Proliferative responses were evaluated 4 days after culture by [3H]-thymidine incorporation for an additional
16 h (left panel); IFNg production was evaluated 4 days after culture (right panel). Mean±SEM of eight independent experiments. (C) Naïve
CD4+T cells were stimulated with allogeneic HLA-GhighDC-10 [T(DC-10high)], HLA-GlowDC-10 [T(DC-10low)], or mDC [T(mDC)] for 14 days. After
cul-ture, T cells were tested for their ability to proliferate in response to mDC from the same allogeneic donor used in priming. Proliferative
responses were evaluated 2 days after culture by [3H]-thymidine incorporation for an additional 16 h (left panel). Mean±SEM of five
[T(DC-10high)], seven [T(DC-10low)], and 12 [T(mDC)] independent experiments. IFNg production was evaluated 2 days after culture (right panel).
Mean±SEM of five [T(DC-10high)], six [T(DC-10low)], and 11 [T(mDC)] independent experiments.
A A B B C 100 80 60 40 20 0 1600 1200 800 400 0 CD14 C D 1 a C D 8 6 H L A -D R H L A -G IL T 4 CD11c CD11c CD11c CD11c DC-10HS DC-10FBS 1600 1200 800 400 0 3000 2500 2000 1500 1000 500 0 None LPS/IFNg I MLR I MLR II MLR 4 3 2 1 0 c p m x 1 0 -3 IL -1 0 p g /m L DC -10 FBS DC -10 HS DC -10 FBS DC -10 HS DC -10 FBS DC -10 HS IL -1 2 p g /m L T N Fa p g /m L c p m x 1 0 -3 c p m x 1 0 -3 IF Ng n g /m L DC -10 high DC -10 low mD C DC -10 high DC -10 FBS DC -10 HS mD C DC -10 FBS T(D C-1 0hi gh) T(D C-1 0lo w) T(m DC ) T(D C-1 0hi gh) T(D C-1 0lo w) T(m DC ) DC -10 HS mD C DC -10 low mD C IF Ng n g /m L IF Ng n g /m L 160 120 80 40 0 16 12 8 4 0 200 150 100 50 0 2.5 2.0 1.5 1.0 0.5 0.0
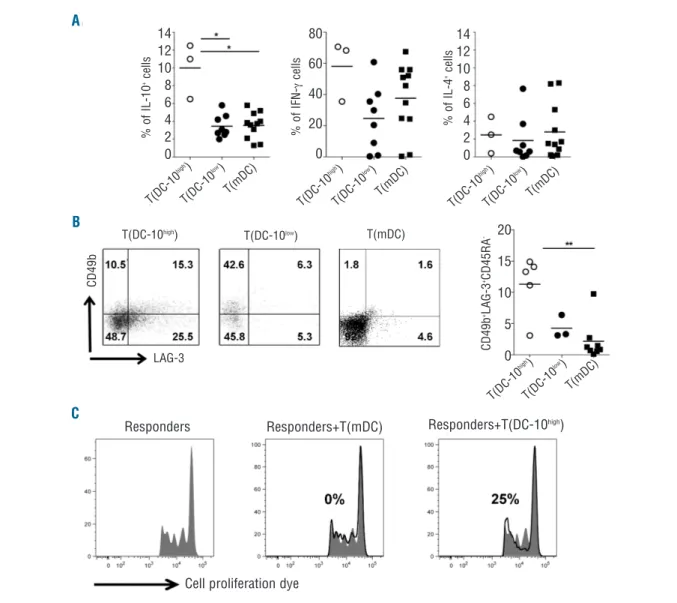
P=0.0121) and T(mDC) cells (on average 3.5%, P=0.0127) (Figure 4A). Moreover, in T(DC-10high) cells the proportion
of interferon-g-producing cells was on average 58.1%, and the frequency of IL-4-producing cells was very low (2.5±1.2%, mean±SEM, n=3; Figure 4A). Conversely, T(DC-10low) cells contained variable percentages of
inter-feron-g+T cells (ranging from 0.3% to 60.8%), and a low
frequency of IL-4+ T cells (1.9±0.93%, mean±SEM, n=8)
(Figure 4A). The percentages of interferon-g+and IL-4+ in
T(mDC) cells generated in parallel were comparable to those observed in T(DC-10high) and T(DC-10low) cells
(Figure 4A).
Tr1 cells can be identified by the co-expression of
CD49b and LAG-3.30Thus, we evaluated the frequency of
CD49b+LAG-3+CD45RA- cells in T(DC-10high) and
T(DC-10low) cells. Results indicated that T(DC-10high) cells
con-tained a higher frequency of CD49b+LAG-3+CD45RA
-cells (on average 11.3%) compared to both T(DC-10low)
cells (on average 4.3%) and T(mDC) cells (on average 2.2%, P=0.0031) (Figure 4B). In line with the presence of a high frequency of Tr1 cells, T(DC-10high) cells suppressed
the proliferation of autologous CD4+T cells activated with
mDC (40.3±11.1%, mean±SEM, n=3), while T(DC-10low)
cells did not (Figure 4C).These findings indicate that high levels of membrane-bound HLA-G improve the ability of DC-10 to promote IL-10-producing Tr1 cells.
Figure 4.DC-10 with high membrane-bound HLA-G induce Tr1 cell differentiation. Naïve CD4+T cells were stimulated with allogeneic HLA-Ghigh
DC-10 [T(DC-DC-10high)], HLA-GlowDC-10 [T(DC-10low)], or mDC [T(mDC)] for 14 days. (A) After culture, T cells were activated with PMA/IONO (leukocyte
acti-vation kit) for 6 h (as described in the Methods section), and cytokine production was determined by intracytoplasmic staining. Percentages of
IL-10-, interferon-g (IFNg)-, and IL-4-producing cells in T(DC-10high) (n=3), T(DC-10low) (n=8), and T(mDC) (n=11) cells are presented. Each dot represents
a single donor and lines indicate mean, *P<0.05. (B) After culture, the frequencies of CD4+T cells co-expressing CD49b and LAG-3 in T(DC-10high),
T(DC-10low), and T(mDC) cells were analyzed by FACS. One representative plot for each cell line (left panels) and percentages of CD49b+
LAG-3+CD45RA-in five, three, and eight independent experiments for T(DC-10high), T(DC-10low), and T(mDC) cells, respectively, are shown (right panel).
Numbers represent percentages of positive cells in each quadrant. Each dot represents a single donor and lines indicate mean, **P<0.01. (C)
T(DC-10high) and T(mDC) cells were tested for their ability to suppress responses of autologous CD4+T cells activated with mDC (Responders). Percentages
of suppression mediated by the indicated T-cell populations are indicated. One representative donor out of three tested is shown.
14 12 10 8 6 4 2 0 14 12 10 8 6 4 2 0 80 60 40 20 0 20 15 10 5 0 % o f IL -1 0 + c e ll s T(D C-10 high) T(DC-10high) T(DC-10low) LAG-3 C D 4 9 b T(mDC) T(D C-10 low) T(m DC) T(D C-10 high) T(D C-10 low) T(m DC) T(D C-10 high) T(D C-10 low) T(m DC) T(D C-10 high) T(D C-10 low) T(m DC) % o f IF N -g c e ll s % o f IL -4 + c e ll s C D 4 9 b +L A G -3 +C D 4 5 R A
-Cell proliferation dye
Responders Responders+T(mDC) Responders+T(DC-10high)
A
B
HLA-G
and HLA-G
DC-10 secrete comparable levels
of shed HLA-G1
To determine whether the low expression of mem-brane-bound HLA-G observed on HLA-GlowDC-10 could
be ascribed to their ability to shed HLA-G1 from the membrane, we evaluated the amounts of shed HLA-G1 in culture supernatants. We detected shed HLA-G1 in four out of 16 unstimulated DC-10 (1.9±0.4 ng/mL, mean±SEM) and in nine out of 16 stimulated DC-10 (3±0.4 ng/mL, mean±SEM; Figure 5A). Conversely, soluble HLA-G5 was never detected in DC-10 culture super-natants. Interestingly, mDC generated in parallel secreted higher levels of shed HLA-G1 than DC-10 both in steady state and upon activation (P=0.04) (Figure 5A). No differ-ences were observed in the ability of HLA-Ghighand
HLA-GlowDC-10 to release shed HLA-G1 (Figure 5B). Thus, in
vitro-differentiated DC-10 secrete small amounts of shed HLA-G1, but not HLA-G5. Moreover, the low expression of membrane-bound HLA-G observed on HLA-Glow
DC-10 is not associated with an increased release of shed HLA-G1.
Frequencies of 3’UTR HLA-G genotypes in donors with
HLA-G
highor HLA-G
lowDC-10
Polymorphisms at 3’UTR of the HLA-G locus influence its expression,31 thus we investigated whether variability
in this region can be associated with membrane-bound HLA-G expression on DC-10. Donors from whom we dif-ferentiated DC-10 were typed at the 3’UTR of HLA-G locus and the presence of eight different polymorphic sites
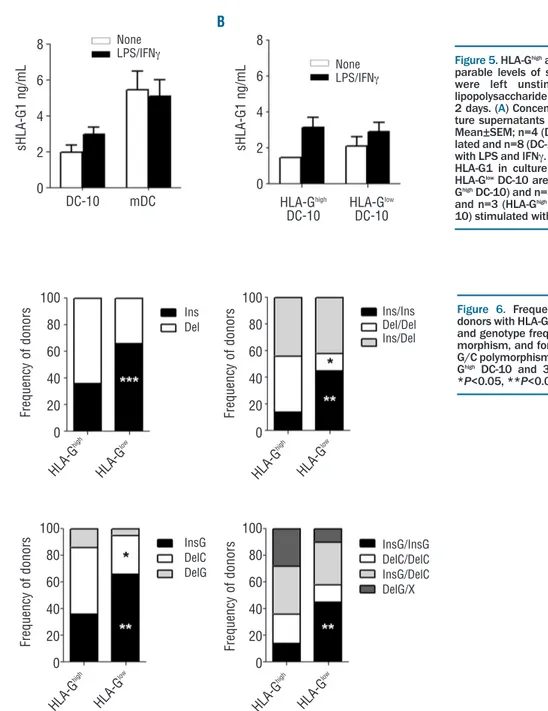
Figure 5.HLA-Ghighand HLA-GlowDC-10 secrete
com-parable levels of shed HLA-G1. DC-10 and mDC were left unstimulated or stimulated with lipopolysaccharide (LPS) and interferon-g (IFNg) for
2 days. (A) Concentrations of shed HLA-G1 in
cul-ture supernatants of DC-10 and mDC are shown. Mean±SEM; n=4 (DC-10) and n=9 (mDC) unstimu-lated and n=8 (DC-10) and n=12 (mDC) stimuunstimu-lated
with LPS and IFNg. (B) Concentration levels of shed
HLA-G1 in culture supernatants of HLA-Ghighand
HLA-GlowDC-10 are shown. Mean±SEM; n=1
(HLA-GhighDC-10) and n=3 (HLA-GlowDC-10) unstimulated
and n=3 (HLA-GhighDC-10) and n=6 (HLA-Glow
DC-10) stimulated with LPS and IFNg.
Figure 6. Frequencies of 3’UTR genotypes in
donors with HLA-Ghighand HLA-GlowDC-10. (A) Allele
and genotype frequencies for 14 bp Ins/Del
poly-morphism, and for (B) 14 bp Ins/Del and +3142
G/C polymorphisms in 67 healthy donors (36
HLA-GhighDC-10 and 31 HLA-Glow DC-10) are shown.
*P<0.05, **P<0.01, ***P<0.001. 8 6 4 2 0 100 80 60 40 20 0 100 80 60 40 20 0 100 80 60 40 20 0 100 80 60 40 20 0 DC-10 mDC HLA -G high HLA -G high HLA -G low HLA -G low HLA -G high HLA -G low HLA -G high HLA -G low
HLA-Ghigh HLA-Glow
DC-10 DC-10 8 6 4 2 0 s H L A -G 1 n g /m L s H L A -G 1 n g /m L F re q u e n c y o f d o n o rs F re q u e n c y o f d o n o rs F re q u e n c y o f d o n o rs F re q u e n c y o f d o n o rs None LPS/IFNg Ins/Ins Del/Del Ins/Del InsG/InsG DelC/DelC InsG/DelC DelG/X None LPS/IFNg Ins Del InsG DelC DelG A A B B
was inferred: the 14bp Ins/Del (rs1704), +3003 C/T (rs1707), +3010 C/G (rs1710), +3027 A/C (rs17179101), +3035 C/T (rs17179108), +3142 C/G (rs1063320), +3187 A/G (rs9380142) and +3196 C/G (rs1610696). We observed that the 14bp Ins allele was significantly highly represented both in a single dose (66%) and in double copy (45%) in donors with HLA-GlowDC-10 compared to
those with HLA-GhighDC-10 (36%, P=0.0009 and 14%,
P=0.0065, respectively; Figure 6A). Since 14bp Ins is in strong linkage disequilibrium with G in position +3142,32
we classified donors according to the presence of the 14bp Ins/Del and +3142 C/G polymorphisms as follows: InsG/InsG, DelC/DelC, DelC/InsG, and DelG/X. The rel-ative frequencies of these alleles and genotypes are shown in Figure 6B. As expected, a high frequency of the InsG allele was observed in donors with HLA-GlowDC-10 and
the DelC allele was significantly less represented in donors with HLA-Glowcompared to those with HLA-GhighDC-10
(P=0.0213; Figure 6B).
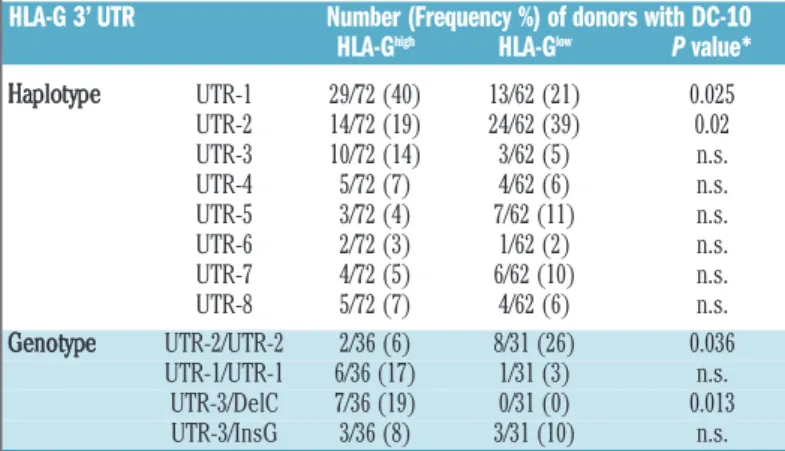
We next defined the frequencies of HLA-G 3’ UTR according to the classification of Castelli et al.,13and we
found that UTR-1 and UTR-2 were overall the most fre-quent haplotypes in our cohort of donors, UTR-1 being observed in 40% of donors with HLA-GhighDC-10, and
UTR-2 in 39% of donors with HLA-GlowDC-10 (Table 1).
Accordingly, UTR-2/UTR-2 was significantly more highly represented in donors with HLA-GlowDC-10 than in those
with HLA-GhighDC-10 (P=0.036; Table 1). Moreover, 19%
of donors with HLA-GhighDC-10 had UTR-3/DelC,
where-as none of the donors with HLA-Glow DC-10 had this
genotype (P=0.013; Table 1).
The presence of the 14bp Ins has been associated with low mRNA stability and reduced soluble HLA-G protein production.33We, therefore, investigated whether the
lev-els of mRNA for HLA-G were variable in DC-10 from dif-ferent 3’UTR HLA-G typed donors. Overall the amount of HLA-G transcripts was very low, and in seven out of 13 samples resulted below the detection limit. Nevertheless, the highest amounts of HLA-G transcript were from donors with 14bp Ins/Del and 14bp Del/Del genotypes (Online Supplementary Figure S2).
These findings demonstrate that the levels of expression of membrane-bound HLA-G on DC-10 can be influenced
by specific polymorphisms at the 3’UTR of the HLA-G locus, and that the UTR-2/UTR-2 genotype is more fre-quent among donors from whom DC-10 with low HLA-G were generated, while the UTR-3/DelC genotype was more frequent in donors with high HLA-G expression on DC-10.
MicroRNA-152 is highly expressed
in in vitro-differentiated DC-10
We hypothesized that 152, 148a, and miR-148b, which target G at position +3142, may be responsible for the low membrane-bound HLA-G expression observed in DC-10 from donors carrying the UTR-2/UTR-2 geno-type. We evaluated the expression of miR-152, miR-2110, and miR-93a predicted to have high binding affinity for HLA-G mRNA14. Results showed that miR-152 was
expressed on average 2.1-fold more (n=5) in DC-10 than in CD14+ precursors, whereas miR-2110 and miR-93a were
respectively equally or less expressed in DC-10 than in CD14+cells (Figure 7). These data suggest that the
expres-sion of miR-152 could be involved in the post-transcription-al regulation of HLA-G in DC-10, especipost-transcription-ally in those donors with 3’UTR haplotypes with G in position +3142.
Discussion
In the present study, we define the important role of HLA-G in DC-10-mediated induction of Tr1 cells. We show that the expression of membrane-bound HLA-G on DC-10 is donor-dependent and that, in the presence of similar levels of IL-10, a high expression of HLA-G on DC-10 is required to induce, at high frequency, Tr1 cells in vitro. We also established that 3’UTR genetic variations influence the HLA-G expression on DC-10 that might be finely tuned by miRNA-mediated post-transcriptional regulation. Similar to other populations of tolerogenic DC previous-ly described, G-CSF-induced DC34,35 and dermal CD141+
Table 1. Most frequent HLA-G 3’ UTR alleles and genotypes in donors with HLA-Ghighor HLA-GlowDC-10.
HLA-G 3’ UTR Number (Frequency %) of donors with DC-10 HLA-Ghigh HLA-Glow P value*
Haplotype UTR-1 29/72 (40) 13/62 (21) 0.025 UTR-2 14/72 (19) 24/62 (39) 0.02 UTR-3 10/72 (14) 3/62 (5) n.s. UTR-4 5/72 (7) 4/62 (6) n.s. UTR-5 3/72 (4) 7/62 (11) n.s. UTR-6 2/72 (3) 1/62 (2) n.s. UTR-7 4/72 (5) 6/62 (10) n.s. UTR-8 5/72 (7) 4/62 (6) n.s. Genotype UTR-2/UTR-2 2/36 (6) 8/31 (26) 0.036 UTR-1/UTR-1 6/36 (17) 1/31 (3) n.s. UTR-3/DelC 7/36 (19) 0/31 (0) 0.013 UTR-3/InsG 3/36 (8) 3/31 (10) n.s.
Haplotype and genotype frequencies of HLA-G 3’ UTR in 67 healthy donors (36 HLA-GhighDC-10
and 31 HLA-GlowDC-10). *Comparison between HLA-Ghighand HLA-GlowDC-10 using the Fisher
test. n.s. means “not statistically significant”.
Figure 7.miR-152 is highly expressed by in vitro-differentiated DC-10. miRNA were extracted from in vitro-differentiated DC-10 and the expression of the indicated miRNA was evaluated by reverse transcrip-tion polymerase chain reactranscrip-tion. Following normalizatranscrip-tion to miR-let7a, relative mRNA amounts from DC-10 cells were adjusted to
correspon-ding expression levels of a calibrator (corresponcorrespon-ding CD14+
precur-sors). Numbers represent arbitrary units. Each dot represents a single cell preparation and lines indicate the mean.
miR -93a miR -211 0 miR -152 R e la ti v e e x p re s s io n 4 3 2 1 0
cells,36we confirmed that DC-10 differentiated in vitro are
CD14+. Importantly, we define that DC-10 expressed
vari-able levels of HLA-G depending on the donor, and accord-ingly, DC-10 can be classified into HLA-Ghighor HLA-Glow.
We found that the expression of HLA-G on DC-10 corre-lated with that of ILT4, but not with the expression of ILT2 or of ILT3, which were highly expressed on DC-10 (data not shown). These findings are similar to those show-ing that in transfected antigen-presentshow-ing cell lines, the ectopic expression of HLA-G promotes the up-regulation of ILT2, ILT3, and ILT4.37
By proteolytic shedding, the HLA-G1 transmembrane can be released as shed HLA-G1, which retains all the functions of the membrane counterpart.6,38We postulated
that low levels of HLA-G on DC-10 may be associated with an increased production of shed HLA-G1. However, comparably low amounts of shed HLA-G1 were generat-ed from both HLA-Glowand HLA-GhighDC-10. The
produc-tion of shed HLA-G1 is regulated by the activity of matrix metalloproteinases,38 and specifically by matrix
metallo-proteinase-2.39Data from the gene expression profile of in
vitro-differentiated DC-10 indicated that matrix metallo-proteinases are present in DC-10 (Comi et al., unpublished data). Thus, it may be hypothesized that in HLA-Glow
DC-10 the great majority of HLA-G1 molecules are rapidly cleaved and released as shed HLA-G1, whereas the higher amounts of HLA-G1 synthesized in HLA-GhighDC-10
sat-urate the activity of matrix metalloproteinases and, as a result, more HLA-G1 is expressed as the transmembrane isoform. Future investigation will elucidate this possibility. Constitutive high HLA-G expression confers to antigen-presenting cells the ability to inhibit primary T-cell responses.23 We herein show that DC-10 displayed low
stimulatory activity regardless of the levels of HLA-G expression. This result is not surprising, since DC-10, independently of HLA-G expression, secrete high levels of IL-10, which directly inhibit T-cell responses in vitro.40-43We
have demonstrated that IL-10, either exogenously added or derived by DC-10, inhibited the proliferation of allo-geneic naïve T cells in vitro.44,45
DC-10 promote Tr1 cell differentiation via the IL-10-induced HLA-G/ILT4 pathway.27 Although IL-10, ILT4,
and HLA-G are important for DC-10 tolerogenic activity, their relative contributions in inducing Tr1 cells were not investigated. The identification of DC-10 that sponta-neously expressed high or low HLA-G finally allowed us to demonstrate that the high levels of HLA-G on DC-10 are required for efficient induction of anergic T cells, and consequently Tr1 cells. Indeed, we proved that HLA-Ghigh
DC-10 promoted Tr1 cells, identified as IL-10-producing or as CD49b+LAG-3+CD45RA- 30T cells, at higher
frequen-cy than HLA-GlowDC-10. In addition, our data sustain the
key role of IL-10 in DC-10-induced T-cell anergy (and Tr1 cells),27,43-45 since, in a limited number of donors, T cells
primed with HLA-GlowDC-10 became hypo-responsive to
secondary stimulation. Data presented in this study demonstrated that, although IL-10-derived by DC-10 is necessary to promote T-cell anergy, it is not sufficient to promote the differentiation of Tr1 cells at high frequency. The low HLA-G (and ILT4) expression on DC-10 hampers the amplification of the DC-10-mediated tolerogenic loop, consisting in inhibiting T-cell activation via ILT2 and pro-moting HLA-G and ILT4 expression on neighboring DC-10, and the consequent induction of IL-DC-10, which sustains Tr1 cell generation. Since HLA-G expression on DC-10 is
genetically determined, future studies aimed at up-regulat-ing HLA-G in donors prone to generate HLA-GlowDC-10
could definitively prove our hypothesis.
Studies investigating 3’UTR HLA-G polymorphisms and HLA-G expression have primarily focused on the association between the 14bp Ins/Del polymorphism and soluble HLA-G isoforms.33,46 Only recently have these
analyses been broadened to other polymorphisms in the 3’UTR region of G and to membrane-bound
HLA-G.47,48In the present study, we screened the association of
multiple variations in the 3’UTR HLA-G, considering alle-les, genotypes, haplotypes, and diplotypes, with mem-brane-bound HLA-G expression on DC-10. We found that the majority of donors with HLA-GlowDC-10 carried
hap-lotypes, such as UTR-2, UTR-5, UTR-7, containing 14bp Ins and G in position +3142, both variations previously associated with low mRNA stability.10,14These results are
in line with a recent work showing that 2 and UTR-5 are associated with low expression of soluble HLA-G.48
The presence of G at position +3142 increases the affin-ity of miR-152, miR-148a, and miR-148b for mRNA, pro-moting the repression of HLA-G expression.14 Moreover,
the over-expression of miR-148a or miR-152 in JEG-3 or LCL721.221 cell lines promotes post-transcriptional down-regulation of membrane-bound HLA-G.49,50
Interestingly, analysis of the miRNome profile of DC-10 and its comparison with that of mDC identified ten differ-entially expressed miRNA, including miR-148a (Comi et al., unpublished data). Moreover, miR-152 was highly expressed in DC-10 as compared to CD14+ precursors.
Thus, it can be postulated that post-transcriptional regula-tion of mRNA encoding for HLA-G may occur in DC-10 generated from donors carrying a double dose of 3’UTR haplotypes with +3142 G. The higher frequency of UTR-2, UTR-5, and UTR-7 in donors with HLA-Glow DC-10
supports this hypothesis. Although several questions regarding the mechanisms associated with polymorphic sites at 3’UTR of HLA-G need to be addressed, the present study evidences a link between the presence of 14bp Ins and the low expression of HLA-G, and indicates that this effect can be finely tuned by additional variations present at the 3’UTR, such as the +3142 C/G, possibly via miRNA-mediated post-transcriptional regulation.
In conclusion, this study provides new insights into the role of HLA-G in DC-10-mediated Tr1 cell induction: (i) high expression of HLA-G is required for efficient induction of Tr1 cells via DC-10; (ii) the contribution of soluble HLA-G isoforms in DC-10-mediated induction of Tr1 cells is neg-ligible; and (iii) 3’UTR HLA-G haplotypes and genotypes can be associated with the expression of membrane-bound HLA-G on DC-10 and, consequently, with their ability to prime naïve T cells to become Tr1 cells. To our knowledge, this is the first comprehensive study in which 3’UTR poly-morphisms have been associated with membrane-bound HLA-G expression and with tolerogenic properties of a spe-cific cell subset. DC-10 are currently used to generate allo-specific Tr1 cells for adoptive Treg-based cell therapy, but they represent an interesting therapeutic tool to induce or re-establish immunological tolerance in different clinical settings including allogeneic transplantation or autoimmune diseases. Results on the influence of 3’UTR genotypes on HLA-G expression on DC-10 and their tolerogenic activity provide new important tools for donor selection in several clinical settings such as hematopoietic stem cell and solid organ transplantation, and will also be relevant for
under-References
1. Kovats S, Main EK, Librach C, Stubblebine M, Fisher SJ, DeMars R. A class I antigen, HLA-G, expressed in human trophoblasts. Science. 1990;248(4952):220-223. 2. Rouas-Freiss N, Goncalves RM, Menier C,
Dausset J, Carosella ED. Direct evidence to support the role of HLA-G in protecting the fetus from maternal uterine natural killer cytolysis. Proc Natl Acad Sci USA. 1997;94(21):11520-11525.
3. Curigliano G, Criscitiello C, Gelao L, Goldhirsch A. Molecular pathways: human leukocyte antigen G (HLA-G). Clin Cancer Res. 2013;19(20):5564-5571.
4. Fujii T, Ishitani A, Geraghty DE. A soluble form of the HLA-G antigen is encoded by a messenger ribonucleic acid containing intron 4. J Immunol. 1994;153(12):5516-5524.
5. Ishitani A, Geraghty DE. Alternative splic-ing of HLA-G transcripts yields proteins with primary structures resembling both class I and class II antigens. Proc Natl Acad Sci USA. 1992;89(9):3947-3951.
6. Park GM, Lee S, Park B, et al. Soluble HLA-G generated by proteolytic shedding inhibits NK-mediated cell lysis. Biochem Biophys Res Commun. 2004;313(3):606-611.
7. Carosella ED. The tolerogenic molecule HLA-G. Immunol Lett. 2011;138(1):22-24. 8. Rousseau P, Le Discorde M, Mouillot G,
Marcou C, Carosella ED, Moreau P. The 14 bp deletion-insertion polymorphism in the 3' UT region of the HLA-G gene influences HLA-G mRNA stability. Hum Immunol. 2003;64(11):1005-1010.
9. Rebmann V, van der Ven K, Passler M, Pfeiffer K, Krebs D, Grosse-Wilde H. Association of soluble HLA-G plasma levels with HLA-G alleles. Tissue Antigens. 2001;57(1):15-21.
10. Hviid TV, Hylenius S, Rorbye C, Nielsen LG. HLA-G allelic variants are associated with differences in the HLA-G mRNA iso-form profile and HLA-G mRNA levels. Immunogenetics. 2003;55(2):63-79. 11. Tan Z, Randall G, Fan J, et al. Allele-specific
targeting of microRNAs to HLA-G and risk of asthma. Am J Hum Genet. 2007;81(4):829-834.
12. Veit TD, Chies JA. Tolerance versus immune response -- microRNAs as impor-tant elements in the regulation of the HLA-G gene expression. Transpl Immunol. 2009;20(4):229-231.
13. Castelli EC, Mendes-Junior CT, Deghaide NH, et al. The genetic structure of
3'untranslated region of the HLA-G gene: polymorphisms and haplotypes. Genes Immun. 2010;11(2):134-141.
14. Castelli EC, Moreau P, Oya e Chiromatzo A, et al. In silico analysis of microRNAS tar-geting the HLA-G 3' untranslated region alleles and haplotypes. Hum Immunol. 2009;70(12):1020-1025.
15. Yie SM, Li LH, Xiao R, Librach CL. A single base-pair mutation in the 3'-untranslated region of HLA-G mRNA is associated with pre-eclampsia. Mol Hum Reprod. 2008;14(11):649-653.
16. Lucena-Silva N, Monteiro AR, de Albuquerque RS, et al. Haplotype frequen-cies based on eight polymorphic sites at the 3' untranslated region of the HLA-G gene in individuals from two different geographical regions of Brazil. Tissue Antigens. 2012;79(4):272-278.
17. Larsen MH, Hylenius S, Andersen AM, Hviid TV. The 3'-untranslated region of the HLA-G gene in relation to pre-eclampsia: revisited. Tissue Antigens. 2010;75(3):253-261. 18. Alvarez M, Piedade J, Balseiro S, Ribas G,
Regateiro F. HLA-G 3'-UTR SNP and 14-bp deletion polymorphisms in Portuguese and Guinea-Bissau populations. Int J Immunogenet. 2009;36(6):361-366. 19. Shiroishi M, Kuroki K, Rasubala L, et al.
Structural basis for recognition of the non-classical MHC molecule HLA-G by the leukocyte Ig-like receptor B2 (LILRB2/LIR2/ILT4/CD85d). Proc Natl Acad Sci USA. 2006;103(44):16412-16417. 20. Riteau B, Menier C, Khalil-Daher I, et al.
HLA-G1 co-expression boosts the HLA class I-mediated NK lysis inhibition. Int Immunol. 2001;13(2):193-201.
21. Le Gal FA, Riteau B, Sedlik C, et al. HLA-G-mediated inhibition of antigen-specific cytotoxic T lymphocytes. Int Immunol. 1999;11(8):1351-1356.
22. Naji A, Menier C, Morandi F, et al. Binding of HLA-G to ITIM-bearing Ig-like transcript 2 receptor suppresses B cell responses. J Immunol. 2014;192(4):1536-1546. 23. LeMaoult J, Krawice-Radanne I, Dausset J,
Carosella ED. HLA-G1-expressing antigen-presenting cells induce immunosuppressive CD4+ T cells. Proc Natl Acad Sci USA. 2004;101(18):7064-7069.
24. Horuzsko A, Lenfant F, Munn DH, Mellor AL. Maturation of antigen-presenting cells is compromised in HLA-G transgenic mice. Int Immunol. 2001;13(3):385-394. 25. Naji A, Le Rond S, Durrbach A, et al.
CD3+CD4low and CD3+CD8low are induced by HLA-G: novel human peripher-al blood suppressor T-cell subsets involved in transplant acceptance. Blood.
2007;110(12):3936-3948.
26. Gregori S, Magnani CF, Roncarolo MG. Role of human leukocyte antigen-G in the induction of adaptive type 1 regulatory T cells. Hum Immunol. 2009;70(12):966-969. 27. Gregori S, Tomasoni D, Pacciani V, et al.
Differentiation of type 1 T regulatory cells (Tr1) by tolerogenic DC-10 requires the IL-10-dependent ILT4/HLA-G pathway. Blood. 2010;116(6):935-944.
28. Amodio G, Mugione A, Sanchez AM, et al. HLA-G expressing DC-10 and CD4(+) T cells accumulate in human decidua during pregnancy. Hum Immunol. 2013;74(4):406-411.
29. Locafaro G, Amodio G, Tomasoni D, Tresoldi C, Ciceri F, Gregori S. HLA-G expres-sion on blasts and tolerogenic cells in patients affected by acute myeloid leukemia. J Immunol Res. 2014;2014:636292.
30. Gagliani N, Magnani CF, Huber S, et al. Coexpression of CD49b and LAG-3 identi-fies human and mouse T regulatory type 1 cells. Nat Med. 2013;19(6):739-746. 31. Donadi EA, Castelli EC, Arnaiz-Villena A,
Roger M, Rey D, Moreau P. Implications of the polymorphism of HLA-G on its func-tion, regulafunc-tion, evolution and disease asso-ciation. Cell Mol Life Sci. 2011;68(3):369-395.
32. Castelli EC, Mendes-Junior CT, Veiga-Castelli LC, Roger M, Moreau P, Donadi EA. A comprehensive study of polymor-phic sites along the HLA-G gene: implica-tion for gene regulaimplica-tion and evoluimplica-tion. Mol Biol Evol. 2011;28(11):3069-3086. 33. Hviid TV, Rizzo R, Christiansen OB,
Melchiorri L, Lindhard A, Baricordi OR. HLA-G and IL-10 in serum in relation to HLA-G genotype and polymorphisms. Immunogenetics. 2004;56(3):135-141. 34. Rutella S, Bonanno G, Pierelli L, et al.
Granulocyte colony-stimulating factor pro-motes the generation of regulatory DC through induction of IL-10 and IFN-alpha. Eur J Immunol. 2004;34(5):1291-1302. 35. Rossetti M, Gregori S, Roncarolo MG.
Granulocyte-colony stimulating factor drives the in vitro differentiation of human dendritic cells that induce anergy in naive T cells. Eur J Immunol. 2010;40(11):3097-3106.
36. Chu CC, Ali N, Karagiannis P, et al. Resident CD141 (BDCA3)+ dendritic cells in human skin produce IL-10 and induce regulatory T cells that suppress skin inflam-mation. J Exp Med. 2012;209(5):935-945. 37. LeMaoult J, Zafaranloo K, Le Danff C,
Carosella ED. HLA-G up-regulates ILT2, ILT3, ILT4, and KIR2DL4 in antigen pre-senting cells, NK cells, and T cells. FASEB J. standing the immunological mechanisms underlying
autoimmune diseases and cancer.
Acknowledgments
We thank Prof. E.A. Donadi and Dr. R. Sales de Albuquerque, from the Division of Clinical Immunology, Department of Medicine, School of Medicine of Ribeirão Preto, University of São Paulo, São Paulo, Brazil, for technical support with the molecular biology.
Funding
This work was supported by Telethon Italy grant number
TGT11E02, and by the Italian Ministry of Health, RF-2011-02346774, and a European grant for European cooperation in science and technology (Action to Focus and Accelerate Cell-based Tolerance-inducing Therapies).
Dr. Giada Amodio conducted this study as partial fulfillment of her PhD in Molecular Medicine, Program in Basic and Applied Immunology, San Raffaele University, Milan, Italy.
Authorship and Disclosures
Information on authorship, contributions, and financial & other disclosures was provided by the authors and is available with the online version of this article at www.haematologica.org.
2005;19(6):662-664.
38. Dong Y, Lieskovska J, Kedrin D, Porcelli S, Mandelboim O, Bushkin Y. Soluble non-classical HLA generated by the metallopro-teinase pathway. Hum Immunol. 2003;64 (8):802-810.
39. Rizzo R, Trentini A, Bortolotti D, et al. Matrix metalloproteinase-2 (MMP-2) gen-erates soluble HLA-G1 by cell surface pro-teolytic shedding. Mol Cell Biochem. 2013;381(1-2):243-255.
40. Taga K, Mostowski H, Tosato G. Human interleukin-10 can directly inhibit T-cell growth. Blood. 1993;81(11):2964-2971. 41. de Waal Malefyt R, Yssel H, de Vries JE.
Direct effects of IL-10 on subsets of human CD4+ T cell clones and resting T cells. Specific inhibition of IL-2 production and proliferation. J Immunol. 1993;150(11): 4754-4765.
42. Groux H, Bigler M, de Vries JE, Roncarolo
MG. Interleukin-10 induces a long-term antigen-specific anergic state in human CD4+ T cells. J Exp Med. 1996; 184(1):19-29.
43. Groux H, O'Garra A, Bigler M, et al. A CD4+ T-cell subset inhibits antigen-specific T-cell responses and prevents colitis. Nature. 1997;389(6652):737-742.
44. Bacchetta R, Gregori S, Serafini G, et al. Molecular and functional characterization of allogantigen-specific anergic T cells suit-able for cell therapy. Haematologica. 2010;95(12):2134-2143.
45. Gregori S, Roncarolo MG, Bacchetta R. Methods for in vitro generation of human type 1 regulatory T cells. Methods Mol Biol. 2011;677:31-46.
46. Rizzo R, Hviid TV, Stignani M, et al. The HLA-G genotype is associated with IL-10 levels in activated PBMCs. Immunogenetics. 2005;57(3-4):172-181.
47. Rizzo R, Audrito V, Vacca P, et al. HLA-G is a component of the CLL escape repertoire to generate immune suppression: impact of HLA-G 14 bp (rs66554220) polymorphism. Haematologica. 2014;99(5):888-896. 48. Martelli-Palomino G, Pancotto JA, Muniz
YC, et al. Polymorphic sites at the 3' untranslated region of the HLA-G gene are associated with differential HLA-G soluble levels in the Brazilian and French popula-tion. PloS One. 2013;8(10):e71742. 49. Zhu XM, Han T, Wang XH, et al.
Overexpression of miR-152 leads to reduced expression of human leukocyte antigen-G and increased natural killer cell mediated cytolysis in JEG-3 cells. Am J Obstet Gynecol. 2010;202(6):592.e1-7. 50. Manaster I, Goldman-Wohl D, Greenfield
C, et al. MiRNA-mediated control of HLA-G expression and function. PloS One. 2012;7(3):e33395.