Manuscript Details
Manuscript number PEDOBI_2017_124_R1
Title ASSESSMENT OF SOIL MICROBIAL FUNCTIONAL DIVERSITY: LAND USE
AND SOIL PROPERTIES AFFECT CLPP-MICRORESP AND ENZYMES RESPONSES
Article type Research Paper
Abstract
The assessment of microbial functional diversity is an important indicator of soil quality. Different methodological approaches are currently used; among them are enzyme activities (EA) and CLPP (community level physiological profile) techniques (e.g. MicroRespTM, MR). The aims of the study were: i) to assess the efficacy of both methods in capturing differences among various land use categories when different levels of selected explanatory variables such as land use category, total organic carbon (TOC) and pH are considered, and ii) to explore, through a quantile regression approach, the possible relationships between each of the two methods with land use category, TOC and pH. The Shannon diversity index (H’), calculated from EA and MR data, was chosen as a synthetic index deriving from the same mathematical model. The quantile regression model (QRM), the Kruskal-Wallis and Spearman rank
correlation tests were performed. Enzyme activities and MicroResp were reliable ecological indicators to assess soil microbial functional diversity. No correlation was found between the diversity indexes, H’EA and H’MR, it was therefore supposed that the two methods may target complementary components of microbial functional diversity. Both methods were effective in capturing differences among various land use categories, in particular H’MR in soils with low TOC content (<1.5%). Moreover, the QRM approach allowed a more detailed analysis along the distribution of the diversity indexes (H’EA and H’MR) indicating that H’EA was more dependent on the selected variables.
Keywords Microbial processes; Shannon index; Soil properties.
Manuscript category Soil microbial ecology
Corresponding Author Sara Marinari
Order of Authors Maria Cristina Moscatelli, Luca Secondi, Ruxandra Papp, Rosita Marabottini, Stazi Silvia Rita, Elena Mania, Sara Marinari
Suggested reviewers José Luis Moreno-Ortego, Teresa Hernandez
Submission Files Included in this PDF
File Name [File Type]
cover letter.docx [Cover Letter]
Responses to reviewers.docx [Response to Reviewers]
Manuscript with Changes Marked .docx [Revised Manuscript with Changes Marked] Highlights.docx [Highlights]
Manuscript .docx [Manuscript File] Figures.docx [Figure]
Tables.docx [Table]
To view all the submission files, including those not included in the PDF, click on the manuscript title on your EVISE Homepage, then click 'Download zip file'.
Research Data Related to this Submission
There are no linked research data sets for this submission. The following reason is given:
Viterbo October 30th, 2017 To the Editor of
Pedobiologia Manuscript n. PEDOBI_2017_124
Dear Editor,
We wish to submit the revised article entitled “ASSESSMENT OF SOIL MICROBIAL FUNCTIONAL DIVERSITY: LAND USE AND SOIL PROPERTIES AFFECT CLPP-MICRORESP AND ENZYMES RESPONSES” modified following both yours and reviewers’ comments.
The paper has been deeply revised in most of its sections in relation to the new results obtained after standardization of data asked by reviewer n. 1 and further amendments asked by reviewer #2.
Therefore also the discussion and conclusions were focused on the new aspects emerged. For this reason we also agreed to change the title as you suggested.
We deeply thank you and the two anonymous reviewers for all the precious comments very useful to improve the whole paper.
We declare that we do not have conflicts of interest to disclose. Please address all correspondence concerning this manuscript to me. Thank you for your consideration of this manuscript.
Sincerely
Prof. Sara Marinari
DIBAF – University of Tuscia Via S. Camillo de Lellis Viterbo 01100 - ITALY [email protected]
1 Comments from the editor and reviewers:
Editor
The paper has been deeply revised in most of its sections in relation to the new results obtained after standardization of data as asked by reviewer n. 1 and further amendments asked by reviewer #2. Therefore also the discussion and conclusions were focused on the new aspects emerged. For this reason we also agreed to change the title as you suggested into:
ASSESSMENT OF SOIL MICROBIAL FUNCTIONAL DIVERSITY: LAND USE AND SOIL PROPERTIES AFFECT CLPP-MICRORESP AND ENZYMES RESPONSES
-Reviewer 1 General comments
The authors perform a meta-analysis of functional diversity measurements (Shannon index) in a range of soils with different land uses and provide a useful comparison of two methodological approaches, which they suggest target different stages in the soil organic matter decomposition process. The values obtained for the index are greater than what I would expect and the calculation should be checked or explained. They apply Quantile Regression Modelling of the data, which they argue is useful for
skewed distributions but more discussion is really needed on the meaning of the results. Some figures, or parts thereof, are duplicative and should be omitted. The authors’ final conceptual model, while making a valid distinction between the two functional measurements, is rather over-simplified and some of the concepts are a bit strange. In places the English could be improved; some examples are given below but there are others which need some editing.
We thank reviewer 1 for the general comment. The manuscript has been deeply revised in many of its sections following his/her suggestions and those of reviewer #2.
Specific comments
L16 This first sentence is not actually a sentence; start with something like “Here we consider…”.
Thanks! Actually there was a typing error and “as” was supposed to be “is”.
L18 Replace “i.e.” with “e.g.”.
Done throughout the manuscript
L22 “and pH”.
L52 I do not think this is entirely accurate. Catabolic processes continue all the time, generating maintenance energy – they become more apparent when energy for anabolic processes is lacking. Of course, certain types of stress may increase the demand for maintenance.
The sentence has been removed
L66 “pedogenic” is better than “pedogenetic”.
Done
L92 Replace “cases” with “case”.
Done
L93 Replace “On” with “For”.
Done
L103 The period of reconditioning should be stated.
Done
L121 Macaulay Scientific Consulting Ltd has now been replaced by James Hutton Ltd. Done
L129 It should be explained what the various symbols in the equation refer to and what were the values of the constants (or at least give a reference).
The conversion of absorbance to % CO2 is a non linear relationship and the best fitted curve (regression analysis) is used to obtain the formula and parameters. A calibration procedure was performed taking into account the spectrophotometer used, different types of soils and incubation conditions. In our experimental conditions the constants of the following equation A+B/(1+ D x Ai) were: A:-1,62, B:-4,85 and D: -8,1. (Campbell et al, 2003). See text.
L135, 138 I have some difficulty in referring to the Shannon diversity index in terms of entropy. Admittedly Shannon’s work on information theory had its roots in thermodynamics and there are parallels, but when applied to diversity within ecology it becomes a rather different concept. Increase in entropy is seen as negative (e.g. heat death of the universe), while increase in diversity is usually seen as something positive. In the context of the paper, I am not sure what “entropy of a system” and “microbial functions entropy” really mean (yes, I looked at Marinari et al. 2013 but it was not helpful and the reference Minasny et al. 2008 is really talking about the entropy in different mineralogies, with no biological component).
3 We agree that the increase of “entropy” of soil microbial functions means something positive, in any case, the term entropy can be also associated to the biodiversity in an ecological context as reported by Spellerberg and Fedor (2003). For this reason we added this reference in the text.
Moreover, the reference to Marinari et al. 2013 is related to the fact that microbial functions diversity is linked to the diversity of hydrolysable substrates. However, in that paper the concept of entropy was also related to pedogenesis that leads to a highest energy level when horizons differentiate and the spatial arrangement of soil particles (soil structure) becomes more defined.
L202 There are no lower outliers for SEI shown in Fig. 1 for any soil group. Also in these ranges, it is more conventional to go from low to high, e.g. 42 to 11821 (the latter should be written as 11800 as 11821 indicates unjustifiable accuracy).
We modified both the sentence concerning lower outliers and the order of values.
L206 Figure 2 and Table 2. I am having some difficulty in understanding the range of H’ values. The maximum values, and even the mean values, exceed what I would calculate as the maximum possible. Assuming you have used the formula as given in L135, then the maximum value (total evenness) would be 2.708 for 15 ‘species’ (carbon substrates) and 2.079 for 8 ‘species’ (enzyme activities). The data in Table 2 is giving maximum values of 6.720 and 5.490, respectively. Or has the index been calculated in some other way?
We thank the reviewer for this observation which enabled us to identify some inaccuracies in index calculation. In the updated version of the paper we changed the values and reported descriptive synthesis values in Table 2.
LL214-216 I am not convinced that Figure 3 is required in addition to Figure 2. It is essentially the same data presented in two ways. Given that the same data is also summarised in Table 2, it does seem to be overkill. However, the contention that H’MR has greater variability is not sustained. To compare properly the two datasets should be standardized – normally by dividing by the mean. The
interquartile distance then comes out as 0.24 and 0.25 for the H’EA and H’MR, respectively, – hardly a great difference.
We removed Figure 3 from the paper. In the revised version of the paper we used standardized measures for both indexes in order to deal with the issue of different ranges. This was specifically indicated in the M&M and Results section.
LL219-225 It is not necessary to repeat all the values given in Table 3 – omit the rs values.
Done. Only p-values were left in the text.
L223 At this point there is a switch to sometimes using soil type in place of land use category; it is better to stick with the latter (See also Table 4).
Done throughout the whole manuscript
L233ff It is not clear (not being that familiar with quantile regression) what the significance of the constant is, particularly since it seems to be highly significant in all cases. I presume it is just the intercept on the regression but is it the same regardless of whether the regression is against TOC, pH or Soil type (Land Use)?
The interpretation of intercept in QRMs is quite similar to its interpretation in standard linear
regression models (OLS) with the utmost importance to keep in mind a different intercept depending on the specific quantile that is being analysed.
L258ff It could be argued that because only 8 enzymes were assayed in comparison to 15 carbon substrates tested, that the enzyme approach in gauging diversity was necessarily more limited. Do you have a counter to this suggestion?
We agree that Shannon index is calculated using different numbers of enzymes and substrates (8 enzymes belonging to the 4 nutrients –C,N,P,S - biogeochemical cycles and 15 substrates representing four ecologically relevant categories of biomolecules – proteins, carbohydrates, organic acids and phenols). However, the aim of the study was to assess the efficacy of the two techniques, as they are generally used in the literature, to calculate a synthetic index aimed to capture differences among the different land uses when different levels of pH and TOC are considered. In particular we would like to stress that this study is a meta-analysis that has been conducted using data provided by previous researches performed. However, the comment is proper and we agree that to promote the use of both techniques in the same study, and to improve the interpretation of the obtained results, it should be suggested to select the same number of enzymes and substrates.
L280ff At the end of the day both enzyme activity (as assayed) and CLPP are both degradative, just that the former is one step back in the chain of events. One might have expected a greater degree of correlation in H’ values. However, H’ is only one way of expressing/summarising the data. What would have been the result had you looked at total activity (Figure 1) and made a comparison? Was this done or is it the subject of a separate study?
We thank the reviewer for this comment. The correlation between the functional capacity (total activity) measured according to the two methods (SEI and SIR reported in figure 1) showed a
significant coefficient (p<0.05). We would like to stress that even if, the functional capacity measured by means of the two methods was correlated, the functional diversity was not. This means that, although the capability to perform functions by enzyme and respiration were positively related, their variability (diversity of functions) was not.
LL302-303. Is this statement true? Admittedly immobilized enzymes can have little impact on solid substrates such as cellulose and hemicellulose because of spatial separation, but once polymeric fragments are solubilised such enzymes can then come into contact with them. Their monomeric products then become available to the microbial community. Your tests with MUF substrates
demonstrates that immobilized enzymes are still active against low molecular weight intermediates (if indeed this is the case).
Yes, the statement is true and we do not understand what the reviewer referred to. The sentence at lines 302-303 referred to the fact that, being enzymes also in the soil in the immobilized forms, these may not be directly expression of microbial activity, thus of microbial functional diversity.
Immobilized enzymes represent a background biological activity giving resilience to soils under unfavourable conditions for microbial life. However, due to methodological limitations, we cannot subtract the immobilized enzymes contribution to the total activity measured in the laboratory with the current available methods.
LL311-315 There is not much discussion on the QRM results. Quite a lot of space is devoted to the methodology and results of the QRM so I was hoping for a bit more explanation as to what the ecological implications of the findings were.
We reduced the theoretical explanation of QRM consistently to what is required by Reviewer 2 as well. Moreover we added explanation concerning ecological implications of the results.
5
L315 Spelling of Zahlnina?
Corrected
Figure 3. The H’MR result does not need to be dashed – not done for other figures.
In accordance with your comments concerning Figure 3 (LL214-216) we removed this figure from the paper.
Figure 4. The two parts (figure and table) duplicate each other. The figure part should be omitted since all the information is in the table. It would probably aid clarity if numbers are given to three significant figures only (greater accuracy is unwarranted).
We deleted Figure 4; in the revised version of the paper only the table is reported, now table 4. Moreover, we considered three significant figures.
Table 1 L3 the abbreviation is “conv” not “con”.
Done
Table 3 This table seems to be overly complicated. Why not 1X4 in place of 4X4, i.e. the four values in one row?
The table has been simplified as suggested
Table 4 TOC and Soil type are given as discrete variables whereas pH is given as a single (continuous?) variable, not as the ranges given in Figure 4 – this seems to be rather inconsistent. In actuality, for the purpose of these regressions, would it not be better to treat TOC as the continuous variable it is, rather than boxing it into these three categories?
We re-estimated QRM by considering pH in classes (as Table 5). The distinction of variables into classes enabled us to detect significant changes of the relationship with the dependent variables and within/across quantiles.
Reviewer 2
-General Comments
Authors present an interesting study about the functional diversity of soil microbial activity in a wide range of soils submitted to different utilization. The variation of Shannon’s Index of diversity for microbial functional diversity was studied by measuring the profiles both of different enzyme
activities and micro-respiration of diverse C substrates. Also they determine the effect of pH and TOC of soil in this microbial functional diversity. Important conclusions are derived from the obtained results in this study. In general the manuscript is written in a good English language, although some specific parts of the text should be re-written in a clearly and simply way.
Specific comments Abstract
L16. In this sentence, a verb is missing. Please re-write in a grammatically correct form.
The sentence was corrected, actually there was a typing error and “as” was supposed to be “is”.
L22. Insert the conjunction "and" between the words “category” and “pH”.
The sentence has been changed
L74. Correct publication year: 2002.
Done
Material and Methods
This section should be structured in several sub-sections, e.g.: Experimental design, soil sampling, soil analysis methodologies, statistical methods…
Done
L92. "Cases studies" should be write "case studies".
Done
What do you mean? Are these case studies treatments or conditions? Explain in a clearly way.
With the term “case study” we mean a particular investigation that included different treatments. For example: one of the 4 case studies included in the “forest soils category F” was related to different management practices in two adjacent soils, one under native forest and the other one under a recently coppiced forest. This was clarified in the text.
L95. Delete colon (:)
Deleted
L96. Include conjunction "and" between the words “afforestation” and “chronosequences”.
Done
L98. Firstly, substitute conjunction "and" by comma and the include conjunction "and" between the words “tillage” and “natural”.
7 Done
L100. Insert conjunction "and" between the words “paddies” and “highly”.
Done
L101. Explain better the case studies of EC category because only five case studies are distinguished.
There was a typing error. The case studies belonging the EC category are 6: three of them subjected to natural pedoclimatic conditions and the other three under heavy anthropic impact. It has been better specified in the text.
L103. You should specify conservation or store method of soil samples.
Conservation and treatment of soils from sampling to analyses has been detailed in the text.
L111. Why did you only analyze the acid-phosphatase activity? Alkaline phosphatase activity is a more important activity in alkaline soils.
We agree with this observation. However, in all case studies the same experimental set-up for enzymatic assays has been used and this allowed to perform this meta-analysis. Eight different enzymes on several soil samples were measured at the same time in the same microplate using a common buffer as that suggested by Marx et al. (2001) (NaAc pH 5,5). In this way the biondicator used responds to the requisites of providing fast results while processing a great amount of soils in a short time.
L129. If you include this equation you should explain what is every variable or parameter of it.
A calibration procedure was performed taking into account the spectrophotometer used, different types of soils and incubation conditions. In our experimental conditions the constants of the following equation A+B/(1+ D x Ai) were: A:-1,62, B:-4,85 and D: -8,1. (Campbell et al, 2003). See text
L131. Please explain SEI and SIR and how they are calculate or measured. Dumontet et al., 2001 is not a pertinent reference for specifically citation about Synthetic Enzymatic Index, because in this study this index is not introduced.
Explanation of calculation of SEI and SIR has been given in the M&M section. Dumontet et al., (2001) provided the suggestion of combining some enzyme activities leading to the same final product (e.g. pNP or MUF) as a synthetic index. However, we removed this citation since it is considered not pertinent.
L152. Specify these two distributions because Figure 1 represents SEI and SIR values and Figure 2 truly shows the distributions of H'EA and H'MR.
Modified. In the revised version of the paper we specified that this sentence refers to the two distributions illustrated in Figure 2.
L154. Re-write this sentence, clearly specifying the two explanatory variables.
The sentence has been clarified presenting the selected covariates in this study
L168-186. The explanation of the quantile regression model used in this study should be re-written in a clearly and simply way, without mathematical equations. Authors are not expected to write a statistical treatise in this part of the manuscript. Authors should explain what does it consist in and why do you use this particular regression?
This section has been re-written without mathematical equations and emphasizing the advantages of QRMs in soil analysis.
L192-197. In this paragraph, you should write statistical significance of the relationship. The correlation coefficient stablishes the relationship level between two variables.
We added the level of significance. Results
L202. Delete “and lower”. Only upper outliers are shown in figure 1a
Modified
L201-204. Re-write this sentence in a clearly and simply way.
Modified, taking into consideration also suggestions by Reviewer 1.
L210. Delete “the null hypothesis of normal data is rejected for both distributions”. This part of the sentence is obvious and reiterative because it was previously stated that these two distributions were significantly different from normality.
Done
L217-218. Delete "lower" and "upper" because the outliers are shown under and above the whiskers.
We deleted box-plots taking also into consideration suggestions by Reviewer 1
L225. Authors should include p-values for these two cases.
Modified
L226. Delete "significantly" and after "distinguished" add "in different ways”.
Modified
L227. Substitute “However” by "Thus".
Modified
L239. Write "quantile" in singular.
Modified
L243. After "relationship", include "with the land use category A”.
Comments have been modified according to the new estimated models.
L245. “this land use category A”. Re-write such as: "the land use category A”
Comments have been modified according to the new estimated models.
L258-267. In this paragraph, authors should include an explanation how pH can affect microbial function diversity represented by H'MR.
Done
L324. Delete the preposition"at".
1 LEGENDA:
2 Yellow marked text: modified text
3 Blu marked text: deleted text
4 Comments mark where new sentences have been added
5 6
7
8 EFFECTIVENESS OF ENZYME ACTIVITIES AND CLPP-MICRORESP AS
9 INDICATORS OF MICROBIAL FUNCTIONAL DIVERSITY IN A WIDE RANGE OF
10 SOILS
11
12 Moscatelli M.C.1, Secondi L. 1, Marabottini R. 1, Papp R. 1, Stazi S.R. 1, Mania E.2, Marinari S.* 1
13 1Dept. for Innovation in Biological, Agrofood and Forest systems (DIBAF), University of Tuscia, 14 Viterbo, Italy
15 2Department of Agricultural and Forest Sciences (DISAFA), University of Torino, Torino, Italy 16
17
18 *corresponding author [email protected], tel. 0039-(0)761-357288
19 20
22 Abstract
23 The assessment of microbial functional diversity, as an important indicator of soil quality. Different
24 methodological approaches are currently used; among them are enzyme activities (EA) and CLPP
25 (community level physiological profile) techniques (i.e. MicroRespTM, MR). The aims of the study
26 were: i) to assess the efficacy of both methods in capturing differences among various types of soils
27 when different levels of selected explanatory variables such as Total Organic Carbon (TOC), land use
28 and pH are considered, and ii) to explore, through a quantile regression approach, the possible
29 relationships between each of the two methods with TOC, land use category, pH. TOC and pH were
30 chosen as explanatory variables influencing microbial functional diversity. The Shannon diversity
31 index (H’), calculated from EA and MR data, was chosen as a synthetic index deriving from the same
32 mathematical model. The quantile regression model (QRM), the Kruskal-Wallis and Spearman rank
33 correlation tests were performed. The QRM and Kruskal-Wallis tests evidenced that MicroResp
34 technique generally provided a higher discrimination capacity within different land use categories,
35 TOC and pH ranges (TOC <0.15-8.41%; pH <4.02-9.01>). Soil pH was found to be a key property,
36 rather than TOC content, in differentiating microbial processes. H’EA and H’MR were not correlated
37 but, when analysed separately, only agricultural soils showed a weak correlation (P<0.1) probably
38 due to the fact that these soils features fall within the intermediate range of pH and TOC where both
39 methods were found to be significantly sensitive. These results suggest that the two methodologies do
40 not target the same microbial processes. We hypothesize that the two methodologies refer to
41 sequential steps of microbial activity. In fact, pointing to complementary components of microbial
42 functional diversity EA and MR provide a different ecological significance which may inform on the
44 Introduction
45 The links between ecosystem functioning and levels of soil biodiversity have been the focus of the
46 recent scientific literature (Delgado-Baquerizo et al. 2016; Griffiths et al. 2016; Nannipieri et al.
47 2003). The first authors provided evidence that loss in microbial diversity will likely reduce multiple
48 ecosystems functions thus negatively impacting the provision of ecosystem services. Adhikari &
49 Hartemink (2016) claimed for new insights into soil microbial diversity and their role in soil
50 functional variability. Since up to 80/90% of soil functions, from humification to mineralization, is
51 microbially-mediated, the diversification of soil microrganisms in terms of structure and/or activity is
52 essential to maintain functioning of terrestrial ecosystems (Pereira et al. 2013).
53 Microbial functional diversity is defined as “the sum of the ecological processes, and/or capacity to
54 use different substrates developed by the organisms of a community” (Insam et al. 1989). Emmerling
55 et al. (2002) and Wellington et al. (2003) report that if microbial genetic diversity assesses a latent
56 diversity, which may not be expressed, functional diversity is related to the actual activities resulting
57 from that potential so that "functional rather than taxonomic diversity may provide greater insight to
58 microbial roles in ecosystems" (Zak et al. 1994). In fact, under stress or unfavourable conditions,
59 microorganisms may switch from anabolic pathways to catabolic pathways (Anderson and Domsch
60 2010). In this case the soil turns into a dissipating energy system with enhanced energy demand.
61 Over the last 10 years, the scientific literature provided a great number of papers aimed to assess
62 microbial functional diversity as an important ecological indicator to monitor and assess soil quality
63 changes in different pedoclimatic conditions, land uses and human pressure levels (i.e. management
64 practices)(Bardgett and van der Putten, 2014; Griffiths et al., 2016).
65 To measure the activity and diversity of the microbial community a number of methods can be
66 applied, to cite few of the most common approaches: (i) catabolic activity investigated by BiologTM
-67 plates (Garland and Mills, 1991; Rutgers et al. 2016), (ii) respiration of different substrates as
68 investigated by the MicroRespTM method (Campbell et al. 2003; Chapman et al. 2007; Creamer et al.
70 Although all methodological approaches are reliable and sensitive, few studies aimed to understand
71 their effectiveness to discriminate microbial functional diversity in relation to soil organic C and pH
72 as the main properties being affected by land use and management practices, anthropic impact and
73 other pedogenetic factors. To achieve this goal, a large number of case studies covering different
74 types of soils is necessary. In this study, about 200 measurements of microbial functional diversity
75 obtained over a broad spectrum of key soil properties and across different land uses and management,
76 were selected. Furthermore, microbial functional diversity obtained through enzyme activities (EA)
77 and CLPP-MicroResp (MR), was synthetically represented by the Shannon index (H’) that
78 transforms the obtained results to a comparable range of values deriving from the same mathematical
79 model.The Shannon index is a comprehensive indicator of microbial species, individual numbers and
80 evenness, or distribution of the enzyme activities and is influenced by richness of community species
81 (Bending et al. 2004; Li et al., 2007).
82 The aim of the present study was therefore to: i) assess the efficacy of both methods in capturing
83 differences among the different land use categories when different levels of pH and TOC are
84 considered, ii) explore, through a quantile regression approach, the possible relationships between
85 each of the two methods and selected explanatory variables (TOC, land use category, pH).
86 Furthermore, the results of these analyses could help to assign an ecological significance to both
87 methods in various environmental contexts and research issues.
88
89 Materials and methods
90 The results presented in this paper have been obtained performing additional statistical analyses on
91 data collected in the Laboratory of Chemistry and Biochemistry, University of Tuscia, Viterbo, Italy
92 during the last 6 years (2010-2016). Microbial functional diversity was measured, by means of
93 enzyme activities and CLPP-MicroRespTM technique, in a wide range of soils analysed within
94 different research projects. Most of the sampling sites are located within the Mediterranean climatic
96 Switzerland, oceanic for United Kingdom and boreal for Sweden. All soils represent a broad
97 spectrum of key soil properties across different land use categories, wide range of soil pH and soil
98 organic carbon content (TOC) (Table 1).
99 The soils were grouped into three main categories, including 15 cases studies, with the aim to
100 separate diverse land uses and/or specific conditions. On this purpose, three groups were identified: F
101 (forest soils, 4 case studies), A (agricultural soils, 5 case studies) and EC (extreme conditions, 6 case
102 studies). The case studies performed on forest soils (F) included different: management practices,
103 lithological substrates, afforestation, chronosequences. The soils under agricultural land use (A) were
104 characterized by different managements and/or agricultural practices such as: organic, biodynamic
105 and conventional cropping systems, tillage/no tillage, natural green cover/no cover. The third
106 category (EC) included soils with peculiar characteristics due to pedoclimatic conditions (saline
107 environments, natural arsenic contamination in rice paddies, highly calcareous soils) or heavy
108 anthropic impact (a multi-element contaminated dump, arsenic contaminated mine)(Table 1).
109
110 All soils were sampled at 0-20 cm depth during the dry season (spring/summer), air dried, sieved at 2
111 mesh and re-conditioned at 60% of their water holding capacity prior to biochemical analyses.
112 The total organic carbon (TOC) was determined by combustion by Shimadzu TOC VCSH analyzer
113 while soil pH was measured on sieved soil suspended in a solution of deionised water in 1:2.5 ratio
114 (w/v). The pH was measured in the supernatant with a pH meter (pH 211, Hanna Instruments).
115 A total of 196 values of microbial functional diversity, assessed by means of enzyme activities and
116 CLPP-MicroResp, were used for this study (Table 1). Enzymes were measured following Marx et al.
117 (2001) using fluorogenic methylumbelliferyl (MUF)-substrates. Soils were analysed for
118 cellobiohydrolase, glucosidase, -1,4-glucosidase, -N-acetyl-glucosaminidase,
-1,4-119 xylosidase, acid-phosphatase, arylsulphatases and butyrate esterase which is considered a proxy of
120 endocellular activity (Wittman et al. 2004). The relative fluorogenic substrates, prepared with acetate
121 buffer 0.5 M pH 5.5, were: 4-MUF-β-D-cellobioside, 4-MUF-β-D-glucoside,
122 glucosaminide, 4-MUF-α-D-glucoside, 4-MUF-phosphate, 4-MUF-7-β-D-xyloside, 4-MUF-sulphate
123 and 4-MUF-butyrate. Fluorescence (excitation 360 nm, emission 450 nm) was measured with an
124 automatic fluorimetric plate-reader (Fluoroskan Ascent) and readings were performed after 0, 30, 60,
125 120 and 180 minutes of incubation at 30° C. The results were expressed as nmoles of product (MUF)
126 of each enzymatic reaction released per g of soil per unit of time in relation to a standard curve
127 prepared with increasing MUF concentrations and incubated at the same experimental conditions.
128 The community level physiological profile (CLPP) was determined using the MicroRespTM soil
129 respiration system (MicroRespTM, Macaulay Scientific Consulting Ltd, Aberdeen, UK) according to
130 Campbell et al. (2003).
131 The 15 substrates selected in this study were: α-D-glucose, D-Galactose, D-fructose, arabinose,
L-132 leucine, L-arginine, Glycine, L-aspartic acid, γ-amino-butyric and glutamic acid, three carboxylic
133 acids: citric acid, oxalic acid and L-ascorbic acid, and two phenolic acids: vanillic and syringic acid.
134 The emission of CO2 by the microbial biomass was estimated using a colorimetric method
135 (microplate spectrophotometer) before and after 6 h of incubation at 28 °C. The absorbance was read
136 at 595nm. At the end the absorbance was normalised for any difference recorded at time zero and
137 then converted to % CO2 using the calibration curve y = A+B/(1+ D x Ai). The CO2% was converted
138 to µg C-CO2 g-1 h-1 production rate using gas constant, T° C, headspace volume, soil dry weight
139 (d.w.) and incubation time. The SEI (Synthetic Enzymatic Index, Dumontet et al, 2001) and SIR
140 (Substrate Induced Respiration) for all soils within the three categories (F, A and EC) have been
141 calculated as a synthetic measure of microbial functional capacity.
142 Microbial functional diversity was assessed calculating the Shannon-Weaver diversity index
143 (Kennedy and Smith, 1995) corresponding to the entropy concept defined by: H’ = - ∑ pi * ln pi
144 (Shannon and Weaver, 1949), where pi is the ratio of the activity of a particular enzyme to the sum of
145 all enzymatic activities (H’EA) or the respiration rate of each single C-substrate for MicroRespTM
146 (H’MR). Shannon diversity index is related to the entropy of a system and when applied as a measure
147 of microbial functions entropy, may express the heterogeneity of soil organic substrates availability
Commented [2]: New sentence has been added as required
Commented [3]: New sentence added
148 and microbial processes (Marinari et al., 2013). Since the eight enzymes and the 15 substrates here
149 tested did show activity in all the analysed samples, then, in this work, the diversity recorded reflects
150 only the “evenness” or distribution of the enzyme activities or ability to use the different substrates
151 (Bending et al., 2004; Rodríguez-Loinaz et al., 2008).
152
153 The analysis of all collected data was carried out into three main steps. Firstly, descriptive analyses
154 provided us with a clear picture of the distribution of the two indexes (H’EA and H’MR) as well as
155 information about the shape of the two distributions. Moreover, rank correlation measures and test
156 performed by using the Spearman correlation enabled us to evaluate if, and to what extent, the two
157 methodological approaches (EA, enzyme activities and MR, MicroRespTM) used to evaluate soil
158 microbial functional diversity are related.
159 The Kruskal-Wallis non-parametric test was used to test if and to what extent the two indexes
160 distinguished the various land use categories in relation to TOC and pH ranges.
161 By considering the asymmetry of the two distributions (as shown in Figure 1 and Figure 2) as well as
162 the results of the Shapiro-Wilk normality test, we analyzed the existence of association between each
163 of the two measures and two explanatory variables, by estimating quantile regression models.
164 Indeed, quantile regression offers the possibility to highlight how the effect of the selected covariates
165 changes throughout the entire distribution of the dependent variable. To estimate the relationships
166 (association) between the dependent variables and the set of selected covariates the classical OLS
167 (Ordinary Least Squares) regressions can be applied. However, data obtained from experimental
168 collection tend to be skewed so these models do not describe the “correct” relationships. Moreover,
169 from the soil analysis perspective, it is interesting to understand what happens throughout the entire
170 distribution of the two measures and at their extremes.
171 Quantile Regression Models (QRMs) are of special interest to studies characterized by skewed
172 distributions. Indeed, these models allow for investigation of the potential different effect of a
173 covariate on various quantiles in the conditional distribution, they are more robust to the presence of
Commented [5]: Heading added
174 outliers and can be consistent under weaker stochastic assumption than with least-squares estimation
175 (Cameron and Trivedi, 2005). The application of these types of models to our analysis can help to
176 understand if and to what extent the differences observed between the two measures can be attributed
177 to the different effect played by the explanatory variables at the various quantiles. The QRM
178 specifies the conditional quantile of the dependent variable y as a linear function of covariates
179 (Koenker 2005):
180
' i i i i
Q y x x β (1)
181 where yi (i=1,...,n) is the dependent variable represented, in turn, by, xi is a sequence of k-vector of
182 regressors, β is an unknown vector of regression parameters associated with the ɵth quantile and ɛi
183 is an unknown error term. According to Koenker and Bassett (1978) who introduced QRMs the ɵ-th
184 regression quantile, 0 < ɵ < 1, is defined as any solution to the minimization of the sum of absolute
185 deviation residuals: 186
i i i i i i K y i i i y i i i R x y xβ : x y xβ ' : ' 1 min (2) 187188 which is solved by linear programming methods. When ɵ is continuously increased from 0 to 1, we
189 obtain the entire conditional distribution of y conditional on x. Starting from the general equation (1)
190 and with the aim of identifying factors associated with values of the two measures estimated, two
191 quantile regression models which assumed the dependent variable yi (i=1,...,n) to be: (i) H’EA and
192 (ii) H’MR respectively were estimated. In both models the k-dimensional vector xi of covariates
193 includes factors describing the land use category, pH and the level of TOC. Among the soil
194 properties that mostly affect microbial biomass activity and diversity, TOC and pH were chosen as
196 study, the distribution of TOC values allowed to homogeneously group soils into three categories: i)
197 low: for TOC < 1.5 %; ii) medium TOC < 1.5 – 3>; iii) high: for TOC ≥3%. Similarly, pH values
198 allowed to group soils into three categories: i) <6.5 slightly acid – very strongly acid, ii) <6.5-7.4>
199 neutral, iii) >7.4 slightly alkaline – moderately alkaline. The grouping criteria were established with
200 the aim to obtain three groups with the same number of observations.
201 STATA software (STATA 13.2 edition) was used for statistical analyses. Three different levels of
202 significance were considered for the estimated coefficients and are reported in the model: a value of
203 p<0.01 (indicated in the tables of results with ***), emphasizing strong relationships between the
204 explicative variable of interest and the dependent variable; the value of p<0.05 (indicated in tables of
205 results with **) and finally a value of p<0.10 (indicated in the tables of results with *) emphasizing a
206 weak relationship between the variables.
207
208 Results
209 Figure 1 shows the functional capacity of soil microbial biomass calculated as the SEI and SIR for all
210 soils within the three categories (F, A and EC). Extreme conditions soils showed the highest level of
211 variability, including upper and lower outliers, for SEI (ranging from 11821 to 42 nmoles MUF g-1 h
-212 1), while forest soils soils functional capacity was more variable for SIR (ranging from 177 to 0.9 g
213 CO2 g-1 h-1). Agricultural soils show, for both methodological approaches, a smaller range of
214 variation and lower outliers.
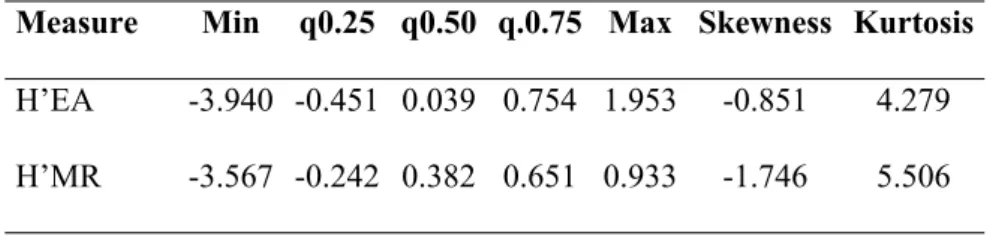
215 Figure 2 shows the distribution of the two indexes values H’EA and H’MR, respectively, over the
216 196 values of microbial functional diversity.
217 The two distributions are positively skewed and leptokurtic - as emerged by the descriptive statistics
218 reported in Table 2 – and significantly different from normality as confirmed by the Shapiro-Wilk W
219 and Shapiro-Francia W test (the null hypothesis of normal data are rejected for both distributions, p-220 value=0.000).
221 A similar level of overall variability (which also includes upper and lower outliers) characterizes the
222 two distributions as described by the values of coefficient of variation (CV). On the other hand, by
223 focusing on the box-plots in Figure 3, it should be noted that – while considering the different
224 magnitude of the two indexes – the larger height of the rectangles highlights a greater level of
225 variability in the middle part of the distribution (i.e. the central half of the sample) concerning H’MR
226 index. The presence of values outside the whiskers (dots in Figure 3) identifies lower outliers for
227 H’EA and upper outliers for H’MR index.
228 The Spearman rank correlation, verifying the similarity of the orderings of the data when ranked
229 according to each of the measures, showed that the two measures are not related for measuring
230 microbial functional diversity (rs = - 0.0355; p-value = 0.6217) (Table 3).
231 However, by distinguishing rank correlation according to the land use category, we found a moderate
232 level of concordance (rs = 0.2213; p-value = 0.0656) when the two indexes refer to soil of type A. No
233 correlation was found between the two measures for soil type EC and F (rs = - 0.1410 and rs = -
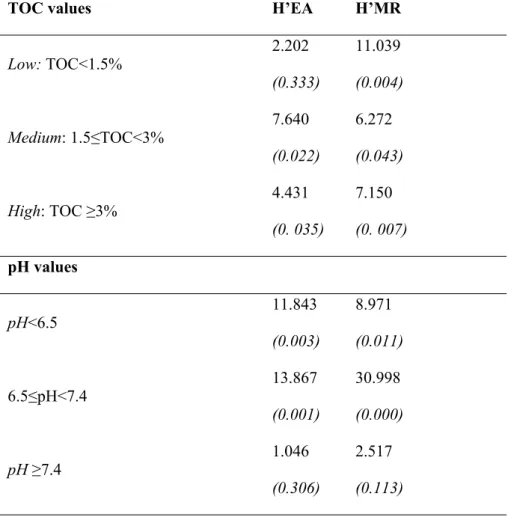
234 0.0579 respectively) (Table 3). According to the results of Kruskal-Wallis test, both H’EA and H’MR
235 significantly distinguished the various soils when TOC or pH ranges were considered (Figure 4).
236 However, H’MR showed a greater effectiveness than H’EA according to the p-values reported in
237 Figure 3. In fact, while H’EA discriminated soils only for TOC values <1.5 - 3%> and pH values
238 <6.5 - 7.4>, H’MR was significantly effective along all ranges for both soil properties.
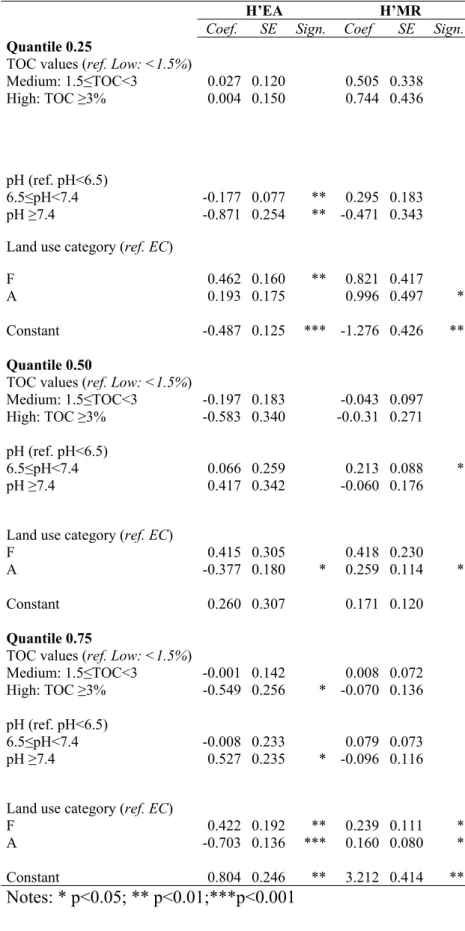
239 The analysis of the potential relationships between each of the measures (H’EA and H’MR) and the
240 two selected variables (TOC and pH) was carried out by referring to the quantile regression
241 approach, which enabled us to analyse the effect of the covariates (TOC and pH) throughout the
242 entire distribution as well as at the extremes. Table 4 shows the estimation results of regression
243 models at quantiles 0.25, 0.50 and 0.75.
244 The total organic carbon content is not significantly associated neither with H’MR nor with H’EA,
245 except for medium and high classes of TOC values at quantile 0.50 for H’EA (p-value<0.10).
247 distribution (i.e. for low values of the dependent variable H’EA) while a positive relationship was
248 observed in the highest quantiles of the distribution (i.e. for high values of the dependent variable
249 H’EA). On the other hand, pH values are positively related with H’MR in the middle part of the
250 distribution (quantile 0.50) only.
251 The land use category is an important factor distinguishing the values of the two measures. For H’EA
252 the relationship is positive and strongly significant in the lower part of the distribution (quantile 0.25)
253 while a negative relationship in the upper part (quantile 0.75) was found. A negative relationship
254 characterizes this land use category (A) and the H’MR measure in the first half part of the
255 distribution (quantiles 0.25 and 0.50) compared to the EC category representing the reference
256 category. Finally F soils category shows a positive relationship with H’MR only in the lower part of
257 the distribution (quantile 0.25)(Table 4).
258
259 Discussion
260 In this study, a large data set of 196 values of Shannon diversity index, calculated from data of
261 enzyme activities and CLPP-MicroResp techniques, was used. Griffiths et al. (2016) recently
262 included both techniques in a list of 18 potential, powerful indicators aimed to monitor soil
263 biodiversity and ecosystem function across Europe.
264 The first aim of this paper was to assess the relative sensitivity of each methodological approach in
265 capturing differences among the land use categories when different levels of pH and TOC are
266 considered.
267 The Kruskal-Wallis test showed that CLPP-MicroResp was a more powerful technique than enzyme
268 activities in highlighting differences among land use categories. Remarkably, while enzyme activities
269 were effective only within a certain range of TOC and pH values (<1.5-3%> and <6.5-7.4>,
270 respectively), MicroResp was able to discriminate soils along the whole range of TOC and pH
271 values, thus representing an effective tool for evaluating microbial functional diversity changes.This
273 various land-uses are usually related to differences in organic C pools (Degens et al., 2000).
274 Moreover, similar results were found by Creamer et al. (2009) reporting that the MSIR (multi
275 substrate induced respiration) technique resulted in a much more distinct and relatively consistent
276 pattern of separation between the tested soils with respect to enzyme activities.
277 However, in relation to the lack of significant response of EA to pH variations we should keep in
278 mind that enzymes determination requires NaAc buffer pH 5.5 as standardized in the protocol
279 proposed by Marx et al. (2001). It is thus possible that the lower discriminant capacity of enzyme
280 activities across a wide range of pH values may be ascribable to this methodological constraint.
281 Nevertheless, since also TOC values did not affect significantly H’EA, except in the range
<1.5-282 3.0%>, we can conclude that MicroResp showed a higher discrimination capacity among soil uses
283 and managements.
284 In this study, no correlation was found between H’EA and H’MR over all the data collected.
285 However, when looking at the correlation between H’EA and H’MR within the three categories of
286 soils (A, F and EC) a weak relationship (significant at 10% level) emerges only in arable soils. We
287 cannot exclude that this is due to the fact that agricultural soils features mainly fall within the
288 intermediate range of pH and TOC values where both methods are sensitive.
289 The general lack of correlation between enzymes and CLPP-MicroResp confirmed that the two
290 techniques assess different steps of decomposition processes. Enzymatic hydrolysis focuses on the
291 breakdown of complex organic polymers, which not necessarily leads to the complete mineralization
292 of substrates but can also lead to anabolic pathways for biosynthetic processes, polymerization,
293 condensation (i.e. humification, interaction with mineral colloids). Conversely, CLPP-MicroResp
294 measures the complete mineralization of simple and complex organic compounds to CO2, which
295 represents the final step of decomposition process. Therefore, in our opinion, a comprehensive
296 assessment of microbial functional diversity can be provided by the integration of both techniques.
297 For this reason, they can be considered complementary components of microbial functional diversity
298 providing a different ecological significance. In particular, in a comparison within soils we might
Commented [8]: New sentence has been added
299 suppose that if H’EA:H’MR ratio decreases, the diversity of soil functions is completely oriented
300 towards mineralization of organic matter. In this case, it can be evidenced a dissipating energy
301 system; however this last hypothesis, aimed to assign a different ecological significance to the two
302 methods, needs to be further deepened and confirmed. Regarding the ecological significance of
303 increased catabolic diversity due to land use, it might be also supposed an amplified resistance of
304 microbial communities to stress or disturbance (Degens et al. 2001). Moreover, to further explain the
305 lack of correlation between the two methods, we should keep in mind that soil enzymes include the
306 contribution, considerable in most cases, of the immobilized fraction (humus-clay bound enzymes)
307 (Nannipieri et al. 2012). This fraction is considered a permanent bio-catalytic property of the soil, not
308 necessarily linked to the living biomass. Immobilized enzymes may represent soils background
309 hydrolytic potential, established and stabilized during time, and representing their resilient capacity
310 (Ceccanti et al. 2008). To date, no methods are available to distinguish between the extracellular
311 activity of stabilized enzymes from that of enzymes associated with active cells. Such separation is
312 important because only enzymes associated with active cells contribute to microbial activity. The
313 stabilized extracellular fraction is no more related to microbial metabolism and can persist in soil
314 under unfavourable conditions for soil microorganisms (Nannipieri et al. 2012).
315 Therefore, enzyme activities, and the functional diversity measures derived from using this
316 methodology, inform on the general soil biological functioning including not only the actual living
317 microbial activity but also the past biochemical activity still operating within soil matrix. Conversely,
318 CLPP-MicroResp has been considered a direct measurement of microbial communities’ catabolic
319 profile providing an instant photograph of microbial physiology (Lagomarsino et al. 2007).
320 The QRM helped to understand if, and to what extent, the role of selected covariates (relevant soil
321 properties such as TOC and pH) change throughout the entire distribution of each dependent variable
322 (H’EA and H’MR). The QRM showed that both diversity indexes depended more on soil pH than on
323 total organic carbon content indicating soil reaction as the property mostly affecting microbial
324 diversity (Zahlnina et al. 2014).
325 Microbial functional diversity expresses the capacity of microbial community to perform different
326 processes and to metabolize diverse substrates. Soil pH variations can induce, more than the mere
327 TOC content, significant changes within microbial biomass structure in terms of species and related
328 functional patterns. Microbial biochemical processes are strictly dependent on pH values that control
329 the majority of the reactions occurring in the soil. Fierer et al. (2006) and Lemanceau et al. (2015)
330 reported soil pH as the best predictor of microbial diversity and richness affecting consequently
331 microbial functions. However, the nature of this relationship is controversial. Griffiths et al. (2011)
332 report that no decline in diversity was observed at increasing pH in a spatial assessment of soil
333 bacterial community profiles across Great Britain. Fierer at et al. (2006), in a similar study performed
334 across North and South America, showed a unimodal distribution of bacterial diversity, reaching
335 possibly a plateau at near neutral pH.
336
337 CONCLUSIONS AND FUTURE PERSPECTIVES
338 This study proved that CLPP-MicroResp technique provided a higher discrimination capacity, if
339 compared to enzyme activities, as an ecological indicator to assess soil microbial functional diversity.
340 In relation to soil chemical properties, pH was more relevant than TOC content in differentiating
341 processes carried out by microorganisms. The diversity indexes obtained by the two methods, EA
342 and MR, were not correlated; we hypothesize that they target complementary components of
343 microbial functional diversity. This study could be improved in the future with the aim to verify if the
344 two methodological approaches provide a different ecological significance informing on the extent of
345 dissipating energy pathways in the soil system.
346
347 Acknowledgements
348 The authors wish to thank the following projects that funded the research: Italian Ministry of
349 University and Research MIUR, Research Projects of National Interest PRIN 2008
(20082FC352-350 002) and 2010 (2010JBNLJ7-006).
Commented [11]: New sentence has been added
References
Adhikari, K., Hartemink, A.E., 2016. Linking soils to ecosystem services — A global review, Geoderma 262, 101–111.
Anderson, T.H., Domsch, K.H., 2010. Soil microbial biomass, The eco-physiological approach. Soil Biol. Biochem. 42, 2039-2043.
Bardgett, R.D. and van der Putten, W.H., 2014. Belowground biodiversity and ecosystem functioning. Nature 515, 505-511.
Bending, G.D., Turner, M.K., Jones, J.E. 2004. Interactions between crop residue and soil organic matter quality and the functional diversity of soil microbial communities. Soil Biol. Biochem. 34, 1073–1082.
Brunetti, P. 2014. Organic mulching impacts on vegetable crop production. Environmental Sciences PhD Thesis, University of Tuscia.
Cameron, A.C., Trivedi, P.K. 2005. Microeconometrics, methods and applications. Cambridge University Press.
Campbell, C.D., Chapman, S.J., Cameron, C.M., Davidson, M., Potts, J.M. 2003. A rapid microtiter plate method to measure carbon dioxide evolved from carbon substrate amendments so as to determine the physiological profiles of soil microbial communities by using whole soil. Appl. Environ. Microbiol. 69, 3593–3599.
Ceccanti, B., Doni, S., Macci, C., Cercignani, G., Masciandaro, G. 2008. Characterization of stable humic–enzyme complexes of different soil ecosystems through analytical isoelectric focussing technique IEF). Soil Biol. Biochem. 40 (9), 2174–2177
Chapman, S.J., Campbell, C.D., Artz, R.R.E., 2007. Assessing CLPPs using MicroRespTM. A comparison with Biolog and multi-SIR. J. Soils Sed. 7, 406–410.
Constancias, F., Saby, N.P., Horrigue, W., Villerd, J., Guillemin, J.P., Duval, L.B., Nowak, V., Dequiedt, S., Ranjard, L., Chemidlin Prevost-Bour, N. 2015. Mapping and determinism of soil
Commented [13]: New references have been added: Creamer et al. 2016b;
Lagomarsino et al. 2011 Burns and Dick 2011 Spellerberg and Fedor 2003
microbial community distribution across an agricultural landscape. Microbiology Open 4 (3), 505– 517. doi: 10.1002/mbo3.255.
Creamer, R.E., Bellamy, P., Black, H.I., Cameron, C.M., Campbell, C.D., Chamberlain, P., Ritz, K., 2009. An inter-laboratory comparison of multi-enzyme and multiple substrate-induced respiration assays to assess method consistency in soil monitoring. Biol. Fertil. Soils 45 (6), 623–633.
Creamer, R.E., Stone, D., Berry, P., Kuiper, I. 2016. Measuring respiration profiles of soil microbial communities across Europe using MicroRespTM method. Appl. Soil Ecol. 97, 36–43.
Degens, B.P., Schipper, L.A., Sparling, G.P., Vukovic, M.V. 2000. Decreases in organic C reserves in soils can reduce the catabolic diversity of soil microbial communities. Soil Biol. Biochem. 32, 189-196.
Degens, B.P., Schipper, L.A., Sparling, G.P., Duncan, L.C. 2001. Is the microbial community in a soil with reduced catabolic diversity less resistant to stress or disturbance? Soil Biol. Biochem. 33, 1143-1153.
Delgado-Baquerizo, M., Maestre, F.T., Reich, P.B., Jeffries, T.C., Gaitan, J.J., Encinar, D., Berdugo, M., Campbell, C.D., Singh, B.K. 2016. Microbial diversity drives multifunctionality in terrestrial ecosystems. Nature Communications 7, 10541 DOI: 10.1038/ncomms10541.
Dumontet, S., Mazzatura, A., Casucci, C., Perucci, P. 2001. Effectiveness of microbial indexes in discriminating interactive effects of tillage and crop rotations in a Vertic Ustorthent. Biol. Fertil. Soils 34, 411-417.
Emili, L. 2013. Soil Bioremediation Assessment In Heavy Metal Polluted Areas, ISBN 978-3-639-62738-1 EAI (Edizioni Accademiche Italiane), OmniScriptum GmbH & Co.KG Saarbrücken, Germania).
Emmerling, C., Schloter, M., Hartmann, A., Kandeler, E. 2002. Functional diversity of soil organisms a review of recent research activities in Germany. J. Plant Nutr. Soil Sci. 165, 408–420. Fierer, N. and Jackson, R.B. 2006. The diversity and biogeography of soil bacterial communities PNAS 103 (3), 626–631. doi10.10730507535103.
Garland, J.L., Mills, A.L. 1991. Classification and characterization of heterotrophic microbial communities on the basis of patterns of community-level sole-carbon- source utilization. Appl. Environ. Microbiol. 57, 2351–2359.
Griffiths, R.I., Thomson, B.C., James, P., Bell, T., Bailey, M. and Whiteley, A.S. 2011. The bacterial biogeography of British soils. Environ. Microbiol. 13(6), 1642–1654. doi:10.1111/j.1462-2920.2011.02480.x
Griffiths, B.S., Römbke, J., Schmelz, R.M., Scheffczyk, A., Faber, J.H., Bloem, J., Pérès, G., Cluzeau, D., Chabbi, A., Suhadolc, M., Sousa, J.P., Martins da Silva, P., Carvalho, F., Mendes, S., Morais P, Francisco R, Pereira C, Bonkowski M, Geisen S, Bardgett RD, de Vries FT, Bolger T, Dirilgen, T., Schmidt, O., Winding, A., Hendriksen, N.B., Johansen, A., Philippot, L., Plassart, P., Bru, D., Thomson, B., Griffiths, R.I., Bailey, M.J., Keith, A., Rutgers, M., Mulder, C., Hannula, S.E., Creamer, R., Stone, D. 2016. Selecting cost effective and policy-relevant biological indicators for European monitoring of soil biodiversity and ecosystem function, Ecol. Ind. 69, 213–223.
Hendriksen, N.B., Creamer, R.E., Stone, D., Winding, A. 2016. Soil exo-enzyme activities across Europe -The influence of climate, land-use and soil properties. Appl. Soil Ecol. 97, 44–48 .
Insam, H., Parkinson, D., Domsch, K.H., 1989. Influence of macroclimate on soil microbial biomass. Soil Biol. Biochem. 21, 211–221.
Kennedy, A.C., Smith, K.L. 1995. Soil microbial diversity and the sustainability of agricultural soils. Plant Soil 170, 75–86.
Koenker, R. 2005. Quantile Regression. Cambridge University Press, New York. Koenker, R., Bassett, Jr. G. 1978. Regression quantiles. Econometrica 46 (1), 33-50.
Lagomarsino, A., Knapp, B.A., Moscatelli, M.C., De Angelis, P., Grego, S., Insam, H. 2007. Structural and functional diversity of soil microbes is affected by elevated CO2 and N addition in a
Lemanceau, P., Maron, P.A., Mazurier, S., Mougel, C., Pivato, B., Plassart, P., Ranjard, L., Revellin, C., Tardy, V., Wipf, D. 2015. Understanding and managing soil biodiversity: a major challenge in agroecology. Agron. Sustain. Dev. 35, 67–81. doi 10.1007/s13593-014-0247-0
Li, Z., Wu, X., Chen, B. 2007. Changes in transformation of soil organic C and functional diversity of soil microbial community under different land uses. Agric. Sci. China 6 (10), 1235–1245
Marinari, S., Bonifacio, E., Moscatelli, M.C., Falsone, G., Vittori Antisari, L., Vianello, G. 2013. Soil development and microbial functional diversity: Proposal for a methodological approach. Geoderma 192, 437-445
Marx, M.C., Wood, M., Jarvis, S.C. 2001. A microplate fluorimetric assay for the study of enzyme diversity in soils. Soil Biol. Biochem. 33, 1633–1640.
Nannipieri, P., Ascher, J., Ceccherini, M.T., Landi, L., Pietramellara, G.P., Renella, G. 2003. Microbial diversity and soil functions. Eur. J. Soil Sc. 54, 655–670.
Nannipieri, P., Giagnoni, L., Renella, G., Puglisi, E., Ceccanti, B., Masciandaro, G., Fornasier, F., Moscatelli, M.C., Marinari, S. 2012. Soil enzymology: classical and molecular approaches Biol. Fertil. Soils 48, 743–762. doi 10.1007/s00374-012-0723-0
Papp, R., 2016. Soil indicators set up to assess sustainable management in various agricultural and forest ecosystems. Pedology. PhD thesis. University of Tuscia.
Papp, R., Antisari, L.V., Vianello, G., Marabottini, R., Marinari, S. 2015. Soil microbial activity in hydromorphic-subaqueous ecosystems: processes and functional diversity, EQA – Environmental quality /Qualité de l’Environnement /Qualità ambientale 18, 11-19.
Pereira Silva, M.C., Semenov, A.V., Schmitt, H., van Elsas, J.D., Falcão Salles, J. 2013. Microbe-mediated processes as indicators to establish the normal operating range of soil functioning, Soil Biol. Biochem. 57, 995-1002.
Pignataro, A., Moscatelli, M.C., Mocali, S., Napoli, R., Grego, S., Benedetti, A. 2011. Preliminary investigation on soil microbial diversity: effect of pedogenetic substrate, EQA – Environmental
quality /Qualité de l’Environnement /Qualità ambientale 7, 49-57. ISBN 978-88-906735-9-7, ISSN 2039-9898.
Pignataro, A., Moscatelli, M.C., Mocali, S., Grego, S., Benedetti, A. 2012. Assessment of soil microbial functional diversity in a coppiced forest system. Appl. Soil Ecol. 62, 115-123.
Rodríguez-Loinaz, G., Onaindi, M., Amezaga, I., Mijangos, I., Garbis, C. 2008. Relationship between vegetation diversity and soil functional diversity in native mixed-oak forests. Soil Biol. Biochem. 40, 49-60.
Rutgers, M., Wouterse, M., Drost, S.M., Breure, A.M., Mulder, C., Stone, D., Creamer, R.E., Winding, A., Bloem, J. 2016. Monitoring soil bacteria with community-level physiological profiles using Biolog™ ECO-plates in the Netherlands and Europe. Appl. Soil Ecol. 97, 23–35.
Shannon, C.E. and Weaver, W. 1949. The Mathematical Theory of Communication. Urbana, IL, University of Illinois Press.
Stazi, S.R., Moscatelli, M.C., Papp, R., Crognale, S., Grego, S., Martin, M., Marabottini, R. 2017. A multi-biological assay approach to assess microbial diversity in arsenic (As). contaminated soils. Geomicrobiol. 34 (2), 183-192. DOI:10.1080/01490451.2016.1189015.
Wellington, E.M.H., Berry, A., Krsek, M. 2003. Resolving functional diversity in relation to microbial community structure in soil, exploiting genomics and stable isotope probing. Current Opinion Microbiol. 6 (3) 295–301.
Wittmann, C., Kahkonen, M.A., Ilvesniemi, H., Kurola, J., Salkinoja-Salonen, M.S. 2004. Areal activities and stratification of hydrolytic enzymes involved in the biochemical cycles of carbon, nitrogen, sulphur and phosphorus in podsolized boreal forest soils. Soil Biol. Biochem. 36, 425–433. Zak, J.C., Willig, M.R., Moorhead, D.L., Wildman, H.D. 1994. Functional diversity of microbial communities: a quantitative approach. Soil Biol. Biochem. 26, 1101–1108.
Zhalnina, K., Dias, R., de Quadros, P.D., Davis-Richardson, A., Camargo, F.A.O., Clark, I.M., McGrath, S., Hirsch, P.R., Triplett, E.W. 2014. Soil pH determines microbial diversity and composition in the park grass experiment. Microb. Ecol. 69 (2), 395-406.
Highlights
Enzymes and MicroResp as reliable indicators to assess microbial functional diversity No correlation was found between the enzyme and MicroResp diversity indexes The two methods target complementary components of microbial functional diversity Both methods were effective to show differences among various land use categories Quantile regression model allowed analysis along the distribution diversity indexes
1
1 ASSESSMENT OF SOIL MICROBIAL FUNCTIONAL DIVERSITY: LAND USE AND
2 SOIL PROPERTIES AFFECT CLPP-MICRORESP AND ENZYMES RESPONSES
3
4 Moscatelli M.C.1, Secondi L. 1, Marabottini R. 1, Papp R. 1, Stazi S.R. 1, Mania E.2, Marinari S.* 1
5 1Dept. for Innovation in Biological, Agrofood and Forest systems (DIBAF), University of Tuscia, 6 Viterbo, Italy
7 2Department of Agricultural and Forest Sciences (DISAFA), University of Torino, Torino, Italy 8
9
10 *corresponding author [email protected], tel. 0039-(0)761-357288
11 12
13 Keywords: microbial processes, Shannon index, Soil properties. 1 2 3 4 5 6 7 8 9 10 11 12 13 14 15 16 17 18 19 20 21 22 23 24 25 26 27 28 29 30 31 32 33 34 35 36 37 38 39 40 41 42 43 44 45 46 47 48 49 50 51 52 53 54 55 56 57 58 59