Open Access
Research article
Ab initio identification of putative human transcription factor
binding sites by comparative genomics
D Corà
1, C Herrmann
2, C Dieterich
3, F Di Cunto
4, P Provero
4and
M Caselle*
1Address: 1Dipartimento di Fisica Teorica dell'Università degli Studi di Torino and INFN, Via P. Giuria 1 – I 10125 Torino, Italy, 2LGPD-IBDM, Université de la Méditerranée / CNRS, Campus de Luminy Case 907 – F-13288 Marseille Cedex 9, France, 3Max-Planck-Institute for Molecular Genetics, Ihnestrasse 73 – D-14195 Berlin, Germany and 4Dipartimento di Genetica, Biologia e Biochimica dell'Università di Torino, Via Santena 5 bis – I-10126 Torino, Italy
Email: D Corà - [email protected]; C Herrmann - [email protected]; C Dieterich - [email protected]; F Di Cunto - [email protected]; P Provero - [email protected]; M Caselle* - [email protected]
* Corresponding author
Abstract
Background: Understanding transcriptional regulation of gene expression is one of the greatest
challenges of modern molecular biology. A central role in this mechanism is played by transcription factors, which typically bind to specific, short DNA sequence motifs usually located in the upstream region of the regulated genes. We discuss here a simple and powerful approach for the ab initio identification of these cis-regulatory motifs. The method we present integrates several elements: human-mouse comparison, statistical analysis of genomic sequences and the concept of coregulation. We apply it to a complete scan of the human genome.
Results: By using the catalogue of conserved upstream sequences collected in the CORG database
we construct sets of genes sharing the same overrepresented motif (short DNA sequence) in their upstream regions both in human and in mouse. We perform this construction for all possible motifs from 5 to 8 nucleotides in length and then filter the resulting sets looking for two types of evidence of coregulation: first, we analyze the Gene Ontology annotation of the genes in the set, searching for statistically significant common annotations; second, we analyze the expression profiles of the genes in the set as measured by microarray experiments, searching for evidence of coexpression. The sets which pass one or both filters are conjectured to contain a significant fraction of coregulated genes, and the upstream motifs characterizing the sets are thus good candidates to be the binding sites of the TF's involved in such regulation.
In this way we find various known motifs and also some new candidate binding sites.
Conclusion: We have discussed a new integrated algorithm for the "ab initio" identification of
transcription factor binding sites in the human genome. The method is based on three ingredients: comparative genomics, overrepresentation, different types of coregulation. The method is applied to a full-scan of the human genome, giving satisfactory results.
Published: 02 May 2005
BMC Bioinformatics 2005, 6:110 doi:10.1186/1471-2105-6-110
Received: 02 December 2004 Accepted: 02 May 2005 This article is available from: http://www.biomedcentral.com/1471-2105/6/110
© 2005 Corà et al; licensee BioMed Central Ltd.
This is an Open Access article distributed under the terms of the Creative Commons Attribution License (http://creativecommons.org/licenses/by/2.0), which permits unrestricted use, distribution, and reproduction in any medium, provided the original work is properly cited.
Background
Understanding transcriptional regulation of gene expres-sion is one of the greatest challenges of modern molecular biology. A central role in this mechanism is played by transcription factors (TF), which typically bind to specific, short DNA sequence motifs. These motifs are usually located in the upstream region of the regulated genes, although it is possible to find them also in the introns and in the 3' downstream region. They are often overrepre-sented, and appear in multiple copies inside the regula-tory regions to form modules of cooperating items.
In these last years, the study of gene regulation has under-gone a deep change of perspective [1,2]. While past stud-ies usually dealt with individual regulatory interactions, it has become by now clear that the only way to understand the regulatory activity of the genome is to directly address the complex, combinatorial nature of the whole ensemble of TFs.
The identification of the cis-binding sequences and of the related TF's is a mandatory preliminary step toward this goal.
To this end it is becoming more and more important to construct tools able to
- address the problem on a genome wide scale
- keep under control the number of false positives to avoid an excessive increase of the noise to signal ratio
- use as input the statistical properties of the DNA sequences, thus avoiding, as far as possible, any other a priori assumption on the binding motifs.
However, the study cannot be based exclusively on the sta-tistical features of the DNA regions presumably involved in transcriptional regulation, but must be complemented with independent information about gene regulation. In this respect three important sources of information may be used: the functional annotations collected in public databases, gene expression data on a global scale, and the so called 'phylogenetic footprinting' [3].
In fact large functional annotation databases and large-scale expression data provide a wealth of information about coregulation. This is a crucial point, since colated genes are likely to share similar transcriptional regu-latory mechanisms. At the same time in these last years a growing interest has been attracted by the 'phylogenetic footprinting', i.e. the idea that functional sequences are preferentially conserved over the course of evolution by selective pressure. Comparison of orthologous gene sequences has been for a long time a standard tool in
genomic analysis. Recently this comparative approach has been extended also to non coding regions, thanks to the progress of the sequencing programs. It is by now accepted that these non-coding conserved regions have an important regulatory role [4-9].
Several computational method have been proposed in the last few years to identify TF binding sites. These can be classified into two separate groups: enumerative methods, including the one we will present in this paper, explore all possible motifs up to a certain length (see for example [10-17]). The other large group consists of local search algorithms, including expectation maximization and var-ious flavours of Gibbs sampling (see e.g. [18-21]).
We discuss here a simple and powerful approach for the identification of cis-regulatory motifs which fulfils the above requirements. It can be tuned to keep the number of false positives under control, and it allows us to study the transcriptional regulation of more than 10,000 genes of the human genome (which is a good approximation of a genome wide scale). The method is based on an "ab ini-tio" study of the statistical properties of the regulatory sequences of the genes of interest. Together with the dis-cussion of the method itself, we apply it to a full-genome analysis of the human case.
In particular in this paper, as a first step, we concentrated on the upstream sequences of the human genome (to be defined more precisely below), while we plan to extend these same tools to the downstream and intron regions in the future.
Results and Discussion
Our proposed approach is based on three main ingredients:
(1) human-mouse genomic comparison
(2) statistical analysis of "motifs" (short DNA sequences) that are overrepresented in evolutionarily conserved regions upstream of orthologous genes
(3) two complementary "filters" to infer coregulation: the distribution of Gene Ontology annotation terms and the results of a set of microarray experiments
The approach based on steps (2) and (3) above was suc-cessfully applied to the search for regulatory binding sites in yeast [14,15]. The human-mouse genetic comparison is crucial in extending the method to higher eukaryotes, since it is expected to greatly improve the signal/noise ratio by selecting for analysis those portions of the upstream regions that are more likely to be functionally relevant. Other algorithms taking advantage of
phylogenetic footprinting to detect transcription factor binding sites have been published in [22,23].
As a final result of our analysis we obtain a set of motifs which survive one or both of the above filters, which we consider as our candidate binding sequences. The final step is then to cluster together these words to obtain con-sensus binding site sequences. This step allows, at the end of the whole process, to recover the intrinsic variability or regulatory motifs, that we know to be one of the most important features of binding sequences in higher eukaryotes.
Flow-chart of the algorithm
Figure 1
Flow-chart of the algorithm
CORG
whole upstream sequences of the human genome whole
upstream sequences of the mouse genome
collection of NCBs in human upstream regions of man-mouse orthologous genes construction of sets of genes
sets of human genes based on overrepresentation of upstream motifs Gene Ontology filter Microarray filter
putative TF binding sites consensus
groups of motifs of 5,6,7,8 nucleotides
building consensus
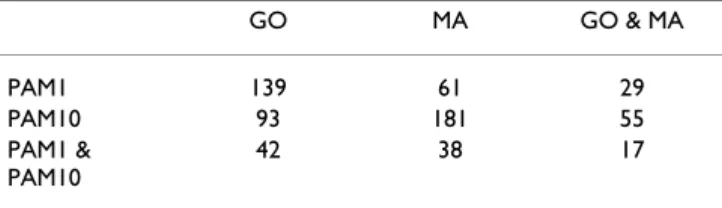
Table 1: Number of significant motifs found with the four scoring matrix/filter combinations and their intersection. The third line contains the number of motif identified using both the PAM1 and PAM10 scoring system. The third column shows the number of motif identified by both the Gene Ontology and the microarray filter. GO MA GO & MA PAM1 139 61 29 PAM10 93 181 55 PAM1 & PAM10 42 38 17
A flow-chart of our algorithm is depicted in Figure 1.
The total number of motifs analyzed, after identifying each motif with its reverse complement and disregarding the self-overlapping ones, was 40,484. With the false dis-covery rate set at 10%, 373 of these turned out to be sig-nificant with at least one choice of scoring matrix (PAM1 or PAM10) and filter (Gene Ontology or microarray). 105
different Gene Ontology terms were involved, and 57 microarray time-points.
All the significant associations between motifs and Gene Ontology terms and microarray time points, for both scor-ing systems, are reported in Supplementary Table 1 [see Additional file 1 suptab1.txt]. The total number of such associations is 800, meaning that each motif was found,
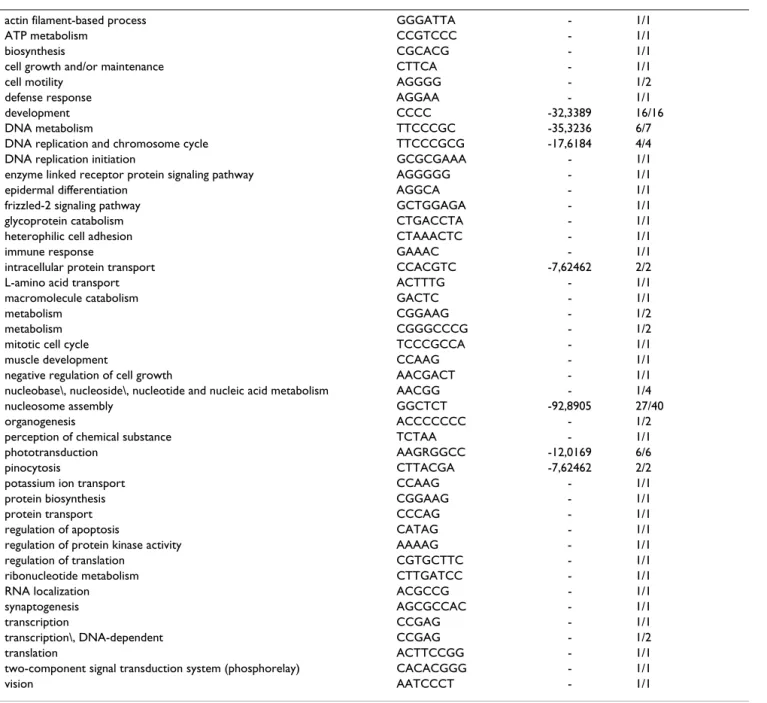
Table 2: Consensus binding sites corresponding to GO terms in the biological process branch of the Gene Ontology. For each GO term we display either the consensus sequence obtained from wconsensus, or the longest motif associated to the term if the consensus sequence was not significant enough as defined in the text. The third column is the logarithm of the expected frequency of the alignment as given by wconsensus, if exists. The fourth column contains the number A of motifs which were used in the alignment and the total number B of motifs associated to the term in the format A/B. For this table the data obtained with PAM1 and PAM10 are considered together.
actin filament-based process GGGATTA - 1/1 ATP metabolism CCGTCCC - 1/1 biosynthesis CGCACG - 1/1 cell growth and/or maintenance CTTCA - 1/1 cell motility AGGGG - 1/2 defense response AGGAA - 1/1 development CCCC -32,3389 16/16 DNA metabolism TTCCCGC -35,3236 6/7 DNA replication and chromosome cycle TTCCCGCG -17,6184 4/4 DNA replication initiation GCGCGAAA - 1/1 enzyme linked receptor protein signaling pathway AGGGGG - 1/1 epidermal differentiation AGGCA - 1/1 frizzled-2 signaling pathway GCTGGAGA - 1/1 glycoprotein catabolism CTGACCTA - 1/1 heterophilic cell adhesion CTAAACTC - 1/1 immune response GAAAC - 1/1 intracellular protein transport CCACGTC -7,62462 2/2 L-amino acid transport ACTTTG - 1/1 macromolecule catabolism GACTC - 1/1 metabolism CGGAAG - 1/2 metabolism CGGGCCCG - 1/2 mitotic cell cycle TCCCGCCA - 1/1 muscle development CCAAG - 1/1 negative regulation of cell growth AACGACT - 1/1 nucleobase\, nucleoside\, nucleotide and nucleic acid metabolism AACGG - 1/4 nucleosome assembly GGCTCT -92,8905 27/40 organogenesis ACCCCCCC - 1/2 perception of chemical substance TCTAA - 1/1 phototransduction AAGRGGCC -12,0169 6/6 pinocytosis CTTACGA -7,62462 2/2 potassium ion transport CCAAG - 1/1 protein biosynthesis CGGAAG - 1/1 protein transport CCCAG - 1/1 regulation of apoptosis CATAG - 1/1 regulation of protein kinase activity AAAAG - 1/1 regulation of translation CGTGCTTC - 1/1 ribonucleotide metabolism CTTGATCC - 1/1 RNA localization ACGCCG - 1/1 synaptogenesis AGCGCCAC - 1/1 transcription CCGAG - 1/1 transcription\, DNA-dependent CCGAG - 1/2 translation ACTTCCGG - 1/1 two-component signal transduction system (phosphorelay) CACACGGG - 1/1 vision AATCCCT - 1/1
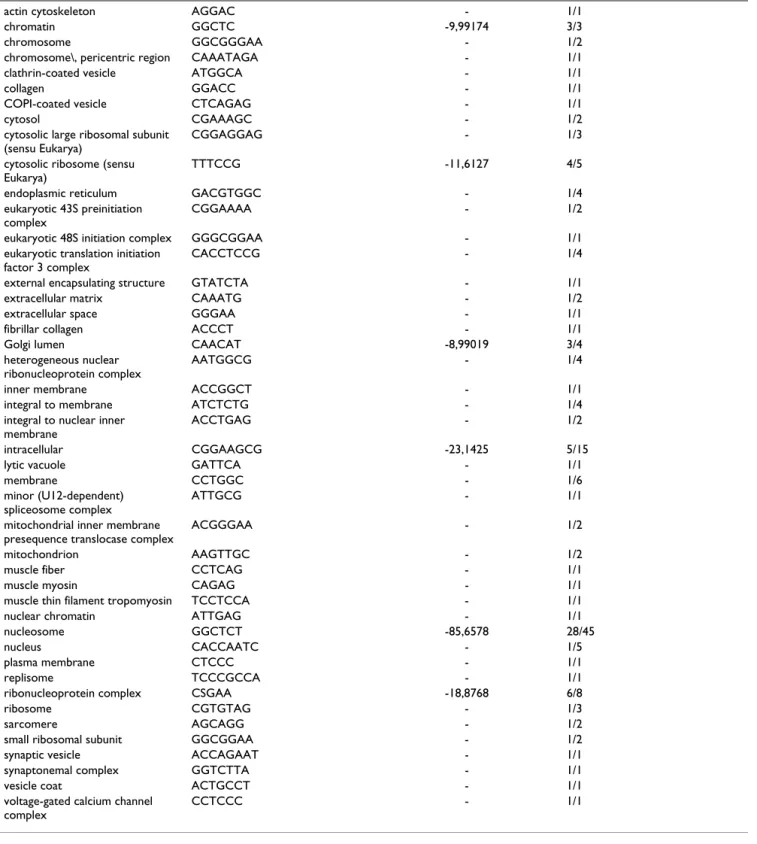
Table 3: Consensus binding sites corresponding to GO terms in the cellular component branch of the Gene Ontology. For each GO term we display either the consensus sequence obtained from wconsensus, or the longest motif associated to the term if the consensus sequence was not significant enough as defined in the text. The third column is the logarithm of the expected frequency of the alignment as given by wconsensus, if exists. The fourth column contains the number A of motifs which were used in the alignment and the total number B of motifs associated to the term in the format A/B. For this table the data obtained with PAM1 and PAM10 are considered together.
actin cytoskeleton AGGAC - 1/1 chromatin GGCTC -9,99174 3/3 chromosome GGCGGGAA - 1/2 chromosome\, pericentric region CAAATAGA - 1/1 clathrin-coated vesicle ATGGCA - 1/1 collagen GGACC - 1/1 COPI-coated vesicle CTCAGAG - 1/1 cytosol CGAAAGC - 1/2 cytosolic large ribosomal subunit
(sensu Eukarya)
CGGAGGAG - 1/3 cytosolic ribosome (sensu
Eukarya)
TTTCCG -11,6127 4/5 endoplasmic reticulum GACGTGGC - 1/4 eukaryotic 43S preinitiation
complex
CGGAAAA - 1/2 eukaryotic 48S initiation complex GGGCGGAA - 1/1 eukaryotic translation initiation
factor 3 complex
CACCTCCG - 1/4 external encapsulating structure GTATCTA - 1/1 extracellular matrix CAAATG - 1/2 extracellular space GGGAA - 1/1 fibrillar collagen ACCCT - 1/1 Golgi lumen CAACAT -8,99019 3/4 heterogeneous nuclear
ribonucleoprotein complex
AATGGCG - 1/4 inner membrane ACCGGCT - 1/1 integral to membrane ATCTCTG - 1/4 integral to nuclear inner
membrane
ACCTGAG - 1/2 intracellular CGGAAGCG -23,1425 5/15 lytic vacuole GATTCA - 1/1 membrane CCTGGC - 1/6 minor (U12-dependent)
spliceosome complex
ATTGCG - 1/1 mitochondrial inner membrane
presequence translocase complex
ACGGGAA - 1/2 mitochondrion AAGTTGC - 1/2 muscle fiber CCTCAG - 1/1 muscle myosin CAGAG - 1/1 muscle thin filament tropomyosin TCCTCCA - 1/1 nuclear chromatin ATTGAG - 1/1 nucleosome GGCTCT -85,6578 28/45 nucleus CACCAATC - 1/5 plasma membrane CTCCC - 1/1 replisome TCCCGCCA - 1/1 ribonucleoprotein complex CSGAA -18,8768 6/8 ribosome CGTGTAG - 1/3 sarcomere AGCAGG - 1/2 small ribosomal subunit GGCGGAA - 1/2 synaptic vesicle ACCAGAAT - 1/1 synaptonemal complex GGTCTTA - 1/1 vesicle coat ACTGCCT - 1/1 voltage-gated calcium channel
complex
on average, about twice. Even if the various filters and scoring methods cannot be considered independent of each other, this fact is certainly encouraging in terms of the robustness of the method. These results are summa-rized in Tab. 1.
While the high degree of superposition between the results found with different choices is a clear indication of the robustness of our approach, the lists obtained are still significantly different: therefore the use of different filters/ scoring matrices is useful in expanding the range of regu-latory interactions explored by the algorithm.
In the supplementary table 2 we also provide the lists of the genes included in the sets found significant by one or more filter [see Additional file 2].
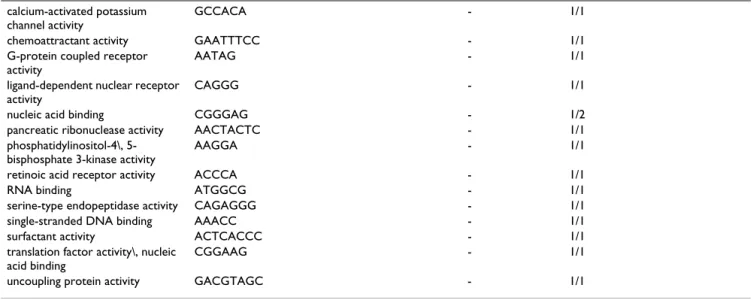
Not surprisingly, in many instances several motifs, often very similar to each other, are associated to the same GO term or microarray timepoint. For all Gene Ontology terms and microarray point associated to one or more motifs, we constructed, when possible, a consensus bind-ing sequence from the motifs associated to the term as explained in the Materials and Methods section. The results are presented in Tab. 2, 3, 4, for the three branches of the Gene Ontology and in Tab. 5 for microarray time-points. For the latter, the consensus obtained is reported only when its length is at least 4. In many cases, in fact, the large number of motifs significantly associated to a micro-array time-point causes the clustering algorithm to pro-duce very short and rather uninformative consensus sequences. These results were produced by considering the PAM1 and PAM10 results together.
Table 4: Consensus binding sites corresponding to GO terms in the molecular function branch of the Gene Ontology. For each GO term we display either the consensus sequence obtained from wconsensus, or the longest motif associated to the term if the consensus sequence was not significant enough as defined in the text. The third column is the logarithm of the expected frequency of the alignment as given by wconsensus, if exists. The fourth column contains the number A of motifs which were used in the alignment and the total number B of motifs associated to the term in the format A/B. For this table the data obtained with PAM1 and PAM10 are considered together.
calcium-activated potassium channel activity
GCCACA - 1/1 chemoattractant activity GAATTTCC - 1/1 G-protein coupled receptor
activity
AATAG - 1/1
ligand-dependent nuclear receptor activity
CAGGG - 1/1
nucleic acid binding CGGGAG - 1/2 pancreatic ribonuclease activity AACTACTC - 1/1 phosphatidylinositol-4\,
5-bisphosphate 3-kinase activity
AAGGA - 1/1
retinoic acid receptor activity ACCCA - 1/1 RNA binding ATGGCG - 1/1 serine-type endopeptidase activity CAGAGGG - 1/1 single-stranded DNA binding AAACC - 1/1 surfactant activity ACTCACCC - 1/1 translation factor activity\, nucleic
acid binding
CGGAAG - 1/1 uncoupling protein activity GACGTAGC - 1/1
Table 5: Consensus binding sites corresponding to microarray time-points. Only time-points for which the clustering algorithm produced a consensus sequence of length 4 or more are shown.
Timepoint consensus sequences used ln (expected freq.) t = 23 CTGG 4/7 -7,99646 t = 50 CCMCA 5/15 -9,71859 t = 61 SCCAGG 12/43 -18,6948 t = 89 CWGGG 17/23 -11,1386 t = 100 CCCWG 12/31 -12,5918 t = 107 CGGM 13/14 -14,7383
If our method is really able to identify genuine transcrip-tion factor binding sites, we would expect to find, among the surviving sets, at least some of the TF binding sites that are known to regulate the transcription of target genes through multiple occurrences in their promoters.
We focus here on some major examples.
E2Fs are transcription factors well known for their ability to regulate DNA replication by binding multiple sites in the promoters of the target genes [24]. Since the most abundant subpopulation of sets surviving the GO filter display a strong overrepresentation of DNA replication-related terms, it would be reasonable to expect that many of them are E2F binding sites. This was indeed the case, as the motifs TTGGCGC associated to many significant sets perfectly matched experimentally determined E2F bind-ing sites as well as the consensus sequence found in the TRANSFAC[25] database. Significantly, some of these words were identified not only by the GO filter, but also by the microarray filtering scheme, confirming that our method is very robust in identifying the binding sites of this particular transcription factor.
It is interesting to see whether these motifs are found in the conserved parts of the upstream regions of experimen-tally verified targets of regulation by E2F. From the TRANSFAC database we identified 8 such targets, 6 of which are included in the PAM1 version of the CORG database: CAV1, MYC, DHFR, E2F2, RBL1 and CDC6. In five cases at least one of the motifs we find matching the E2F consensus can be found in the conserved part of the upstream regions, and in four cases many instances of the motifs are found: we find a total of 33 occurrences in the upstream region of MYC, 14 for E2F2, 11 for RBL1 and 11 for CDC6. Only one occurrence is found for DHFR, and none for CAV1. Similar results are found using the PAM10 version of CORG.
By performing these analyses, we observed that motifs characterized by the annotations 'chromatin' and 'nucleo-some assembly', although obviously related to DNA replication, could not be reconciled with E2F binding sites, but included instead the motif AGAGCCTT and sev-eral similar ones. Since most of the annotated genes in the sets encoded for histone proteins, we speculated that these consensus could be part of a critical control element involved in the production of histones during DNA repli-cation. One of the best known such elements is an evolu-tionary conserved inverted repeat found in the 3' untranslated region of histone mRNAs, controlling their stability during the cell cycle [26]. Surprisingly, our con-sensus sequence matched this element, raising the prob-lem of how a 3' located regulatory eprob-lement could be identified by our method. The reason is that histone genes
form tight clusters in different chromosomal locations, and the distance between the initiator codon is in many cases below the 15000 bp limit used by our algorithm. Although of serendipitous nature, this result underscores two important points. The first is that our method is able to identify not only regular transcription factor binding sites, but also other less conventional regulatory elements characterized by a motif repetition. The second is that our approach could be systematically extended to other gene regions, such as the 3' untranslated and the introns.
The highly heterogeneous annotation associated to the sets surviving the GO filter strongly suggests that our method can potentially identify relevant binding sites for known and/or unknown transcription factors in the pro-moter of groups of genes involved in a wide variety of bio-logical processes, such as tissue and organelle-specific transcription.
For instance, we identified many sets significantly enriched for genes involved in muscle development and/ or functions (see Tab. 6). Interestingly, one of them (AGCAGG, associated to the term "sarcomere") is com-patible with the binding site of the well known muscular master genes MyoD and Myf5 [27] as represented by a mixture of the TRANSFAC matrices M00184 and M0001, while the others had no significant match in the TRANS-FAC database.
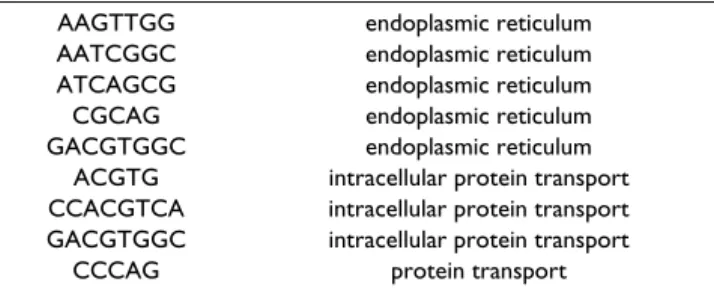
Another example are the different motifs associated with the annotations "endoplasmic reticulum", "protein trans-port" and "intracellular protein transtrans-port"(Tab. 7). Three
Table 6: Words associated to "muscle development" and related terms
AGCAGG sarcomere CCAAG sarcomere CCAAG muscle development TCCTCCA muscle thin filament tropomyosin
Table 7: Words associated to "endoplasmic reticulum", "protein transport" and "intracellular protein transport"
AAGTTGG endoplasmic reticulum AATCGGC endoplasmic reticulum ATCAGCG endoplasmic reticulum CGCAG endoplasmic reticulum GACGTGGC endoplasmic reticulum
ACGTG intracellular protein transport CCACGTCA intracellular protein transport GACGTGGC intracellular protein transport
of them (ACGTG, CCACGTCA and GACGTGGC) with known binding sites of ATF6 (TRANSFAC matrix M00483), a strongly conserved transcription factor involved in endoplasmic reticulum function [28]. The others don't show significant overlapping with TRANS-FAC, suggesting that they are new putative cis elements important for regulating ER genes.
It is important to notice that in some instances, even though no hypothesis on the precise transcription factor can be formulated, it is at least possible to conjecture the general structural class to which the TF belongs. For exam-ple, the word GGGGGGGT, associated with the annota-tion "organogenesis", is consistent with the binding sites of many zinc finger transcription factors, such as Zic1, Zic3 and MZF1 [29], thus suggesting that some of the genes in the set are transcriptional target for a member of this particular family of transcription factors.
It is interesting to investigate the distribution of the dis-tance of the motifs identified by our algorithm from the TSS of the corresponding gene. For all motifs found signif-icant and for all genes in which the motif is overrepre-sented we computed the distance between the locations in which the motif is found and the TSS of the gene. All these data are represented as a histogram in Fig. 2. The motifs are very obviously concentrated near the TSS. This fact suggests that the choice to cut at 15,000 bp the length of
the upstream regions considered is unlikely to decrease the signal significantly. The data shown are for PAM1, but the ones for PAM10 do not differ in any significant way.
Taken together, these results suggest that our approach has the potential to identify new critical regulatory elements for genes involved in a wide variety of biological processes.
Conclusion
We have discussed a new algorithm for the "ab initio" identification of transcription factor binding sites in the human genome. The method is based on three ingredients:
- the so called phylogenetic footprinting, i.e. the idea that functional sequences are preferentially conserved over the course of evolution by selective pressure.
- the overrepresentation criterion, i.e. the observation that binding sequences are usually overrepresented in the upstream region of the genes that are regulated by the cor-responding transcription factors.
- the coregulation test, i.e. the use of coregulation (detected by using GO categories or microarray data) as a criterion to select the true positive binding sequences
Experience with yeast [14,15] suggests that our method is characterized by a low rate of false positives but, presum-ably, a rather high number of false negatives. The reason for this is that the basic ingredients of our analysis are motifs defined as completely specified sequences. This requires the motifs to be overrepresented, in the upstream region of a gene in order to be selected for our analysis and thus limits our candidates to a subset of all possible motifs. Our method is therefore complementary with respect to the standard approaches to binding sequences identification which use weighted matrices instead of completely specified motifs, since these typically have problems in detecting the true positive signals from the statistical background noise.
The variability of the motifs, which is a fundamental fea-ture of Eukariotic binding sequences and is neglected at the beginning of our algorithm is recovered at the end thanks to the careful consensus reconstruction discussed in the previous section. These are the major novelties of our approach.
We consider as an encouraging validation test of our pro-cedure the fact that several known TF binding sequences are found with our method. This makes us confident about the reliability of the other candidates that we found. Needless to say, these should be validated with suitable
Histogram of the distance from the TSS of the motifs found significant by the algorithm (see text)
Figure 2
Histogram of the distance from the TSS of the motifs found significant by the algorithm (see text).
all motif − ann genes − PAM1
bp dist from TSS Density 0 5000 10000 15000 0.00000 0.00015 0.00030
experimental tests. Indeed we think our "ab initio" approach could be of value as a preliminary test for any experimental search of binding sequences.
Several improvements of the present algorithm are possi-ble. In particular it would be interesting to extend our analysis to other regions besides the 5' upstream one (the results on the control element of histones discussed above clearly indicate that this would be a fruitful research direction). In this respect the most natural candidates are the 3' downstream regions and the first intronic interval.
The method could be extended without major modifica-tions to motifs with gaps, as considered in [40]. Extension to longer motifs would also be important: however the extension of the algorithm to motifs significantly longer than the ones considered here should probably take into account motif variability from the start, which would in turn imply a significant increase in computational complexity. We are currently investigating some possible ways of overcoming this problem.
Similarly, it would be important to address the combina-torial nature of transcriptional regulation by studying the correlation of overrepresented words along the lines dis-cussed for instance in [30,31]. It is only by looking at the intricated network of interactions as a whole that one can hope to understand the collective behaviours leading to the tight and impressively efficient regulation of gene expression in higher eukaryotes and in particular in mam-malians. It also clear that the algorithm can in principle be applied to any pair of closely related organisms.
We plan to address these issues in future work.
Methods
Construction of the new release of the CORG database Definition of upstream regions and conserved non-coding blocks:
An upstream region is a sequence window that contains 5' genomic DNA extending from the start of translation of each individual transcript. The maximal size of an upstream region is taken to be 15 kbp. This upper bound stems from the observation that most promoter regions are less than 15,000 bp away from the start of translation [32]. Evidently, upstream regions may be smaller since they are bounded by the size of the intergenic region under consideration. Given this definition, upstream regions of different transcripts of the same gene or tran-scripts belonging to neighbouring genes could overlap. This is taken into account when compiling the conserva-tion informaconserva-tion by cutting the upstream region short of 15 kbp when necessary. All man and mouse DNA sequences were retrieved from the NCBI genome
assem-blies (NCBI33 and mNCBI30). Gene annotations were obtained from the EnsEMBL databases (release 17).
Orthologous man/mouse upstream regions were scanned for significant local similarities. We prefer a local align-ment approach over a global one. That is we do not con-strain the arrangement of putative regulatory modules. We denote these similarities as Conserved Non-coding sequence Blocks (CNBs). CNBs are computed with an implementation of the algorithm of Waterman and Eggert [33], which extends the well known Smith-Waterman algorithm to suboptimal alignments. The two scoring matrices used in the computation are derived from the Kimura two-parameter model and are normalized to a distance of 1 PAM and 10 PAM, respectively. The two matrices yield alignments of differing stringency with an expected level of identity of 99% for 1 PAM vs. 90.7 % for 10 PAM. Gap penalties were set to 11× match score for opening a gap and 0.1× match score for extending one. On average 8% (1 PAM) vs. 18% (10 PAM) of each upstream region (excluding repeats) is covered with CNBs.
An assessment of statistical significance of alignment scores was introduced to discriminate "true" from random alignments. Waterman and Vingron [34] showed that scores of local suboptimal alignments follow approxi-mately the order statistics of a Poisson distribution. This facilitates the calculation of p-values by simulating ran-dom scores. We applied a P-value cutoff of 0.001.
Further details on the derivation of the data set can be found in [35]. Most of the data are part of the CORG data-base and can be accessed via the website http://corg.mol gen.mpg.de.
Construction of the sets
The first step in the algorithm is the construction of sets of genes associated to all possible motifs. In this work a motif is defined as a short (5–8 bps), completely specified DNA sequence. The set associated to the motif m consists of all genes such that m is overrepresented, in the sense defined below, in the CNBs upstream of the genes. Motifs are always read on both strands, and therefore the sets associated to a motif and to its reverse complement coin-cide by definition. All genes for which one ore more CNBs were available were examined and assigned to one or more sets: 11,265 genes are included in the PAM1 version of CORG, and 13,294 in the PAM10 one.
The CORG database includes many rather long entries, up to several hundred bps. It is likely that many of these are actually exons. Since the inclusion of long exons would decrease our signal/noise ratio, we discarded all entries of length greater than 200 bps. We also eliminated multiple
overlapping entries so that, as a final result of this prelim-inary step, each nucleotide in each conserved upstream region has exactly the same statistical weight. With this choice we end up with a total of 389560 distinct CNBs in the PAM10 case out of which 9155 (2.3%) have a length greater than 200 bp and, according to the strategy dis-cussed above, were discarded in the following steps of our analysis. In the PAM1 case we find a total of 203417 CNBs out of which 3408 (1.7%) have a length greater than 200 b. As expected the proportion of CNBs larger than 200 bp decreases as the stringency of the alignments increases.
The definition of overrepresentation of a motif is the same that we used in Ref. [14] and [15], and was originally introduced in Ref.[16]. It is based on the frequency f(m) of the motif in all the CNBs contained in the database. For each gene we count the occurrences of m in the CNBs associated to the gene; then we compute the probability P of finding as many or more occurrences, based on a binomial distribution. The parameters of the binomial distribution are chosen as follows: f(m) is the success probability at each trial, and the number of trials is equal to the number of motifs that can be read in the CNBs associated to the gene. The use of the binomial approxi-mation is based on the assumption of independence between successive trials. While rigorously speaking such assumption is never correct, it leads to serious errors only for periodic motifs, that are likely to be repeated several times in a row on the sequence. Therefore we did not include in our analysis the motifs that can be found repeated (possibly as their reverse complement) at a dis-tance of 1, 2 or 3 bps (for example, respectively, CCCCC, ACGTA, CATCA).
If P < 0.01 we include the gene in the set labeled by the motif m. Notice that no biological significance is ascribed to these sets before they are selected for evidence of coreg-ulation as explained below: therefore the choice of the cutoff on P can be arbitrarily lenient. Based on previous experience, we set the cutoff at P = 0.01. As it can be expected from the number of genes analyzed, essentially all possible motifs turn out to be overrepresented in some genes with this cutoff; however only a small fraction of them are selected by the GO and microarray filters and thus identified as candidate binding sites.
At this point we have thus obtained, for each possible motif m, a set of genes such that m is overrepresented in the CNBs of the genes in the set. The next step consists in looking for evidence of coregulation of the genes included in each set.
The Gene Ontology filter
As a first filter to select the sets whose genes are function-ally related, and hence likely co-regulated, we analyze the
prevalence of Gene Ontology (GO) annotations terms [36] in each set. For all GO terms associated to the genes of a set we perform an exact Fisher's test to determine whether the term appears in the set significantly more often than expected by chance. More precisely the Fisher's test gives us the probability P of obtaining an equal or greater number of genes annotated to the term in a set made of the same number of genes, but selected at ran-dom from the database. If P is statistically significant, then we can postulate the existence of a correlation between the overrepresentation of the motif m labeling the set and the functional characterization of the genes in the set, and hence include m in the list of candidate binding sites found by the algorithm.
Since this test is performed for all GO term and all sets, multiple testing is certainly an important issue. It is made rather non-trivial by the fact that the tests made on differ-ent GO terms are far from being independdiffer-ent of each other (think for example of testing the same set of genes for overrepresentation of the terms "cell cycle" and "DNA replication"). We chose to approach this issue with a safe, brute-force method based on random sampling, previously used in Ref. [15]: we generated a large sample of randomly selected gene sets of the typical size of our sets and we used it to estimate the number of false discov-eries to be expected as a function of the cutoff on P-values. This allowed us to tune the cutoff on the Fisher's test P-val-ues to obtain the desired value of the FDR (False Discov-ery Rate), which for the results we present is 10%.
The Microarray filter
An alternative and complementary filter to select candi-date binding sites of our method uses microarray data. The assumption is that the distribution of expression val-ues of a set of co-regulated genes is significantly different from the distribution of expression values of the whole genome. We used microarray data from the Stanford human cell-cyle experiment [37], consisting of 114 micro-arrays. We used the labels available in the raw data file (Unigene identifier and HUGO symbol when available) to make the correspondence with the Ensembl clusters used to identify the genes in the sets.
For each set and each microarray experiment, the compar-ison between the distribution of the data for the set and for the wholes genome was performed using the non par-ametric Kolmogorov-Smirnov (KS) test on the distribu-tion of log(R), where R is the red/green normalized ratio. The goal is to identify the sets (and thus the corresponding motifs) showing an expression pattern significantly differ-ent from the background distribution (i.e. from the whole genome expression pattern for that particular microarray experiment). The non parametric KS test is the best suited tool for this type of analysis since it makes it possible to
compare the expression levels measured in a given exper-iment without any a-priori assumption about the distri-bution of the data. Moreover the KS test looks for significant differences in the whole distribution (the sta-tistic used is the largest difference between the cumulative distributions): therefore, at least in principle, it is able to detect subtle differences which would not be detected by tests based, for example, simply on the average expression level. However, like most non-parametric tests, the KS test is generally less potent than parametric tests, and hence requires a very strong signal to turn out significant. In par-ticular, it is more likely to be successful in detecting the differential expression of large sets of genes, like our own. The KS test on expression data was previously used to identify candidate binding sites in Ref. [17].
Finally we evaluated the False Discovery Rate (FDR) by using the standard Benjamini-Hochberg method [38], set-ting a FDR threshold of 10%.
Construction of consensus sequences for the binding sites In many cases several words, similar to each other, are found to be significantly associated to the same Gene Ontology term, or to the same microarray experiment. In such cases it is natural to assemble such words into a con-sensus sequence for the candidate binding site. This was systematically done for each Gene Ontology term in the following way: all the words associated to the same Gene Ontology term were aligned using the wconsensus [39] package. We selected the wconsensus results in the follow-ing way: the best matrix found by wconsensus was accepted if its expected frequency was less than 0.001; other matrices were also accepted if they exceeded such significance and they were generated from motifs that did not enter the previously accepted matrices. Therefore the algorithm is in principle capable of generating more than one consensus from a group of motifs. However in prac-tice this never happens in our case: either one or no con-sensus sequence was produced for each group of motifs.
The same approach gives less satisfactory results when applied to the words associated to the same microarray experiment, the reason being that several microarray experiments turn out to be associated to a large number of rather different motifs, which cannot produce a single, meaningful consensus sequence. This is hardly surprising based on the results of the same approach applied to yeast [14], where the analysis of a rather small set of microarray experiments revealed many unrelated binding sites. Indeed genes regulated by several different transcription factor can be expected to show differential expression in the same experimental conditions. For several time-points, the best consensus was a three-letter sequence of dubious informative value. Only for six time-points we obtained a consensus of length 4 or higher.
Additional material and raw data are available at: http:// www.to.infn.it/ftbio/tf_human/supplementary.html
Authors' contributions
DC: implementation of most of the algorithms and also participation in the project design.
CH: microarray validation of the motifs.
CD: construction of the CORG database.
FDC: assessment of the biological significance of the results.
PP: contribution to the planning of the work and to the development of the algorithms used in the construction and analysis of the sets.
MC: supervision of the project.
All the authors contributed to the manuscript writing.
Additional material
Acknowledgements
P.P. is a Lagrange Fellow of the I.S.I. foundation. We thanks Enrico Curiotto for helpful discussion.
References
1. Wassermann WW, Sandelin A: Applied bioinformatics for the identification of regulatory elements. Nat Rev Genet 2004, 5:276-87.
2. Pennacchio LA, Rubin EM: Genomic strategies to identify mam-malian regulatory sequences. Nat Rev Genet 2001, 2:100-109. 3. Hardison R: Conserved non-coding sequences are reliable
guides to regulatory elements. Trends Genet 2000, 16:369-372.
Additional File 1
The complete list of significant motif/GO term and motif/microarray time-point associations. The first column is the motif (to be considered coinciding with its reverse complement); the second column is the scoring matrix; the third is the type of filter ("GO" for Gene Ontology or "MA" for microarray); the fourth is the GO term or the microarray experiment; for GO terms, the fifth column contains the GO branch ("C": cellular component; "F": molecular function; "P": biological process); the sixth column is -log10 of the P-value of the test determining the significativit of the motif (Fisher's test for Gene Ontology, Kolmogorov-Smirnov for microarrays).
Click here for file
[http://www.biomedcentral.com/content/supplementary/1471-2105-6-110-S1.txt]
Additional File 2
The complete list of sets corresponding to the significant motifs. Each gene in each significant set is represented by its EnsEmbl ID.
Click here for file
[http://www.biomedcentral.com/content/supplementary/1471-2105-6-110-S2.txt]
Publish with BioMed Central and every scientist can read your work free of charge "BioMed Central will be the most significant development for disseminating the results of biomedical researc h in our lifetime."
Sir Paul Nurse, Cancer Research UK
Your research papers will be:
available free of charge to the entire biomedical community peer reviewed and published immediately upon acceptance cited in PubMed and archived on PubMed Central yours — you keep the copyright
Submit your manuscript here:
http://www.biomedcentral.com/info/publishing_adv.asp
BioMedcentral
4. Duret L, Dorkeld F, Gautier C: Strong conservation of non-cod-ing sequences durnon-cod-ing vertebrates evolution: potential involvement in post-transcriptional regulation of gene expression. Nucleic Acid Res 1993, 21:2315-2322.
5. Loots GG, Locksley RM, Blankespoor CM, Wang ZE, Miller W, Rubin EM, Frazer KA: Identification of a coordinate regulator of interleukins 4, 13, and 5 by cross-species sequence comparisons. Science 2000, 288:136-140.
6. Goettgens B, Barton L, Gilbert J, Bench A, Sanchez M, Bahn S, Mistry S, Grafham D, McMurray A, Vaudin M, Amaya E, Bentley D, Green A, Sinclair A: Analysis of vertebrate scl loci identifies conserved enhancers. Nat Biotechnol 2000, 18:181-186.
7. Flint J, Tufarelli C, Peden J, Clark K, Daniels R, Hardison R, Miller W, Philipsen S, Tan-Un K, McMorrow T, Frampton J, Alter B, Frischauf A, Higgs D: Comparative genome analysis delimits a chromo-somal domain and identifies key regulatory elements in the alpha globin cluster. Hum Mol Genet 2001, 10:371-382.
8. Lenhard B, Sandelin A, Mendoza L, Engström P, Jareborg N, Wasser-man WW: Identification of conserved regulatory elements by comparative genome analysis. J Biol 2003, 2:13.
9. Zhang Z, Gerstein M: Of mice and men: phylogenetic footprint-ing aids the discovery of regulatory elements. J Biol 2003, 2:11. 10. Sinha S, Tompa M: Discovery of novel transcription factor bind-ing sites by statistical overrepresentation. Nucleic Acids Res 2002, 30:5549.
11. Sinha S, Tompa M: YMF: A program for discovery of novel tran-scription factor binding sites by statistical overrepresentation. Nucleic Acids Res 2003, 31:3586.
12. Birnbaum K, Benfey PN, Shasha DE: cis element/transcription fac-tor analysis (cis/TF): a method for discovering transcription factor/cis element relationships. Genome Research 2001, 11:1567.
13. Wolfsberg TG, Gabrielian AE, Campbell MJ, Cho RJ, Spouge JL, Lands-man D: Candidate regulatory sequence elements for cell cycle-dependent transcription in Saccharomyces cerevisiae.
Genome Research 1999, 9:775.
14. Caselle M, Di Cunto F, Provero P: Correlating overrepresented upstream motifs to gene expression: a computational approach to regulatory element discovery in eukaryotes.
BMC Bioinformatics 2002, 3(1):7.
15. Cora' D, Di Cunto F, Provero P, Silengo L, Caselle M: Computa-tional identification of transcription factor binding sites by functional analysis of sets of genes sharing overrepresented upstream motifs. BMC Bioinformatics 2004, 5(1):57.
16. van Helden J, Andre B, Collado-Vides J: Extracting regulatory sites from the upstream region of yeast genes by computa-tional analysis of oligonucleotide frequencies. J Mol Biol 281(5):827-42. 1998 Sep 4
17. Jensen LJ, Knudsen S: Automatic discovery of regulatory pat-terns in promoter regions based on whole cell expression data and functional annotation. Bioinformatics 2000,
16(4):326-33.
18. Lawrence CE, Reilly AA: An expectation maximization (EM) algorithm for the identification and characterization of com-mon sites in unaligned biopolymer sequences. Proteins 1990, 7:41.
19. Thijs G, Marchal K, Lescot M, Rombauts S, De Moor B, Rouze P, Moreau Y: A Gibbs sampling method to detect overrepre-sented motifs in the upstream regions of coexpressed genes.
J Comput Biol 2002, 9:447.
20. Thompson W, Rouchka EC, Lawrence CE: Gibbs Recursive Sam-pler: finding transcription factor binding sites. Nucleic Acids Res 2003, 31:3580.
21. Hughes JD, Estep PW, Tavazoie S, Church GM: Computational identification of cis-regulatory elements associated with groups of functionally related genes in Saccharomyces cerevisiae. J Mol Biol 2000, 296:1205.
22. Sandelin A, Wasserman WW, Lenhard B: ConSite: web-based prediction of regulatory elements using cross-species comparison. Nucleic Acids Res :W249-52. 2004, Jul 1
23. Prakash A, Blanchette M, Sinha S, Tompa M: Motif discovery in het-erogeneous sequence data. Pac Symp Biocomput 2004:348-59. 24. Ohtani K, DeGregori J, Nevins JR: Regulation of the cyclin E gene
by transcription factor E2F1. PNAS 1995, 92(26):12146-50. 25. Matys V, Fricke E, Geffers R, Gossling E, Haubrock M, Hehl R,
Hor-nischer K, Karas D, Kel AE, Kel-Margoulis OV, Kloos DU, Land S,
Lewicki-Potapov B, Michael H, Munch R, Reuter I, Rotert S, Saxel H, Scheer M, Thiele S, Wingender E: TRANSFAC: transcriptional regulation, from patterns to profiles. Nucleic Acids Res 2003, 31:374.
26. Sittman DB, Graves RA, Marzluff WF: Structure of a cluster of mouse histone genes. Nucleic Acids Res 1993, 11(19):6679-97. 27. Wentworth BM, Donoghue M, Engert JC, Berglund EB, Rosenthal N:
Paired MyoD-binding sites regulate myosin light chain gene expression. PNAS 1991, 88(4):1242-6.
28. Wang Y, Shen J, Arenzana N, Tirasophon W, Kaufman RJ, Prywes R: Activation of ATF6 and an ATF6 DNA binding site by the endoplasmic reticulum stress response. J Biol Chem 2000, 275(35):27013-20.
29. Mizugishi K, Aruga J, Nakata K, Mikoshiba K: Molecular properties of Zic proteins as transcriptional regulators and their rela-tionship to GLI proteins. J Biol Chem 276(3):2180-8. 2001 Jan 19 30. Sudarsanam P, Pilpel Y, Church GM: Genome-wide cooccurrence
of promoter elements reveals a cis-regulatory cassette of rRNA transcription motifs in S. cerevisiae. Genome Research 2002, 12:1723.
31. Chiang Derek Y, Moses Alan M, Manolis Kellis , Lander Eric S, Eisen Michael B: Phylogenetically and conserved word pairs associ-ated with gene-expression changes in yeasts. Genome Biology 2003, 4:R43.
32. Dieterich C, Cusack B, Wang H, Rateitschak K, Krause A, Vingron M: Annotating regulatory DNA based on man-mouse genomic comparison. Bioinformatics 2002, 18(Suppl 2):S84.
33. Waterman MS, Eggert M: A new algorithm for best subsequence alignmnents with application to tRNA-rRNA comparison. J
Mol Biol 1997, 197:723-728.
34. Waterman MS, Vingron M: Sequence comparison significance and Poisson approximation. Statistical Science 1994, 9:367-381. 35. Dieterich C, Wang H, Rateitschak K, Luz H, Vingron M: CORG: a
database for Comparative Regulatory Genomics. Nucleic Acid
Res 2003, 31:55-57.
36. The Gene Ontology Consortium: Gene Ontology: tool for the unification of biology. Nature Genetics 2000, 25:25-29.
37. Whitfield ML, Sherlock G, Saldanha AJ, Murray JI, Ball CA, Alexander KE, Matese JC, Perou CM, Hurt MM, Brown PO, Botstein D: Identi-fication of genes periodically expressed in the human cell cycle and their expression in tumors. Mol Biol Cell 2002, 13(6):1977-2000.
38. Benjamini Y, Hochberg Y: Controlling the false discovery rate: a practical and powerful approach to multiple testing. J R Statist
Soc 1995, B57:289.
39. Stormo G, Hartzell GW: Identifying protein-binding sites from unaligned DNA fragments. PNAS 1989, 86:1183-1187.
40. van Helden J, Rios AF, Collado-Vidas J: Discovering regulatory elements in non-coding sequences by analysis of spaced dyads. Nucleic Acid Res 2000, 15(28(8)):1808-18.