Accepted Manuscript
Identification and quantification of new isomers of isopropyl-malic acid in wine by LC-IT and LC-Q-Orbitrap
Massimo Ricciutelli, Simone Moretti, Roberta Galarini, Gianni Sagratini, Michele Mari, Simone Lucarini, Sauro Vittori, Giovanni Caprioli
PII: S0308-8146(19)30863-5
DOI: https://doi.org/10.1016/j.foodchem.2019.05.068
Reference: FOCH 24793
To appear in: Food Chemistry
Received Date: 23 January 2019
Revised Date: 4 May 2019
Accepted Date: 7 May 2019
Please cite this article as: Ricciutelli, M., Moretti, S., Galarini, R., Sagratini, G., Mari, M., Lucarini, S., Vittori, S., Caprioli, G., Identification and quantification of new isomers of isopropyl-malic acid in wine by LC-IT and LC-Q-Orbitrap, Food Chemistry (2019), doi: https://doi.org/10.1016/j.foodchem.2019.05.068
This is a PDF file of an unedited manuscript that has been accepted for publication. As a service to our customers we are providing this early version of the manuscript. The manuscript will undergo copyediting, typesetting, and review of the resulting proof before it is published in its final form. Please note that during the production process errors may be discovered which could affect the content, and all legal disclaimers that apply to the journal pertain.
Identification and quantification of new isomers of isopropyl-malic acid
in wine by LC-IT and LC-Q-Orbitrap
Massimo Ricciutelli1, Simone Moretti2, Roberta Galarini2, Gianni Sagratini1, Michele Mari3, Simone
Lucarini3, Sauro Vittori1, Giovanni Caprioli1*
1School of Pharmacy, University of Camerino, Via Sant’Agostino 1, 62032 Camerino, Italy
2Istituto Zooprofilattico Sperimentale dell’Umbria e delle Marche “Togo Rosati”, Via G.
Salvemini, 1, Perugia, Italy
3Department of Biomolecular Science, Division of Chemistry, Piazza del Rinascimento 6,
University of Urbino Carlo Bo, 61029 Urbino, Italy
*Corresponding author: Giovanni Caprioli, School of Pharmacy, University of
Camerino, via S.Agostino 1, 62032 Camerino, Italy. Phone: +390737402238. Fax:
Abstract
Organic acids of wine comprise one of the main taste groups, that of sourness. Two isomeric compounds with molecular weight of 176 u have been identified in wine using two LC-MS systems, LC-IT (ion trap) and LC-Q-Orbitrap. The two isomers are organic acids, 3-isopropylmalic acid (3-IPMA) never identified in wines, and 2-isopropylmalic acid (2-IPMA), never quantified in wines. After the definitive identification against the authentic standards, an analytical method for their determination in wines was optimised and validated using the LC-IT platform. Linearity was verified in the range 5-320 mg L-1 (correlation coefficients
higher than 0.9914) and the recoveries obtained spiking the samples at two fortification levels were higher than 86.7%, with RSDs (n=9) lower than 15.1%. Finally, the two compounds were quantified in ten red and white Italian wines, and average concentrations were determined at 1.78 mg L-1 (0.56-4.13) and 23.0 mg L-1
(6.7-41.6) of 3-IPMA and 2-IPMA, respectively.
Keywords: wine, 2-isopropylmalic acid, 3-isopropylmalic acid, LC-IT, LC-Q-Orbitrap,
untargeted analyses, identification
2-IPMA 2-isopropylmalic acid, 3-IPMA 3-isopropylmalic acid, DAD diode array detector,
EIC Extract ion chromatogram, ESI electrospray ionization, FT Fourier transform, FWHM
(full width at half maximum) LC liquid chromatography, LIT linear ion trap, LLE liquid–
liquid extraction, LOD limit of detection, LOQ limit of quantification, MS mass
spectrometry, MS/MS tandem mass spectrometry, PTFE polytetrafluoroethylene, RP
reverse phase, RSD relative standard deviation, SPE solid phase extraction, TIC total ion
chromatogram.
Chemical compounds studied in this article
2-IPMA (PubChem: CID 77), 3-IPMA (PubChem: CID 36)
1. Introduction
Wine is defined as an alcoholic beverage, which is produced by fermentation of fresh
comprise one of the main taste groups, namely, that of sourness. All organic acids have this
quality to some degree, but some have their own characteristic flavour, taste or aroma. For
example, citric acid has a fresh acid flavour different from that of malic acid, while
succinic acid has an unusual salty, bitter taste in addition to its sourness (Whiting, 1975).
Oxo-acids (pyruvic and 2-oxoglutaric acids) bind SO2, a widely used microbial inhibitor.
Acids differ greatly in their susceptibility to microbiological attack: succinic acid is
resistant anaerobically and aerobically while malic and citric acids are readily metabolized
anaerobically with consequent flavor changes (Lamikanra, Inyang & Leong, 1995).
The quantitatively dominating acids of grapes are maleic, tartraric, and citric acids, the first
two of which account for over 90% of the total acid content of grapes (Schreier &
Jennings, 2013). Gas chromatographic methods have been applied for several decades for
the analysis of acids in wines and grape juices (Fantozzi & Bergeret, 1973; Philip &
Nelson, 1973). In 1974 Stahl et al. (Stahl, Laub & Woller, 1974) reported for the first time
the determination of non-volatile acids in wines and fruit juices by liquid chromatography.
The relative amounts of acids are also influenced by environmental factors such as
temperature, light, and humidity. Changes in organic acid contents of grapes with fruit
maturity and their distribution within mature berries have been determined by HPLC
(Lamikanra, Inyang & Leong, 1995). Wine is also rich in phenolic compounds, that are
important components as they affect organoleptic characteristics, such as colour,
astringency and aroma (Kennedy, 2008). In addition, their antioxidant properties are
thought to be associated with cardioprotective effects and other health benefits of moderate
wine consumption (Cooper, Chopra & Thurnham, 2004). Some years ago, Ginjom et al.
(2011) identified and quantified the individual phenolic compounds present in wine at
different wine-making stages from crushing through to bottled and aged wine, produced in
two red wines (Shiraz and Cabernet Sauvignon) were isolated by liquid–liquid extraction
(LLE), purified by SPE and analyzed by HPLC-DAD-MS. Interestingly, they were not
able to identify a compound (named U1) with a low molecular mass (176 u) and a large
peak area eluting at around 8.66 min, with a maximum absorbance at 275 nm. Previously,
Monagas et al. reported the presence of a peak with similar characteristic (m/z 175 in the
MS spectrum acquired in negative ion mode) in other wine types but its identity was not
established (Monagas, Suarez, Gomez-Cordoves & Bartolome, 2005). Our group noticed
this unknown peak by HPLC-DAD-MS performing a recent published study entitled
“Further Highlighting on the Prevention of Oxidative Damage by Polyphenol-Rich Wine
Extracts” (Salucci, Lucarini & Diamantini, 2017). Mass spectrometry is the most selective
technique for the rapid qualitative and quantitative determination of known compounds.
On the other side, for the identification of unknown compounds, the combination of
Fourier Transform Orbitrap MS technology with a linear ion trap MS has been shown to
give excellent results as it allowed identification and quantitation in untargeted and
targeted analysis (Caprioli, Cahill & James, 2014a; Caprioli, Logrippo, Cahill & James,
2014b). Thus, the first aim of this work was to characterize the unidentified compound in
wines with a nominal molecular mass of 176 u (Ginjom et al. 2011; Monagas et al. 2005)
by using two LC-MS platforms, i.e. LC coupled to an ion trap detector (LC-IT) and LC
coupled to a hybrid high-resolution mass analyser (LC-Q-Orbitrap). In the second part of
this paper, thanks to identification of two isomers of isopropylmalic acid and availability of
the authentic standards, for the first time these organic acids have been quantified in ten
red and white wines.
2. Materials and Methods
The analytical standards of 2-IPMA (CAS Number 3237-44-3) and 3-IPMA (CAS Number
16048-89-8) were purchased from Sigma-Aldrich (Milano, Italy). The stock standard
solution was prepared by dissolving 10 mg of each analyte in 10 mL of methanol and
stored in a glass-stoppered bottle at 4°C in the dark. Standard working solutions, at various
concentrations, were prepared daily by appropriate dilution of aliquots of the stock
solutions in methanol.
HPLC-grade acetonitrile and methanol were purchased from Sigma-Aldrich (Milan, Italy),
while HPLC-grade formic acid 99-100% was bought from J.T. Baker B.V. (Deventer,
Holland). For sample preparation and chromatographic analysis, de-ionized water of 18.2
MΩ/cm resistivity purified with a Milli-Q system (Millipore, Bedford, USA) was used. All
solvents were filtered through a 0.2 µm polyamide filter from Sartorius Stedim
(Goettingen, Germany) while all wine samples were filtered through a 0.2 µm single use
membrane syringe filter from Phenomenex (Bologna, Italy) before HPLC analysis.
2.2 Wine samples
Red and white wine samples were purchased in the supermarkets of the Camerino area
(Camerino, Macerata, Italy) and wine characteristics are detailed in Table 2.
2.3 Sample preparation
50 mL wine samples were extracted three times with ethyl acetate (50 mL) following a
previous published method (Salucci, Lucarini & Diamantini, 2017). The ethyl acetate
extracts were pooled together prior to rotary evaporation at 30°C. This amount of samples
(50 mL) and solvents (3 X 50 mL) can eventually be downscaled even if is important to
minimize emulsion formation and to obtain good reproducibility among analysed samples.
The residue was re-dissolved in 2.5 mL methanol, filtrated through a 0.2 µm membrane
filter from Phenomenex (Bologna, Italy) and then directly injected into the IT or
2.4 LC-IT analysis
LC-IT studies were performed using an Agilent 1100 (Santa Clara, CA, USA) series
instrument, made from an autosampler, a binary solvent pump, with a diode-array detector
(DAD) and a mass spectrometer detector Trap SL (Bruker, Billerica, MA, USA) equipped
with an electrospray ionization (ESI) source. The analyte separation was achieved on a
Grace reversed phase (RP) (150 x 2.1 mm, 3 μm) LC column from Grace Davison
Discovery Sciences (Columbia, MD, USA). The mobile phases were water with 0.1%
formic acid (A) and acetonitrile (B) 95:5 v/v working in the gradient mode at a flow rate of
0.2 mL min-1. The solvent composition varied as follows: 0 min, 5% B; 2 min, 5% B; 2–4
min, 15% B; 4–12 min 30% B; 12–22 min, 60% B; 22–25 min 60% B; then the column
was reconditioned. The column temperature was set at 35 °C and the injection volume was
2 μL. The ESI source was operating in negative ionization mode (ESI-). The optimization
of the ion trap detector conditions was carried out by flow injection analysis (FIA) (1 μL of
the individual standard solutions at 50 μg mL−1). The parameters set for ESI were as
follows: nebulizer gas (nitrogen) pressure, 50 psi; drying gas (nitrogen) flow rate,
9 mL min−1; dry gas temperature, 325 °C; capillary voltage, 3500 V. Mass scan range was
set in the interval of m/z 50–1000 in negative ionization mode.
2.5 LC-Q-Orbitrap analysis
The chromatographic separation was achieved using the same LC column and conditions
(gradient and mobile phases) reported above. The LC-MS platform consisted of a Dionex
Ultimate 3000 UHPLC system and a Q-Exactive Plus mass spectrometer equipped with a
HESI II source (Thermo Scientific, San Jose, CA, USA). HESI II was operating in
negative ionization mode setting the following parameters: capillary temperature 300 °C,
vaporization temperature 320 °C, sheath gas flow 35, aux gas flow 15, source voltage 2.8
The data were acquired at 140,000 FWHM at m/z 200. The AGC representing the
maximum capacity in C-trap was set at 5 x 10⁵ ions for a maximum injection time of 600
ms. For t-MS2 experiments the resolution was set at 140,000 FWHM (at m/z 200), the
AGC target at 5 x 10⁵, the injection time at 600 ms and the isolation window at 1.2 m/z.
The stepped collision energy used were 10-20-30 NCE (normalized collision energy).
Results and discussion
3.1 Preliminary investigation by LC-IT
Preliminary experiments demonstrated that negative ion ionisation gave better results (in
terms of intensity) with respect to the positive one (Data not shown). Figure 1 reports the
total ion chromatogram (TIC) (a) and the extract ion chromatogram (EIC) of the ion at m/z
175 (b) of a wine sample extract and acquired in negative ionisation mode (ESI-). The TIC
is quite rich and contains many peaks; on the other side, from the EIC (m/z 175), an
abundant and broad peak at a retention time of 12.2 minutes is clearly visible (Figure 1b).
In the full scan mass spectrum of this peak, the most abundant ion was at m/z 175 [M-H]-
(Figure 1c); correspondingly, in the ESI(+) full scan spectrum, the most abundant ion
species was at m/z 177 ([M+H]+) (Data not shown). Thus, it is supposed that the unknown
compound had a nominal molecular weight of 176 u. Reviewing the pertinent literature
(Wojdyło, Samoticha, Nowicka & Chmielewska, 2018; Šeruga, Novak & Jakobek, 2018;
Teixeira, Mateus, Freitas & Oliveira, 2018; Donato et al., 2018), we tried to understand if
there were some polyphenols or typical wine substances with this molecular weight, but
without any success. Thus we moved to perform MSn studies. The MS2 spectrum of the
[M-H]- (m/z 175) (Figure 1d) shows a fragment ion at m/z 157 due to loss of water (m/z
18). In addition, there is also an intense signal at m/z 129, which correspond to the loss of
formic acid (m/z 46) [M-HCOOH-H]-, as well as the ion species at m/z 113 is due to the
correspond to [C4H5O2]- and, eventually, can be produced by the loss of CO2 from the m/z
129. Observing in detail the MS2 spectra (Figure 1d) all along the shape of the
chromatographic peak at 12.2 min ((Figure 1b), it is evident that the ion species at m/z 73
is present only in the left side of the peak, whereas that at m/z 115 is detectable only in the
right side, testifying the possible presence of two co-eluting compounds. The first ion
species at m/z 73 may be produced by the loss of C5H10O2 from the precursor ion (m/z
175), meanwhile the second one (m/z 115) by the loss of acetic acid [M-CH3COOH-H]-.
Finally, even if the elucidation of the mass fragmentation pathways seems to be consistent,
in order to obtain the definitive peak identification, further experiments were undertaken
using a high resolution MS system, i.e. LC-Q-Orbitrap.
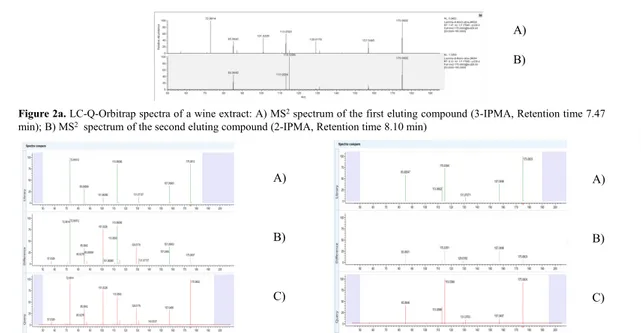
3.2 Identification of the unknown features by LC-Q-Orbitrap
The analysis by LC-Q-Orbitrap (t-MS2)of a wine extractclearly confirmed the presence of
two co-eluting compounds, the first characterised by the fragment at m/z 72.9914 (left side
of the chromatographic peak), and the second one characterised by the fragment at m/z
115.0386 (right side of the chromatographic peak). The acquisition of the accurate mass
supported the above reported hypothesis, that is the formation of these two ion species
starting from the deprotonated molecule [M-H]-, respectively, from the neutral loss of
C5H10O2 (m/z 72.9916) and acetic acid (m/z 115.0386). Raw data were then processed with
Freestyle 1.1 software (Thermo Fisher Scientific, Waltham, MA, USA) performing
identification by comparison with the mzCloud™ data (https://www.mzcloud.org). An
excellent matc was obtained for the two isomeric organic acids, 3-IPMA and 2-IPMA, the
first eluting in the left and the second in the right side of the LC-Q-Orbitrap
chromatographic peak, respectively. The chemical structures of the two compounds are
Figure 2a, the accurate mass of the precursor ion [M-H]- is m/z 175.0602. This measured
value minus the exact mass of the deprotonated isopropylmalic acids ([C7H11O5]- at m/z
175.0612) give an error equal to -5.7 ppm, corroborating the compound identity.
Analogously, the accurate masses of the losses hypothesized to explain the characteristic
fragment ion at m/z 72.9914 and at m/z 115.0386 were m/z 102.0688 (m/z 175.0602 - m/z
72.9914) and m/z 60.0216 (m/z 175.0602 - m/z 115.0386), respectively (Figure 2a). These
values fully confirmed, in the first case, the loss of a 3-metylbutanoic acid residue
(C5H10O2, mass error +7.1 ppm) for 3-IPMA and, in the second one, of an acetic acid
residue (C2H4O2, mass error +7.8 ppm) for 2-IPMA. The comparison between the 3-IPMA
and 2-IPMA spectra from the library (at the top) and from the HRMS experiments (at the
bottom) conducted in the current study, is shown in Figure 2b. In the middle, the
“difference spectrum” highlights that there are negligible differences among the
experimental spectrum (called “query”) and that coming from the m/zCloud library.
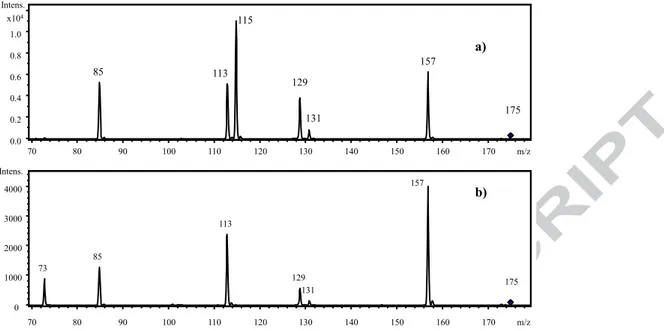
3.3 Confirmation of the identified compounds with authentic standards
After the identification study carried out with the LC-Q-Exactive Plus platform, the authentic standards of 2-IPMA (CAS Number 3237-44-3) and 3-2-IPMA (CAS Number 16048-89-8) were purchased from Sigma-Aldrich and analysed using the LC-IT (ESI-). As expected, in the chromatogram two co-eluting peaks were observed at 11.7 min (3-IPMA) and at 12.4 min (2-IPMA). In Figure 3 the LC–IT spectra recorded from the standard solutions of 2-IPMA (a) and 3-IPMA (b) are shown. The MS2 spectra of the authentic standards
(amplitude 0.9) confirmed the data already obtained: 3-IPMA displayed its own peculiar ion species at m/z 73, whereas 2-IPMA at m/z 115 (Figure 3).
All the other fragments (m/z 157, m/z 129, m/z 113, m/z 85) were shared by both isomers. The first peculiar fragment (m/z 73) is typical of 3-IPMA and in fact is produced by the loss of [C5H10O2](m/z 102), giving the
ion [C2HO3]- at m/z 73; on the other hand, the second peculiar one (m/z 115) is produced by the loss of acetic
In Figure 3 it is possible also to appreciate the differences of the ion abundances between the two compounds. In addition, a real red wine extract was injected in the ion trap apparatus (MS/MS) with amplitude 0.9.
In Figure 4 the overlapped chromatograms are reported showing the peaks obtained extracting the specific ion fragments (i.e. m/z 115 or m/z 73) from the standard solutions of the authentic compounds and from the red wine. In the wine both compounds were detected: 3-IPMA at a retention time of 11.7 min and 2-IPMA at a retention time of 12.4 min.
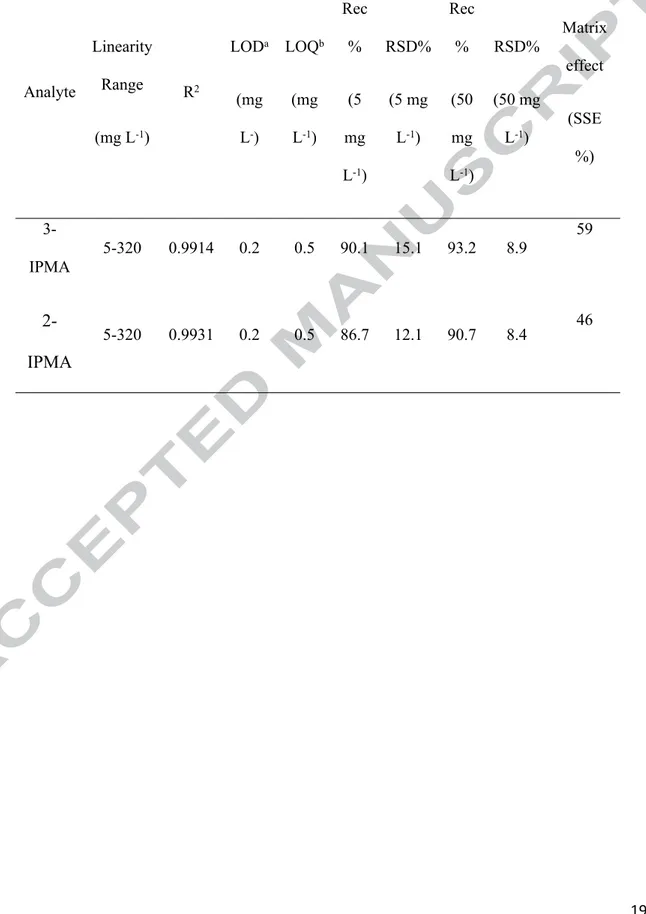
3.4 Method validation of the LC-IT method
After the definitive identification against the authentic standards, an analytical method for their quantification in wines was validated using the LC-IT platform. The investigated performance characteristics of the developed method were linearity, limit of detection (LOD), limit of quantification (LOQs), recovery, intraday and interday precision and matrix effect (as signal suppression/enhancement %) (Table 1).
Linearity was tested by injecting 6 different concentrations of standard mixtures of the analytes in solvent (Table 1) from 5 to 320 mg L-1 (corresponding to a range of 0.25-16 mg L-1 in matrix). Calibration curves
(concentrations versus peak areas) were determined by least-squares regression analysis obtaining correlation coefficients (R2) higher than 0.9914. The reproducibility of the chromatographic retention times was
examined five times over a five day period (n=25) obtaining high stability (RSD < 1%).
The LODs and LOQs were estimated on the basis of 3:1 and 10:1 signal-to-noise ratios
obtained with standards containing the compounds at low concentration levels. The
estimated LODs and LOQs were 0.2 and 0.5 mg L-1, for both compounds (Table 1). The
mean recoveries obtained spiking a wine sample thrice in three different days at 5 mg L-1
were 86.7 (2-IPMA) and 90.1% (3-IPMA) with RSDs (n=9) equal to 12.1% and 15.1%,
respectively (Table 1). The mean recoveries obtained spiking a wine sample thrice in three
different days at level of 50 mg L-1 were from 90.7 (2-IPMA) and 93.2% (3-IPMA) with
Matrix effect was studied comparing the slope of a calibration curve in pure solvent and of
a matrix-matched curve prepared by adding the standards to a wine extract (after
extraction). The calibration curve was obtained by subtracting in each concentration the
amount of polyphenols obtained from the blank extract. These curves were obtained after
injecting seven concentration levels, between 5 and 250 mg L−1. The slope of the standard
addition plot was compared with the slope of standard calibration plot to evaluate the
matrix effects. The signal suppression/enhancement (SSE) was calculated according to the
following equation (Caprioli, Nzekoue. Giusti, Vittori & Sagratini, 2018):
SSE % = (slope matrix matched curve/slope pure solvent curve)×100;
If SSE (%) is about 100% there is no matrix effect, values < 100% indicate signal
suppression, while values ˃ 100% indicate signal enhancement. In our study the SSE % ranged from 46 (2-IPMA) to 59 (3-IPMA) indicating a negative matrix effect (ion
suppression) of 54 and 41%, respectively (Table 1).
In the following paragraph, the quantification of the two analyte in wine samples have
been reported taken into account ME studies.
3.5 Quantification of 2-IPMA and 3-IPMA in Italian wines
The validated LC-IT method was used to analyse ten Italian wine samples, specifically
five red and five white wines. The two analytes were found in all samples. In Table 2
the results were reported in detail; each wine sample was analysed in triplicate.
Concerning red wines, the contents of 2-IPMA ranged from 18.9 mg L−1
(Montepulciano) to 41.6 mg L−1 (Merlot). Also “Primitivo” displayed a conspicuous
content of 2-IPMA (30.1 mg L−1). On the other hand, 3-IPMA was found in lower
concentration ranging from 1.43 mg L −1 (Montepulciano) to 4.13mg L−1 (Merlot). The
IPMA was 2.23 mg L−1. Concerning the white wines, the contents of 2-IPMA ranged
from 6.7 mg L−1 (Primofiore) to 27.8 mg L−1 (Verdicchio di Matelica), meanwhile the
content of 3-IPMA was from 0.56 mg L−1 (Primofiore) to 2.42 mg L−1 (Verdicchio di
Matelica). The average contents of 2-IPMA and 3-IPMA in white wines were 17.5 mg
L−1 and 1.32 mg L−1, respectively.
From literature, α-isopropylmalate is reported to be a leucine biosynthesis intermediate in yeast. In Saccharomyces cerevisiae, α-isopropylmalate, which is produced in mitochondria, is exported to the cytosol where it is required for leucine biosynthesis (Marobbio, Giannuzzi, Paradies, Pierri, & Palmieri, 2008). Yeast cells naturally secret this compound into their surrounding. It is thought that 2-IPMA secretion chelates aluminium ions and prevents them from entering cells, resulting in aluminium tolerance (Suzuki, Tamura, Nakanishi, Tashiro, Nishizawa, & Yoshimura, 2007) and reducing aluminum toxicity to the yeast cell. According to the possible implication of 2-IPMA in the flavour of wines, really scant information is available in literature. Skogerson et al. (2009) determined the metabolite profiles of white wines, including Chardonnay, Pinot gris, Riesling, Sauvignon blanc, and Viognier varieties, by using gas chromatography-coupled time-of-flight mass spectrometry (GC-TOF-MS). 2-Isopropylmalate detected appeared to have higher mean area (semi-quantitative approach) in the low-wine body classification group (Skogerson, Runnebaum, Wohlgemuth, De Ropp, Heymann, & Fiehn, 2009).
No data are available in literature for 3-IPMA, that has been identify and quantify in wine for the first time in the current study.
4. Conclusions
Organic acids of wine are important as they comprise one of the main taste groups, namely, that of sourness. Two organic acids (nominal molecular weight of 176 u) using two MS platforms such as IT and LC-Q-Orbitrap have been identified and quantified in wines. Thanks to the combined information obtained from the ionization behaviour, fragmentation experiments and accurate mass acquisition, it was possible to establish that they were the two isomeric forms of isopropylmalic acid (2-IPMA and 3-IPMA). The definitive confirmation was carried purchasing authentic standards.
A quantitative analytical method by using the LC-IT technique was then developed and validated. Although the chromatographic peaks of the two analytes were not well separated, two peculiar ion species, m/z 115 for 2-IPMA and m/z 73 for 3-IPMA, were found allowing to measure each compound separately by extracting their characteristic fragments. These newly identified compounds were quantified in ten red and white Italian wines highlighting that 2-IPMA was about ten-fold more concentrated than 3-IPMA with average levels of 23.0 mg L-1 and 1.78 mg L-1,respectively.
The future perspective is to increase the available data about the IPMA contents in wines also evaluating whether they could depend on year of production, colour, variety, etc.
In this sense, it would be of interest to downscale the extraction method in such a way to characterize a larger number of samples.
Conflict of Interests
References
Caprioli, C., Cahill, G. M., & James, K. J. (2014a). Mass fragmentation studies of
a-tomatine and validation of a liquid chromatography LTQ-Orbitrap Mass Spectrometry
Method for its quantification in Tomatoes. Food Analytical Methods, 7, 1565–1571.
Caprioli, G., Logrippo, S.., Cahill, M. G., & James, K. J. High-performance liquid
chromatography LTQ-Orbitrap mass spectrometry method for tomatidine and non-target
metabolites quantification in organic and normal tomatoes. (2014b). International Journal
of Food Science and Nutrition, 65, 942–947.
Caprioli, C., Nzekoue, F., Giusti, F., Vittori, S., & Sagratini G. (2018). Optimization of an
extraction method for the simultaneous quantification of sixteen polyphenols in thirty-one
pulse samples by using HPLC-MS/MS dynamic-MRM triple quadrupole. Food Chemistry,
266, 490-497.
Cooper, K. A., Chopra, M., & Thurnham, D. I. (2004). Wine polyphenols and promotion
of cardiac health. Nutrition Research Reviews, 17, 111–129.
Fantozzi, P., & Bergeret, J. (1973). Application de la chromatographie en phase gazeuse
(C.P.G.) altitude des acides organiques et des acides-phénol du vin. Industries Alimentaires
et Agricoles, 90, 731.
Ginjom, I., D’Arcy, B., Caffin, N., & Gidley, M. (2011). Phenolic compound profiles in
selected Queensland red wines at all stages of the wine-making process. Food Chemistry
Lamikanra, O., Inyang I. D., & Leong, S. (1995). Distribution and Effect of Grape
Maturity on Organic Acid Content of Red Muscadine Grapes. Journal of Agricultural and
Food Chemistry, 43, 3026-3028
Kennedy, J. A. (2008). Grape and wine phenolics: Observations and recent findings.
Ciencia E Investigacion Agraria, 35, 107–120.
Marobbio, C. M. T., Giannuzzi, G., Paradies, E., Pierri, C. L., & Palmieri, F. (2008).
α-Isopropylmalate, a Leucine Biosynthesis Intermediate in Yeast, Is Transported by the
Mitochondrial Oxalacetate Carrier. Journal of Biological Chemistry, 17, 283, 28445–
28453.
Monagas, M., Suarez, R., Gomez-Cordoves, C., & Bartolome, B. (2005). Simultaneous
determination of nonanthocyanin phenolic compounds in red wines by
HPLCDAD/ESI-MS. American Journal of Enology and Viticulture, 56, 139–147.
m/zCloud. Advanced Mass Spectral Database. https://www.mzcloud.org
Philip, T., & Nelson, F. E. (1973). A procedure for quantitative estimation of malic and
tartaric acid, of grape juice. Journal of Food Science, 38, 18-20.
Salucci, S., Burattini, S., Giordano, F. M., Lucarini, S., Diamantini, G., & Falcieri, E.
(2017). Further Highlighting on the Prevention of Oxidative Damage by Polyphenol-Rich
Wine Extracts. Journal of Medicinal Food, 20, 410–419.
Schreier, P., & Jennings, W. G. (1979). Flavor composition of wines: A review, C R C
Šeruga, M., Novak I., & Jakobek, L. (2011). Determination of polyphenols content and
antioxidant activity of some red wines by differential pulse voltammetry, HPLC and
spectrophotometric methods. Food Chemistry, 124, 1208–1216.
Skogerson, K., Runnebaum, R., Wohlgemuth, G., De Ropp, J., Heymann, H., & Fiehn, O. (2009). Comparison of Gas Chromatography-Coupled Time-of-Flight Mass Spectrometry and 1 H Nuclear Magnetic Resonance Spectroscopy Metabolite Identification in White Wines from a Sensory Study Investigating Wine Body. Journal of Agricultural and Food Chemistry, 57, 6899–6907.
Stahl, E., Laub, E., & Woller, R. (1974). Liquid-Chromatographie von Weinen und
Fruchtsäften. II. Probenvorbehandlung, quantitative Säurenanalysen und weitere
Praxisanwendungen. Z. Lebensm.Unters. Forsch., 156, 321-326.
Suzuki, T., Tamura, S., Nakanishi, H., Tashiro, M., Nishizawa, N. K., & Yoshimura, E.
(2007). Reduction of aluminum toxicity by 2-IPMAacid in the budding yeast
Saccharomyces cerevisiae. Biological Trace Element Research, 120, 257-263.
Teixeira, N., Mateus, N., de Freitas, V., & Oliveira, O. (2018). Wine industry by-product:
Full polyphenolic characterization of grape stalks. Food Chemistry, 268, 110–117.
Whiting, G. C. (1976). Organic acid metabolism of yeasts during fermentation of alcoholic
beverages. A review. Journal of the Institute of Brewing, 82, 84-92.
Wojdyło, A., Samoticha, J., Nowicka P., & Chmielewska, J. (2018). Characterisation of
(poly)phenolic constituents of two interspecific red hybrids of Rondo and Regent (Vitis
vinifera) by LC–PDA–ESI-MS QTof. Food Chemistry, 239, 94–101.
Figure captions Figure 1.
LC–IT chromatograms and spectra: a) Total ion chromatogram (TIC), b) Extract ion
chromatogram (EIC) of ion species at m/z 175; c) ESI full scan mass spectrum and d)
MS/MS spectrum (m/z 175 base peak).
Figure 2.
Figure 2a. LC-Q-Orbitrap spectra of a wine extract: A) MS2 spectrum of the first eluting
compound (3-IPMA, Retention time 7.47 min); B) MS2 spectrum of the second eluting
compound (2-IPMA, Retention time 8.10 min). Figure 2b. Left) MS2 spectrum of 3-IPMA
from m/zCloud database (A): MS2 experimental spectrum of 3-IPMA (C). Right: MS2
spectrum of 2-IPMA from m/zCloud database (A); MS2 experimental spectrum of 2-IPMA
(C). In the middle (B) the difference between the experimental and the m/zCloud spectra.
Figure 3.
LC–IT MS2 spectra of 2-IPMA (a) and 3-IPMA (b) recorded from individual solution of
the authentic standards with the same amplitude.
Figure 4.
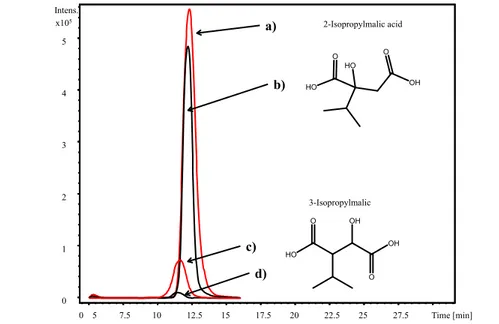
LC-IT MS2 chromatogram showing the overlapped EICs of: a) m/z 115 ion from the wine
sample, b) m/z 115 ion from the standard of 2-IPMA (0.16 mg/mL), c) m/z 73 ion from the
Table 1. Validation data: linearity range, LODs, LOQs, recoveries (Rec%) and
repeatability (RSD%) evaluated at two fortification levels (n=9) and matrix effect as signal suppression/enhancement (SSE %). Analyte Linearity Range (mg L-1) R2 LODa (mg L-) LOQb (mg L-1) Rec % (5 mg L-1) RSD% (5 mg L-1) Rec % (50 mg L-1) RSD% (50 mg L-1) Matrix effect (SSE %) 3-IPMA 5-320 0.9914 0.2 0.5 90.1 15.1 93.2 8.9 59 2-IPMA 5-320 0.9931 0.2 0.5 86.7 12.1 90.7 8.4 46
Table 2. Quantification of 3-IPMA and 2-IPMA (mg L-1) in ten Italian wine samples (± standard deviation, n=3).
N° Year Colour Type 3-IPMA
(mg L-1) 2-IPMA (mg L-1) 1 2010 Red Montepulciano 1.43 ± 0.09 18.9 ± 0.8 2 2016 Red Primitivo 1.87 ± 0.14 30.1 ± 0.8 3 2016 Red Merlot 4.13 ± 0.08 41.6 ± 1.1 4 2016 Red Lacrima 1.85 ± 0.03 28.1 ± 0.7 5 2017 Red Lacrima 1.87 ± 0.12 23.3 ± 1.3
Average content red wines 2.23 28.4
6 2017 White Verdicchio di
Matelica 2.42 ± 0.08 27.8 ± 0.5
7 2017 White Verdicchio dei
Castelli di Jesi 0.9 ± 0.06 10.4 ± 0.6
8 2017 White Valdobbiadene 1.16 ± 0.07 18.5 ± 0.8
9 2017 White Muller Thurgau 1.57 ± 0.15 24.3 ± 1.1
10 2017 White Primofiore 0.56 ± 0.07 6.7 ± 0.2
Average content white wines 1.32 17.5
Highlights
2- and 3-isopropyl malic acid were identified and quantified in wine Combined MS techniques were applied to achieve definitive identification An analytical method was developed and validated to quantify both isomers The average contents of the two acids were assessed in a group of ten wines
0 2 4 6 Intens. 0 1 2 3 x10⁷ 5 10 15 20 25 30 Time [min] x107 129 175 289 465 0 1 2 3 100 200 300 400 500 600 700 800 900 m/z x106 a) b) c)
A)
B)
C)
Figure 2b. Left) MS2spectrum of 3-IPMA from m/zCloud database (A): MS2experimental spectrum of 3-IPMA (C). Right: MS2spectrum of
2-IPMA from m/zCloud database (A); MS2experimental spectrum of 2-IPMA (C). In the middle (B) the difference between the experimental and
the m/zCloud spectra.
A)
B)
C) A)
B)
Figure 2a. LC-Q-Orbitrap spectra of a wine extract: A) MS2spectrum of the first eluting compound (3-IPMA, Retention time 7.47
Figure 3. LC–IT MS2spectra of 2-IPMA (a) and 3-IPMA (b) recorded from individual solution of the
authentic standards with the same amplitude. 85 115 129 131 157 0.0 0.2 0.4 0.6 0.8 1.0 x10⁴ Intens. 70 80 90 100 110 120 130 140 150 160 170 m/z 113 175 73 85 113 129 131 157 0 1000 2000 3000 4000 Intens. 70 80 90 100 110 120 130 140 150 160 170 m/z 175 a) b)
5 7.5 10 12.5 15 17.5 20 22.5 25 27.5 Time [min] 0 1 2 3 4 5 x10⁵ Intens. a) b) c) d)
Figure 4. LC-IT MS2chromatogram showing the overlapped EICs of: a) m/z 115 ion from the wine sample,
b) m/z 115 ion from the standard of 2-IPMA (0.16 mg/mL, ret time 12.4 min.), c) m/z 73 ion from the wine sample, d) m/z 73 ion from the standard of 3-IPMA (0.16 mg/mL, ret time 11.7 min.).
0 HO OH O O OH 3-Isopropylmalic OH O HO HO O 2-Isopropylmalic acid