Clinical phenotypes and outcome of patients
hospitalized for acute heart failure: the ESC
Heart Failure Long-Term Registry
Ovidiu Chioncel
1*
, Alexandre Mebazaa
2, Veli-Pekka Harjola
3, Andrew J. Coats
4,
Massimo Francesco Piepoli
5, Maria G. Crespo-Leiro
6, Cecile Laroche
7,
Petar M. Seferovic
8, Stefan D. Anker
9, Roberto Ferrari
10, Frank Ruschitzka
11,
Silvia Lopez-Fernandez
12, Daniela Miani
13, Gerasimos Filippatos
14, and
Aldo P. Maggioni
15, on behalf of the ESC Heart Failure Long-Term Registry
Investigators
1University of Medicine Carol Davila, Bucuresti; Institutul de Urgente Boli Cardiovasculare C.C. Iliescu, Bucuresti, Romania;2University Paris Diderot, Sorbonne Paris Cité, Paris, France; 4APHP, Department of Anaesthesia and Critical Care, Hôpitaux Universitaires Saint Louis-Lariboisière, Paris, France;3Emergency Medicine, Helsinki University, Department of Emergency Medicine and Services, Helsinki University Hospital, Helsinki, Finland;4Monash University, Australia and University of Warwick, Coventry, UK;5Heart Failure Unit, Cardiac Department, Guglielmo da Saliceto Hospital, AUSL Piacenza, Italy;6Unidad de Insuficiencia Cardiaca Avanzada y Trasplante Cardiaco, Complejo Hospitalario Universitario A Coruna (CHUAC), CIBERCV, La Coruna, Spain;7EURObservational Research Programme, European Society of Cardiology, Sophia Antipolis, France;
8Department of Internal Medicine, Belgrade University School of Medicine and Heart Failure Centre, Belgrade University Medical Centre, Belgrade, Serbia;9Innovative Clinical Trials, Department of Cardiology and Pneumology, University Medical Center Göttingen (UMG), Göttingen, Germany;10Department of Cardiology and LTTA Centre, University Hospital of Ferrara and Maria Cecilia Hospital, GVM Care and Research, ES Health Science Foundation, Cotignola, Italy;11Department of Cardiology, Heart Failure Clinic and Transplantation, University Heart Centre Zurich, Zurich, Switzerland;12Cardiology, Hospital Universitario Virgen de las Nieves, Granada, Spain;13Cardiology, University Hospital S. Maria della Misericordia, Udine, Italy;14National and Kapodistrian University of Athens, School of Medicine, University Hospital Attikon, Athens, Greece; and15ANMCO Research Center, Florence, Italy
Received 22 February 2017; revised 12 April 2017; accepted 15 April 2017 ; online publish-ahead-of-print 30 April 2017
Aims To identify differences in clinical epidemiology, in-hospital management and 1-year outcomes among patients
hospitalized for acute heart failure (AHF) and enrolled in the European Society of Cardiology Heart Failure Long-Term (ESC-HF-LT) Registry, stratified by clinical profile at admission.
... Methods
and results
The ESC-HF-LT Registry is a prospective, observational study collecting hospitalization and 1-year follow-up data from 6629 AHF patients. Among AHF patients enrolled in the registry, 13.2% presented with pulmonary oedema (PO), 2.9% with cardiogenic shock (CS), 61.1% with decompensated heart failure (DHF), 4.8% with hypertensive heart failure (HT-HF), 3.5% with right heart failure (RHF) and 14.4% with AHF and associated acute coronary syndromes (ACS-HF). The 1-year mortality rate was 28.1% in PO, 54.0% in CS, 27.2% in DHF, 12.8% in HT-HF, 34.0% in RHF and 20.6% in ACS-HF patients. When patients were classified by systolic blood pressure (SBP) at initial presentation,
1-year mortality was 34.8% in patients with SBP<85 mmHg, 29.0% in those with SBP 85–110 mmHg, 21.2% in
patients with SBP 110–140 mmHg and 17.4% in those with SBP>140 mmHg. These differences tended to diminish
in the months post-discharge, and 1-year mortality for the patients who survived at least 6 months post-discharge did not vary significantly by either clinical profile or SBP classification.
... Conclusion Rates of adverse outcomes in AHF remain high, and substantial differences have been found when patients were stratified by clinical profile or SBP. However, patients who survived at least 6 months post-discharge represent a more homogeneous group and their 1-year outcome is less influenced by clinical profile or SBP at admission.
...
Keywords Acute heart failure • Clinical profile • Outcomes
*Corresponding author. Institute of Emergency for Cardiovascular Diseases Prof. C.C. Iliescu, University of Medicine and Pharmacy Carol Davila, Bucuresti 950474, Romania. Tel: +40 745400498, Fax: +40 213175224, Email: [email protected]
Introduction
Acute heart failure (AHF) represents a broad spectrum of disease states, with heterogeneous clinical presentations, but commonly characterized by either a rapid onset or a progressive worsen-ing of signs and symptoms, requirworsen-ing immediate treatment and
leading to urgent hospitalization.1The initial clinical presentation
is more heterogeneous than the simple description “de novo or worsening heart failure (HF)”, and includes several distinct phe-notypes such as acutely decompensated HF (DHF), cardiogenic shock (CS), pulmonary oedema (PO), right HF (RHF), hyperten-sive HF (HT-HF) and HF in the setting of acute coronary
syn-dromes (ACS-HF).2 In addition to clinical profile classification,
several other classification schemes have been proposed by the European Society of Cardiology (ESC) guidelines, including clas-sification based on the level of systolic blood pressure (SBP) at
initial presentation in the emergency department3 and the most
recent one with phenotypes based on clinical signs of congestion
and/or hypoperfusion.1The identification of more distinct entities
with different clinical outcomes would help clinicians to address the immediate life-threatening medical condition and to direct treat-ment strategies more correctly by targeting specific underlying
conditions and precipitating factors,4 in order to create pathways
for better care of the spectrum of AHF patients.
Several large and well designed registries5–12 have been
cre-ated in recent years to describe more accurately the demographic, clinical, and therapeutic characteristics of AHF patients. However,
with very few exceptions,12,13the description of the clinical course
of AHF from prior registries was mainly restricted to the inpa-tient phase or the initial weeks post-discharge. Very often, these registries were not representative, being either a single country description, or having a limited number of centres or clinical set-tings.
The ESC Heart Failure Long-Term (ESC-HF-LT) Registry is
a permanent registry14,15 with systematic collection of 1-year
follow-up data, capturing the whole spectrum of AHF patients. The aim of the present analysis of the ESC-HF-LT Registry was to identify differences in clinical characteristics, in-hospital treatment and outcomes among AHF patients stratified according to well
specified clinical profiles within the overall descriptor of AHF.2
Methods
Study design and clinical setting
The ESC-HF-LT Registry is a prospective, multicentre, observational study of patients admitted to 211 cardiology centres (Appendix S1) from 21 European and Mediterranean countries, all members of the ESC. The number of participating centres per country was chosen in relation to the population of the country (one centre/2 million peo-ple, but no more than 25 centres per country) and centre selection took into account the geographical distribution of each country. More-over, the selection of centres allowed for a representation of each category of hospitals and hospital facilities according to the distribu-tion of the different types of medical centres in the individual country, approximately 20% of which should consist of centres providing car-diac surgery, 30% that do not provide carcar-diac surgery but do provide ...
...
...
interventional cardiology, and 50% community centres providing nei-ther cardiac surgery nor interventional cardiology.
Periodic consecutive enrollment has been used and patients were included ‘one day per week’. In this 1-year follow-up analysis, patient data of the best 12 consecutive recruitment months for each country were used for the analysis.
The survey was approved by each local Institutional Review Board according to the rules of each participating country. No data were collected before detailed information was provided to the patient and a signed informed consent was obtained.
The EURObservational Research Programme (EORP) Department was appointed to coordinate the project operationally, providing sup-port to the committees, national coordinators and participating cen-tres, and overseeing the implementation of the survey.
Patient population
The ESC-HF-LT Registry included all outpatients with chronic HF seen at the clinics and those admitted to hospital for AHF from selected centres. In the present analysis, all patients admitted for AHF, either de novo, or worsening of pre-existing HF, for whom intravenous (i.v.) therapy (inotropes, vasodilators, or diuretics) was needed, were included. There were no specific exclusion criteria, with the exception that all patients had to be older than 18 years.
A diagnosis of AHF was made by the clinician-investigators at initial presentation and required the presence of signs and symptoms of HF, evidence of cardiac dysfunction, and the need for i.v. therapy.14,15 Several training meetings were organized for the study investigators to assure consistency in definition and data collection, and for a random sample of 5% of centres, data source verification was performed by EORP monitors.
Patients were classified into the following six clinical profiles by the clinician-investigators at the time of presentation according to the 2008 ESC guidelines:2 DHF, CS, PO, RHF, HT-HF and ACS-HF (see Supplementary material online, Appendix S2). Another two clas-sifications, including SBP at presentation (<85 mmHg, 85–110 mmHg, 110–140 mmHg and>140 mmHg)3 and a classification based on the presence of clinical signs of congestion and/or hypoperfusion (no congestion and no hypoperfusion; congestion without hypoperfusion; hypoperfusion without congestion; hypoperfusion and congestion)1 were used for reporting in-hospital and 1-year adverse outcomes.
A follow-up visit 12 months after the entry visit was used to collect information on morbidity and mortality.
Data collection
All data including demographics, medical history, clinical presentation, laboratory results, inpatient management and in-hospital and 1-year outcomes were collected by chart review and entered into a centrally managed online database using a web-based electronic case report form. Automated electronic data checks were performed to prevent out-of-range or duplicate entries.
In-hospital outcome included all-cause mortality. One-year out-comes included 1-year mortality, 1-year HF readmissions and 1-year death or HF readmission. The cause of death was categorized as car-diac, vascular, non-cardiovascular, and unknown.16
Statistical analysis
Continuous variables were reported as mean ± SD, or as median and interquartile range. Among-group comparisons were made using a
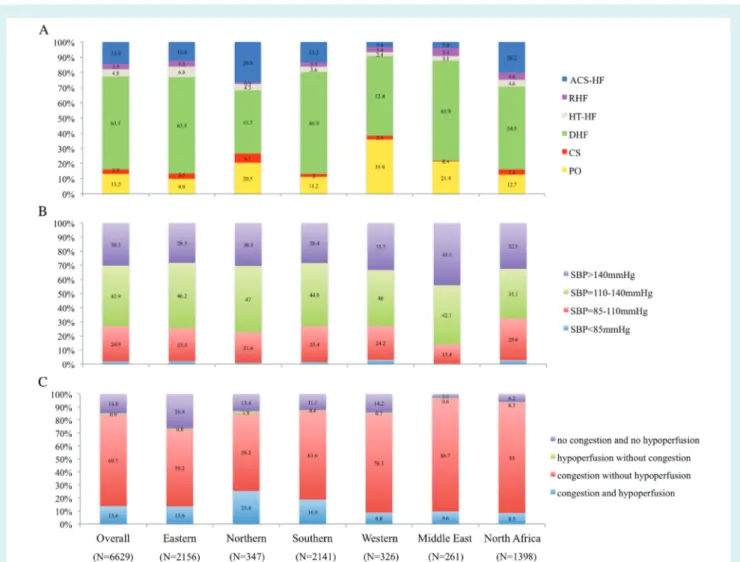
Figure 1 Classification of acute heart failure patients by geographical area. A: clinical profile classification by geographical area. B: systolic blood pressure (SBP) classification by geographical area. C: congestion/hypoperfusion classification by geographical area. ACS-HF, acute heart failure and associated acute coronary syndromes; CS, cardiogenic shock; DHF, decompensated heart failure; HT-HF, hypertensive heart failure; PO, pulmonary oedema; RHF, right heart failure.
non-parametric test (Kruskal–Wallis test). Categorical variables were reported as percentages and compared using chi-square test or Fisher’s exact test if any expected cell count was less than 5. For categorical variables with more than two possible values, exact P-values were estimated according to the Monte Carlo method. Univariable analysis was applied to both continuous and categorical variables.
Baseline characteristics and type of treatments were reported by clinical profile classification. In-hospital and 1-year post-discharge out-comes were also reported stratified by clinical profile, SBP classification and congestion/hypoperfusion. Plots of the Kaplan–Meier curves for time to all-cause death, time to HF hospitalization and time to all-cause death or HF hospitalization were performed for each clinical profile and for each SBP category. In addition to unadjusted Kaplan–Meier curves, Cox proportional hazard models with multivariable adjustment by clin-ical relevant variables such age, gender, chronic kidney disease, chronic obstructive pulmonary disease and cancer, have been performed.
Furthermore, for each outcome, Kaplan–Meier curves have been generated for a different time point (T0): moment of admission, 1 month post-discharge, and 3, 6 and 12 months post-discharge, and
...
outcomes in each group were compared using log-rank test. A Tukey’s adjustment of log-rank has been performed and all clinical profiles and SBP categories were pairwise compared for each time point and each outcome.
A two-sided P-value of<0.05 was considered statistically significant. All analyses were performed using SAS statistical software version 9.4 (SAS Institute, Inc., Cary, NC, USA).
Results
From April 2011 to June 2015, 16 012 patients were enrolled in the ESC-HF-LT Registry. Of these, 6629 patients (41.4% of the total database) were hospitalized with a primary diagnosis of AHF and 9383 patients (58.6%) were ambulatory patients with chronic HF. At 1 year, 411 AHF patients were lost to follow up, representing 6.2% of the study population. Median follow-up time was 378 (288–415) days.
Clinical classifications
Of the AHF patients enrolled in the registry, 13.2% presented with PO, 2.9% with CS, 61.1% with DHF, 4.8% with HT-HF, 3.5% with RHF, and 14.4% with ACS-HF.
The variation in classifications by geographical area is depicted in Figure 1. Considering SBP classification, 1.9% of
AHF patients presented with SBP <85 mmHg, 24.9% with SBP
85–110 mmHg, 42.9% with SBP 110–140 mmHg, and 30.3% with
SBP >140 mmHg. Phenotyping AHF patients by clinical signs of
congestion/hypoperfusion showed four mutually exclusive cate-gories: no congestion and no hypoperfusion (14.8%), congestion without hypoperfusion (69.7%), congestion and hypoperfusion (13.6%), and hypoperfusion without congestion (0.9%) (Figure 1).
Baseline characteristics and clinical
profiles on admission
The group with PO had the highest proportion of patients older than 75 years, while the proportion of females was highest in RHF, HT-HF and PO (Table 1).
Ischaemic aetiology was common in patients with CS (68.2%), while valvular aetiology was most frequent in RHF patients (27.0%). Large variations in reported aetiologies were noted in patients admitted with DHF (Table 1). Patients admitted with HT-HF and ACS-HF had fewer co-morbidities than patients with CS and RHF (Table 1).
At presentation, SBP differed markedly among clinical profiles and varied from 101.9 ± 29 mmHg in CS patients to 168.3 ± 31 mmHg in HT-HF patients. Patients with CS retained distinguishing clinical features in terms of low SBP and signs of hypoperfusion, while most of the clinical charac-teristics were similar in patients with PO and DHF. Patients presenting with RHF had a constellation of clinical signs,
including jugular venous pressure >6, peripheral oedema and
hepatomegaly.
Haemoglobin level<12 g/dL was found in 39% of patients and
was more frequently observed in patients admitted with RHF and CS. A significantly higher proportion of CS patients presented with
baseline renal dysfunction (creatinine>1.5 mg/dL). Hyperglycaemia
(blood glucose>120 mg/dL) at presentation was reported in 41%
of patients and in more than half of patients admitted with PO, CS and ACS-HF (Table 1).
A more elevated level of natriuretic peptides was found in patients with CS and PO compared with other clinical profiles. High troponin levels on admission were a distinctive feature of patients with ACS-HF and were also common in patients with CS and PO (Table 1).
The proportion of patients with atrial fibrillation (AF) varied widely between the clinical profiles, with the highest AF prevalence being documented in patients with RHF. A proportion of 26% of
patients had QRS duration >120 ms. QRS duration was larger
in patients with CS and DHF, and the prevalence of left bundle branch block was highest in PO patients. Particularly, for patients admitted with CS, a longer QT interval duration was noted
(Table 1). ...
...
...
During hospitalization, echocardiography was performed in 78.3% of patients. A proportion of 53.2% of patients had an
ejec-tion fracejec-tion (EF)<40%, 25.2% had EF 40–50% and 21.6% had EF
>50%. Mitral regurgitation was more often detected in patients
admitted with ACS-HF, DHF and CS, while tricuspid regurgitation was common in patients admitted with RHF (69.6%) (Table 1).
In-hospital management
The use of i.v. treatments and interventional procedures in the dif-ferent clinical profiles are reported in Table 2. In clinical profiles consistent with more severe HF, such as CS and PO, coronary angiography, percutaneous coronary intervention (PCI), coronary artery bypass graft (CABG) and intra-aortic balloon pump inser-tion were more frequently used.
In-hospital outcomes
The highest rate of in-hospital all-cause mortality was noted in CS patients (36.1%) and the lowest in HT-HF patients (1.8%) (Table 3). When patients were stratified by SBP at admission, the highest in-hospital mortality was observed in patients with
SBP <85 mmHg (26.6%) and the lowest in patients with SBP
>140 mmHg (2.7%). Considering the congestion/hypoperfusion
classification, the highest mortality was noted in patients with presence of both congestion and hypoperfusion signs (16.5%) and lowest in patients without congestion and without hypoperfusion (1.7%). Most of the in-hospital deaths were cardiac in origin.
For patients hospitalized with CS, of the total number of deaths during hospitalization, 49% occurred in the first 24 hours from presentation, while for patients with PO, 16.3% of deaths occurred in the first 24 hours. For the remaining clinical profiles, the rate of death in the first 24 hours represented less than 10% of total number of deaths occurring during hospitalization.
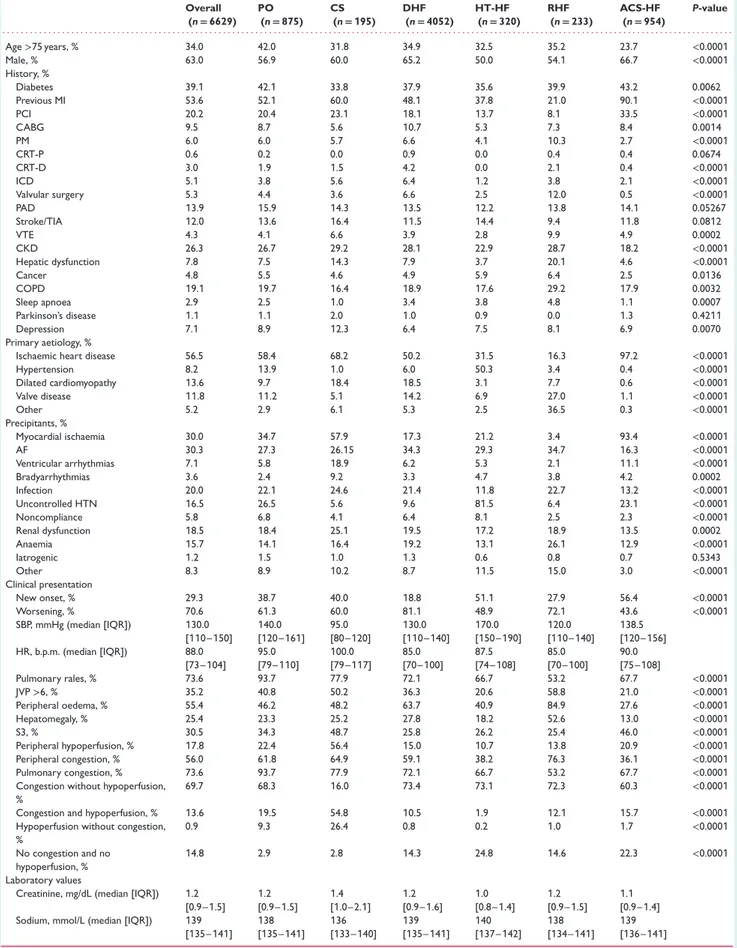
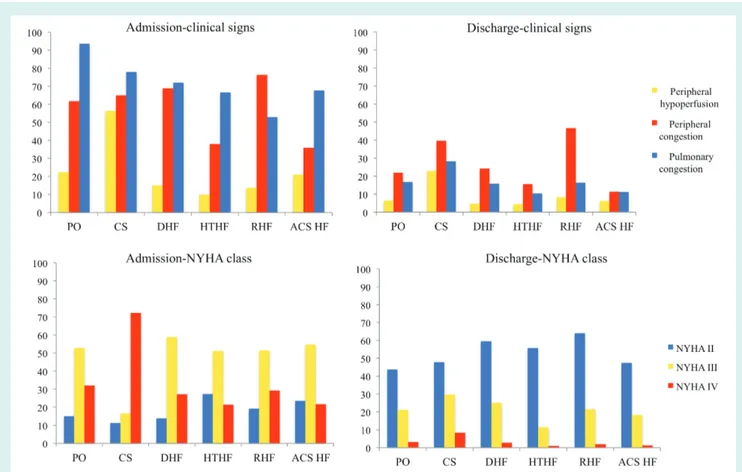
Between admission and discharge, New York Heart Association (NYHA) class and clinical signs and symptoms suggestive of HF showed substantial variation (Figure 2).
Of patients discharged alive, worsening renal function was doc-umented in 12.5% of patients, and it was reported more often in patients hospitalized for CS (21.0%). Patients classified as CS and RHF had more frequent hyponatraemia at discharge as compared with other clinical profiles (Table 3).
One-year outcomes
One-year mortality rate was 26.7% and 1-year HF hospitalization was 25.9% (Table 4). Cardiovascular deaths represented 57.2% of total deaths in the overall population. Similar to in-hospital mortal-ity, the highest 1-year mortality rate was observed in patients with CS (54.0%), low SBP at admission (34.8%) and in patients with both congestion and hypoperfusion (29.8%).
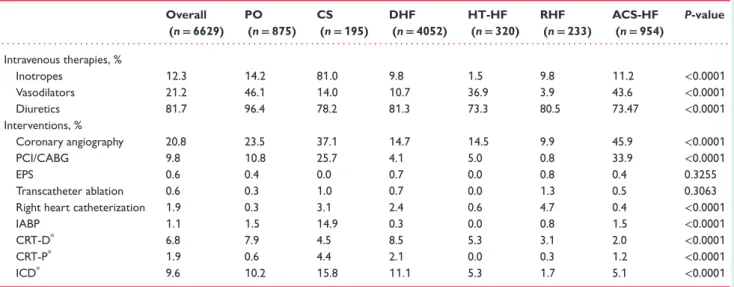
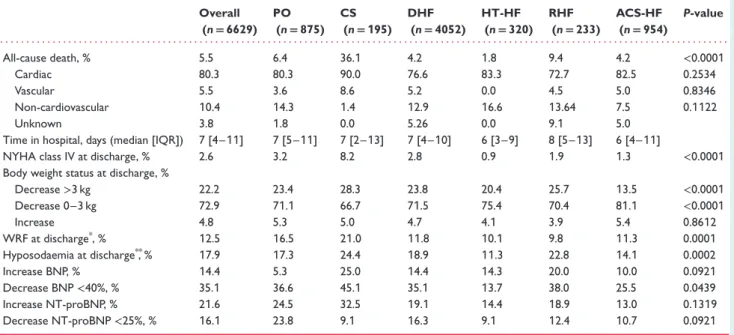
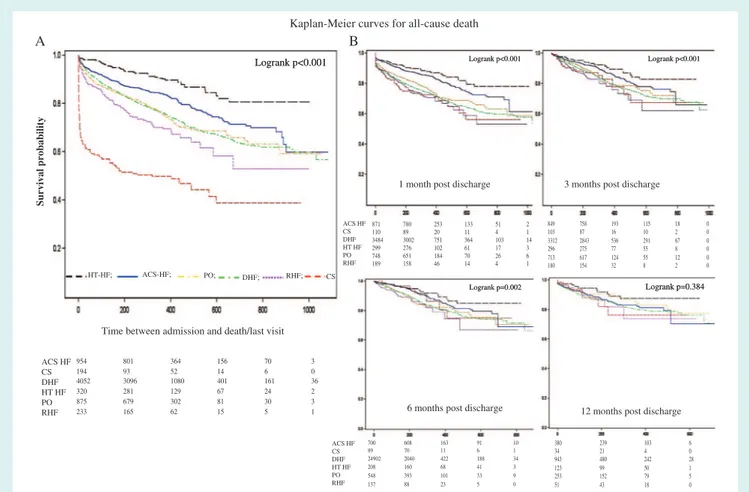
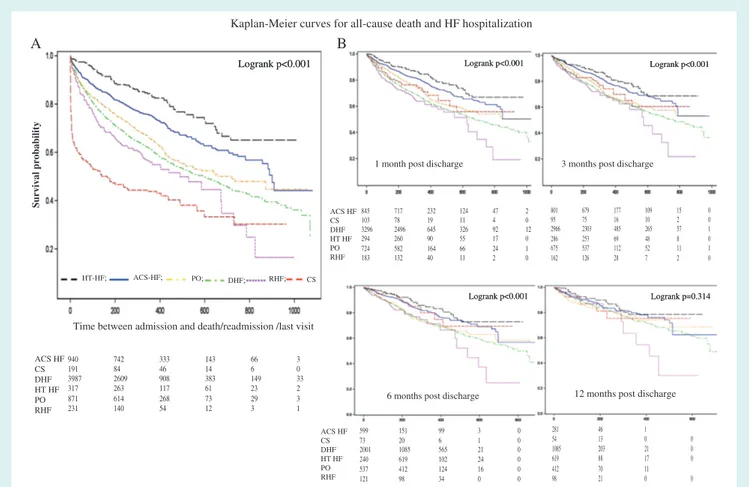
Figures 3 and 4 show the Kaplan–Meier curves for all-cause
mortality, and the combined event of all-cause mortality and HF hospitalization for AHF patients stratified by clinical profiles, at different time points (at admission, and 1, 3, 6 and 12 months post-discharge). One-year outcome rates of each clinical profile
Table 1 Epidemiology and baseline characteristics by clinical profile at admission Overall (n= 6629) PO (n= 875) CS (n= 195) DHF (n= 4052) HT-HF (n= 320) RHF (n= 233) ACS-HF (n= 954) P-value . . . . Age>75 years, % 34.0 42.0 31.8 34.9 32.5 35.2 23.7 <0.0001 Male, % 63.0 56.9 60.0 65.2 50.0 54.1 66.7 <0.0001 History, % Diabetes 39.1 42.1 33.8 37.9 35.6 39.9 43.2 0.0062 Previous MI 53.6 52.1 60.0 48.1 37.8 21.0 90.1 <0.0001 PCI 20.2 20.4 23.1 18.1 13.7 8.1 33.5 <0.0001 CABG 9.5 8.7 5.6 10.7 5.3 7.3 8.4 0.0014 PM 6.0 6.0 5.7 6.6 4.1 10.3 2.7 <0.0001 CRT-P 0.6 0.2 0.0 0.9 0.0 0.4 0.4 0.0674 CRT-D 3.0 1.9 1.5 4.2 0.0 2.1 0.4 <0.0001 ICD 5.1 3.8 5.6 6.4 1.2 3.8 2.1 <0.0001 Valvular surgery 5.3 4.4 3.6 6.6 2.5 12.0 0.5 <0.0001 PAD 13.9 15.9 14.3 13.5 12.2 13.8 14.1 0.05267 Stroke/TIA 12.0 13.6 16.4 11.5 14.4 9.4 11.8 0.0812 VTE 4.3 4.1 6.6 3.9 2.8 9.9 4.9 0.0002 CKD 26.3 26.7 29.2 28.1 22.9 28.7 18.2 <0.0001 Hepatic dysfunction 7.8 7.5 14.3 7.9 3.7 20.1 4.6 <0.0001 Cancer 4.8 5.5 4.6 4.9 5.9 6.4 2.5 0.0136 COPD 19.1 19.7 16.4 18.9 17.6 29.2 17.9 0.0032 Sleep apnoea 2.9 2.5 1.0 3.4 3.8 4.8 1.1 0.0007 Parkinson’s disease 1.1 1.1 2.0 1.0 0.9 0.0 1.3 0.4211 Depression 7.1 8.9 12.3 6.4 7.5 8.1 6.9 0.0070 Primary aetiology, %
Ischaemic heart disease 56.5 58.4 68.2 50.2 31.5 16.3 97.2 <0.0001
Hypertension 8.2 13.9 1.0 6.0 50.3 3.4 0.4 <0.0001 Dilated cardiomyopathy 13.6 9.7 18.4 18.5 3.1 7.7 0.6 <0.0001 Valve disease 11.8 11.2 5.1 14.2 6.9 27.0 1.1 <0.0001 Other 5.2 2.9 6.1 5.3 2.5 36.5 0.3 <0.0001 Precipitants, % Myocardial ischaemia 30.0 34.7 57.9 17.3 21.2 3.4 93.4 <0.0001 AF 30.3 27.3 26.15 34.3 29.3 34.7 16.3 <0.0001 Ventricular arrhythmias 7.1 5.8 18.9 6.2 5.3 2.1 11.1 <0.0001 Bradyarrhythmias 3.6 2.4 9.2 3.3 4.7 3.8 4.2 0.0002 Infection 20.0 22.1 24.6 21.4 11.8 22.7 13.2 <0.0001 Uncontrolled HTN 16.5 26.5 5.6 9.6 81.5 6.4 23.1 <0.0001 Noncompliance 5.8 6.8 4.1 6.4 8.1 2.5 2.3 <0.0001 Renal dysfunction 18.5 18.4 25.1 19.5 17.2 18.9 13.5 0.0002 Anaemia 15.7 14.1 16.4 19.2 13.1 26.1 12.9 <0.0001 Iatrogenic 1.2 1.5 1.0 1.3 0.6 0.8 0.7 0.5343 Other 8.3 8.9 10.2 8.7 11.5 15.0 3.0 <0.0001 Clinical presentation New onset, % 29.3 38.7 40.0 18.8 51.1 27.9 56.4 <0.0001 Worsening, % 70.6 61.3 60.0 81.1 48.9 72.1 43.6 <0.0001 SBP, mmHg (median [IQR]) 130.0 [110–150] 140.0 [120–161] 95.0 [80–120] 130.0 [110–140] 170.0 [150–190] 120.0 [110–140] 138.5 [120–156] HR, b.p.m. (median [IQR]) 88.0 [73–104] 95.0 [79–110] 100.0 [79–117] 85.0 [70–100] 87.5 [74–108] 85.0 [70–100] 90.0 [75–108] Pulmonary rales, % 73.6 93.7 77.9 72.1 66.7 53.2 67.7 <0.0001 JVP>6, % 35.2 40.8 50.2 36.3 20.6 58.8 21.0 <0.0001 Peripheral oedema, % 55.4 46.2 48.2 63.7 40.9 84.9 27.6 <0.0001 Hepatomegaly, % 25.4 23.3 25.2 27.8 18.2 52.6 13.0 <0.0001 S3, % 30.5 34.3 48.7 25.8 26.2 25.4 46.0 <0.0001 Peripheral hypoperfusion, % 17.8 22.4 56.4 15.0 10.7 13.8 20.9 <0.0001 Peripheral congestion, % 56.0 61.8 64.9 59.1 38.2 76.3 36.1 <0.0001 Pulmonary congestion, % 73.6 93.7 77.9 72.1 66.7 53.2 67.7 <0.0001
Congestion without hypoperfusion, %
69.7 68.3 16.0 73.4 73.1 72.3 60.3 <0.0001
Congestion and hypoperfusion, % 13.6 19.5 54.8 10.5 1.9 12.1 15.7 <0.0001
Hypoperfusion without congestion, % 0.9 9.3 26.4 0.8 0.2 1.0 1.7 <0.0001 No congestion and no hypoperfusion, % 14.8 2.9 2.8 14.3 24.8 14.6 22.3 <0.0001 Laboratory values
Creatinine, mg/dL (median [IQR]) 1.2 [0.9–1.5] 1.2 [0.9–1.5] 1.4 [1.0–2.1] 1.2 [0.9–1.6] 1.0 [0.8–1.4] 1.2 [0.9–1.5] 1.1 [0.9–1.4] Sodium, mmol/L (median [IQR]) 139
[135–141] 138 [135–141] 136 [133–140] 139 [135–141] 140 [137–142] 138 [134–141] 139 [136–141]
Table 1 Continued Overall (n= 6629) PO (n= 875) CS (n= 195) DHF (n= 4052) HT-HF (n= 320) RHF (n= 233) ACS-HF (n= 954) P-value . . . .
Glycaemia, mg/dL (median [IQR]) 110 [93–150] 128 [100–188] 124 [100–179] 106 [90–138] 110 [93–150] 105 [91–147] 120 [98–171] Haemoglobin, g/dL (median [IQR]) 12.7
[11.2–14.1] 12.4 [11.0–13.9] 12.6 [10.7–14.0] 12.6 [11.1–14.0] 12.9 [11.5–14.1] 11.7 [10.2–13.6] 13.2 [11.9–14.4] BNP, pg/mL (median [IQR]) (available for 701 pts) 765 [355–1398] 969 [516–1502] 1719 [692–2134] 805 [376–1492] 493 [218–872] 578 [286–912] 680 [350–1398] NT-proBNP, pg/mL (median [IQR])
(available for 1599 pts) 3825 [1658–8960] 6044 [2523–12317] 5000 [2220–9809] 3872 [1674–8839] 2125 [982–4510] 2096 [1023–9970] 2537 [1114–6364] Troponin, mg/L (median [IQR])
(available for 2895 pts) 0.10 [0.03–0.37] 0.10 [0.04–1.0] 0.77 [0.08–27.0] 0.06 [0.02–0.20] 0.10 [0.02–0.10] 0.04 [0.02–0.10] 0.35 [0.30–4.60] ECG AF, % 42.7 38.8 34.8 48.5 39.4 54.9 21.4 <0.0001 QRS duration, ms (mean ± SD) 109.6 ± 30 107.1 ± 28 110.4 ± 31 113.1 ± 31 101.0 ± 25 105.6 ± 29 102.2 ± 26 <0.0001 QT duration, ms (mean ± SD) 376.9 ± 72 378.3 ± 73 385.4 ± 67 380.8 ± 71 369.5 ± 70 362.2 ± 82 365.6 ± 74 <0.0001 LBBB, % 15.0 18.6 16.7 16.3 9.8 5.1 10.3 <0.0001 Echo EF, % (mean ± SD) 39.2 ± 14.5 39.9 ± 14.7 34.8 ± 14.0 37.3 ± 14.3 50.9 ± 13.7 49.1 ± 13.3 40.3 ± 12.5 <0.0001 EF<40%, % 53.2 52.0 67.3 58.8 20.6 22.7 48.0 <0.0001 EF 40–50%, % 25.2 24.9 18.0 22.6 26.1 31.3 34.4 <0.0001 EF>50%, % 21.6 23.1 14.7 18.5 53.4 46.0 17.7 <0.0001 Mitral regurgitation, % 45.9 41.0 42.8 47.8 36.2 31.0 49.6 <0.0001 Tricuspid regurgitation, % 35.4 26.1 34.0 40.2 21.6 69.6 22.9 <0.0001
ACS-HF, acute heart failure and associated acute coronary syndromes; AF, atrial fibrillation; BNP, brain natriuretic peptide; CABG, coronary artery bypass graft; CKD, chronic kidney disease; COPD, chronic obstructive pulmonary disease; CRT, cardiac resynchronization therapy; CS, cardiogenic shock; DHF, decompensated heart failure; EF, ejection fraction; HR, heart rate; HT-HF, hypertensive heart failure; HTN, hypertension; ICD, implantable cardioverter-defibrillator; IQR, interquartile range; JVP, jugular venous pressure; LBBB, left bundle branch block; MI, myocardial infarction; NT-proBNP,
N-terminal proBNP; PAD, peripheral artery disease; PCI, percutaneous coronary intervention; PM, pacemaker; PO, pulmonary oedema; RHF, right heart failure; SBP, systolic blood pressure; VTE, venous
thromboembolism; TIA, transient ischemic attack.
Table 2 Intravenous vasoactive therapies and interventions during hospitalization
Overall (n= 6629) PO (n= 875) CS (n= 195) DHF (n= 4052) HT-HF (n= 320) RHF (n= 233) ACS-HF (n= 954) P-value . . . . Intravenous therapies, % Inotropes 12.3 14.2 81.0 9.8 1.5 9.8 11.2 <0.0001 Vasodilators 21.2 46.1 14.0 10.7 36.9 3.9 43.6 <0.0001 Diuretics 81.7 96.4 78.2 81.3 73.3 80.5 73.47 <0.0001 Interventions, % Coronary angiography 20.8 23.5 37.1 14.7 14.5 9.9 45.9 <0.0001 PCI/CABG 9.8 10.8 25.7 4.1 5.0 0.8 33.9 <0.0001 EPS 0.6 0.4 0.0 0.7 0.0 0.8 0.4 0.3255 Transcatheter ablation 0.6 0.3 1.0 0.7 0.0 1.3 0.5 0.3063
Right heart catheterization 1.9 0.3 3.1 2.4 0.6 4.7 0.4 <0.0001
IABP 1.1 1.5 14.9 0.3 0.0 0.8 1.5 <0.0001
CRT-D* 6.8 7.9 4.5 8.5 5.3 3.1 2.0 <0.0001
CRT-P* 1.9 0.6 4.4 2.1 0.0 0.3 1.2 <0.0001
ICD* 9.6 10.2 15.8 11.1 5.3 1.7 5.1 <0.0001
ACS-HF, acute heart failure and associated acute coronary syndromes; CABG, coronary artery bypass graft; CRT, cardiac resynchronization therapy; CS, cardiogenic shock; DHF, decompensated heart failure; EPS, electrophysiological study; HT-HF, hypertensive heart failure; IABP, intra-aortic balloon pump; ICD, implantable cardioverter-defibrillator; PO, pulmonary oedema; RHF, right heart failure.
*CRT-D, CRT-P and ICD are mutually exclusive terms.
have been pairwise compared for each outcome at each time point (see Supplementary material online, Table S1). Adjusted Cox proportional hazard models for each outcome are presented in the Supplementary material online, Table S2.
When analysis of Kaplan–Meier curves was performed between
6 and 12 months post-discharge, all six clinical profiles have ...
comparable 1-year outcomes. Patients with CS showed the highest 1-year mortality rate during hospitalization and the first month after discharge. Patients with HT-HF and ACS-HF had the lowest 1-year Kaplan–Meier mortality regardless of the time point of analysis. Kaplan–Meier curves performed without these two clinical profiles showed no significant differences in 1-year
Table 3 In-hospital outcomes Overall (n= 6629) PO (n= 875) CS (n= 195) DHF (n= 4052) HT-HF (n= 320) RHF (n= 233) ACS-HF (n= 954) P-value . . . . All-cause death, % 5.5 6.4 36.1 4.2 1.8 9.4 4.2 <0.0001 Cardiac 80.3 80.3 90.0 76.6 83.3 72.7 82.5 0.2534 Vascular 5.5 3.6 8.6 5.2 0.0 4.5 5.0 0.8346 Non-cardiovascular 10.4 14.3 1.4 12.9 16.6 13.64 7.5 0.1122 Unknown 3.8 1.8 0.0 5.26 0.0 9.1 5.0
Time in hospital, days (median [IQR]) 7 [4–11] 7 [5–11] 7 [2–13] 7 [4–10] 6 [3–9] 8 [5–13] 6 [4–11]
NYHA class IV at discharge, % 2.6 3.2 8.2 2.8 0.9 1.9 1.3 <0.0001
Body weight status at discharge, %
Decrease>3 kg 22.2 23.4 28.3 23.8 20.4 25.7 13.5 <0.0001 Decrease 0–3 kg 72.9 71.1 66.7 71.5 75.4 70.4 81.1 <0.0001 Increase 4.8 5.3 5.0 4.7 4.1 3.9 5.4 0.8612 WRF at discharge*, % 12.5 16.5 21.0 11.8 10.1 9.8 11.3 0.0001 Hyposodaemia at discharge**, % 17.9 17.3 24.4 18.9 11.3 22.8 14.1 0.0002 Increase BNP, % 14.4 5.3 25.0 14.4 14.3 20.0 10.0 0.0921 Decrease BNP<40%, % 35.1 36.6 45.1 35.1 13.7 38.0 25.5 0.0439 Increase NT-proBNP, % 21.6 24.5 32.5 19.1 14.4 18.9 13.0 0.1319 Decrease NT-proBNP<25%, % 16.1 23.8 9.1 16.3 9.1 12.4 10.7 0.0921
ACS-HF, acute heart failure and associated acute coronary syndromes; BNP, brain natriuretic peptide; CS, cardiogenic shock; DHF, decompensated heart failure; HT-HF, hypertensive heart failure; IQR, interquartile range; NT-proBNP, N-terminal proBNP; NYHA, New York Heart Association; PO, pulmonary oedema; RHF, right heart failure; WRF, worsening renal function.
*Serum creatinine difference between hospitalization and discharge>0.3. **Na<135 mEq/L.
all-cause mortality between PO, DHF, RHF and CS patients, even from 1-month post-discharge (see Supplementary material online,
Figure S1).
A similar analysis has been performed for SBP categories (see Supplementary material online, Figures S2 and S3), showing that between 6 and 12 months post-discharge there were no significant differences in subsequent 1-year mortality among the four SBP categories.
For 1-year HF hospitalization, 6-month post-discharge analysis showed reduced differences among clinical profiles and SBP groups, and at 1-year post-discharge there were no differences in out-comes among all clinical profiles and SBP groups.
Discussion
The present analysis describes the classification of patients with AHF, covering the entire spectrum of patients with AHF. Classi-fication of AHF patients may facilitate an early decision-making regarding appropriate triage and targeted treatment of high-risk populations.
Although DHF was the most common clinical presentation,
similar to other registries,6–10,14 considerable differences in the
prevalence of clinical profiles have been found across geographical regions. Furthermore, when considering other classification schemes, such as the most recent one based on congestion and hypoperfusion, substantial geographical variability has been found. The explanations for these geographical differences may be ‘investigator-related’ and ‘system-related’. ‘Investigator-related’ ...
...
differences reflect variations in interpreting the definitions and different cultural perceptions of severity with different thresholds for hospital admissions, whereas ‘system-related’ differences are due to the absence of objective criteria for hospital admission, as well as differences in patterns of medical care across regions. In contrast to clinical profile and congestion/hypoperfusion classifica-tions, the classification based on initial SBP shows less geographic variation supporting its larger applicability in clinical practice.
Our analysis shows that different clinical profiles may have similar
clinical presentations, making the 2008 ESC clinical classification2
challenging. Similar to other studies,17,18an elevated SBP at
admis-sion and signs of pulmonary congestion are common findings at presentation in PO, DHF and HT-HF patients, leading to misclassi-fication and overlap between these AHF phenotypes.
Patients with CS were significantly different from the other clinical profiles for all clinical characteristics and should therefore
be considered separately.19In CS patients, overall utilization of i.v.
inotropes during hospitalization (81.0%) exceeds the proportion of patients presenting with hypoperfusion signs at admission (56.4%).
However, clinical signs vary rapidly during presentation20 and for
some CS patients, hypoperfusion signs may not be apparent at presentation and become manifest later during hospitalization, suggesting ongoing clinical worsening despite the use of initial therapies.
Right HF was also distinguishable from the other scenarios in terms of clinical characteristics and high 1-year readmissions (48.3%). The clinical picture is dominated by signs of systemic
congestion (jugular venous pressure >6, peripheral oedema
Figure 2 New York Heart Association (NYHA) class and clinical signs: variation between admission and discharge for each clinical profile. ACS-HF, acute heart failure and associated acute coronary syndromes; CS, cardiogenic shock; DHF, decompensated heart failure; HT-HF, hypertensive heart failure; PO, pulmonary oedema; RHF, right heart failure.
filling and/or reduced right ventricular output.21 Furthermore,
patients with RHF have many co-morbidities, which may prevent the optimization of HF evidence-based therapies. Addressing non-cardiac co-morbidities may be particularly important, since a vast proportion of re-hospitalizations are not HF-related.
The ESC-HF-LT Registry is one of the few registries to describe AHF in the setting of ACS, and its reported prevalence of 14.4%
was similar to that found in the Italian IN-HF Outcome registry.9
ACS-HF patients present with clinical signs indicative of high left ventricular filling pressures (pulmonary rales, S3 sound, mitral regurgitation murmur) suggesting the impact of acute ischaemia on diastolic and systolic properties of the left ventricle.
The prevalence of moderate-to-severe mitral and tricuspid
regurgitation is similar to that reported in previous registries.12
Dif-ferent from chronic settings, the prevalence of mitral and tricuspid regurgitation may be overestimated in AHF. During hospitalization, the severity of functional regurgitation may decrease as a result of decongestive therapies.
In-hospital management
The type and proportions of vasoactive medications, stratified by clinical profile, are similar to those reported by other contem-porary registries,5–10,18except for i.v. inotropes. The ESC-HF-LT ...
Registry shows a lower use of i.v. inotropes in non-CS patients compared to previous registries.
Although ischaemic heart disease is by far the most common aetiology of AHF, coronary angiography and PCI/CABG were performed only in 21% and 10% of patients. Furthermore, even in patients classified as ACS-HF, coronary angiography and PCI/CABG were performed in 45.9% and 33.9% of patients, suggesting large
variations in available facilities,22 as well as variations in guideline
adherence across the participating centres.
The proportion of patients with cardiac resynchronization therapy/cardioverter-defibrillator implants is similar to other
studies.22 Although guidelines do not recommend to implant
devices during acute decompensation, several patients may derive benefit from in-hospital screening targeting device implantation during hospitalization. Further research is necessary to clarify the optimal timing of device implantation during hospitalization or soon after discharge among AHF patients.
In-hospital outcomes
The highest mortality rates were observed in patients with CS,
in those with SBP<85 mmHg, and in patients presenting with both
congestion and hypoperfusion signs. Notably, in-hospital and 1-year
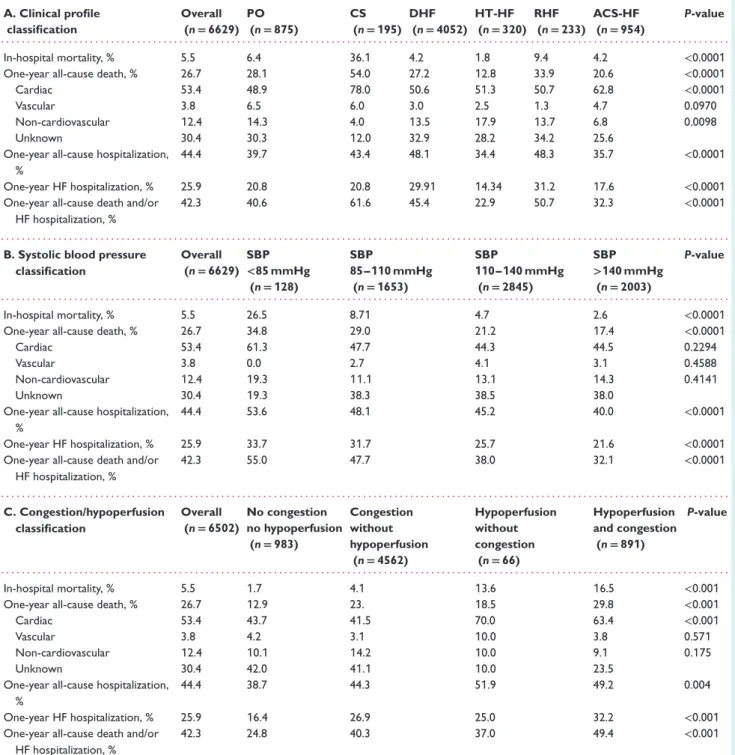
Table 4 One-year outcome rate by different classifications of acute heart failure A. Clinical profile classification Overall (n= 6629) PO (n= 875) CS (n= 195) DHF (n= 4052) HT-HF (n= 320) RHF (n= 233) ACS-HF (n= 954) P-value . . . . In-hospital mortality, % 5.5 6.4 36.1 4.2 1.8 9.4 4.2 <0.0001
One-year all-cause death, % 26.7 28.1 54.0 27.2 12.8 33.9 20.6 <0.0001
Cardiac 53.4 48.9 78.0 50.6 51.3 50.7 62.8 <0.0001
Vascular 3.8 6.5 6.0 3.0 2.5 1.3 4.7 0.0970
Non-cardiovascular 12.4 14.3 4.0 13.5 17.9 13.7 6.8 0.0098
Unknown 30.4 30.3 12.0 32.9 28.2 34.2 25.6
One-year all-cause hospitalization, %
44.4 39.7 43.4 48.1 34.4 48.3 35.7 <0.0001
One-year HF hospitalization, % 25.9 20.8 20.8 29.91 14.34 31.2 17.6 <0.0001
One-year all-cause death and/or HF hospitalization, %
42.3 40.6 61.6 45.4 22.9 50.7 32.3 <0.0001
. . . .
B. Systolic blood pressure classification Overall (n= 6629) SBP <85 mmHg (n= 128) SBP 85–110 mmHg (n= 1653) SBP 110–140 mmHg (n= 2845) SBP >140 mmHg (n= 2003) P-value . . . . In-hospital mortality, % 5.5 26.5 8.71 4.7 2.6 <0.0001
One-year all-cause death, % 26.7 34.8 29.0 21.2 17.4 <0.0001
Cardiac 53.4 61.3 47.7 44.3 44.5 0.2294
Vascular 3.8 0.0 2.7 4.1 3.1 0.4588
Non-cardiovascular 12.4 19.3 11.1 13.1 14.3 0.4141
Unknown 30.4 19.3 38.3 38.5 38.0
One-year all-cause hospitalization, %
44.4 53.6 48.1 45.2 40.0 <0.0001
One-year HF hospitalization, % 25.9 33.7 31.7 25.7 21.6 <0.0001
One-year all-cause death and/or HF hospitalization, % 42.3 55.0 47.7 38.0 32.1 <0.0001 . . . . C. Congestion/hypoperfusion classification Overall (n= 6502) No congestion no hypoperfusion (n= 983) Congestion without hypoperfusion (n= 4562) Hypoperfusion without congestion (n= 66) Hypoperfusion and congestion (n= 891) P-value . . . . In-hospital mortality, % 5.5 1.7 4.1 13.6 16.5 <0.001
One-year all-cause death, % 26.7 12.9 23. 18.5 29.8 <0.001
Cardiac 53.4 43.7 41.5 70.0 63.4 <0.001
Vascular 3.8 4.2 3.1 10.0 3.8 0.571
Non-cardiovascular 12.4 10.1 14.2 10.0 9.1 0.175
Unknown 30.4 42.0 41.1 10.0 23.5
One-year all-cause hospitalization, %
44.4 38.7 44.3 51.9 49.2 0.004
One-year HF hospitalization, % 25.9 16.4 26.9 25.0 32.2 <0.001
One-year all-cause death and/or HF hospitalization, %
42.3 24.8 40.3 37.0 49.4 <0.001
ACS-HF, acute heart failure and associated acute coronary syndromes; CS, cardiogenic shock; DHF, decompensated heart failure; HF, heart failure; HT-HF, hypertensive heart failure; PO, pulmonary oedema; RHF, right heart failure; SBP, systolic blood pressure.
or in the group with both congestion and hypoperfusion signs, suggesting that general metabolic compromise and multi-organ failure, characteristic of CS, have distinct pathways beyond SBP and hypoperfusion, and may be responsible for the excess mortality.
For patients admitted with CS, 49% of in-hospital deaths occurred in the first 24 hours from presentation,
suggest-ing that early identification of hypoperfusion signs, as well as ...
appropriateness of initial therapies, may be potentially life-saving in this setting.
NYHA class and residual congestive signs and symptoms at discharge varied across clinical profiles, indicating different entities
with different responses to AHF therapies,23 and suggesting that
future clinical trials in hospitalized HF patients should take into
Survival
probability
ACS-HF; DHF; CS
HT-HF; PO; RHF;
Time between admission and death/last visit Logrank p<0.001
Logrank p<0.001 Logrank p<0.001Logrank p<0.001 Logrank p<0.001Logrank p<0.001
Logrank p=0.002
Logrank p=0.002 Logrank p=0.384Logrank p=0.384
12 months post discharge 6 months post discharge
3 months post discharge 1 month post discharge
A B 700 608 163 91 10 89 70 11 6 1 24902 2040 422 188 34 208 160 68 41 3 548 393 101 33 9 137 88 23 5 0 380 239 103 6 34 21 4 0 943 480 242 28 123 99 50 1 253 152 79 5 51 43 18 0 871 780 253 133 51 2 110 89 20 11 4 1 3484 3002 751 364 103 14 299 276 102 61 17 3 748 651 184 70 26 6 189 158 46 14 4 1 849 758 193 115 18 0 103 87 16 10 2 0 3312 2843 536 291 67 0 296 275 77 55 8 0 713 617 124 55 12 0 180 154 32 8 2 0 954 801 364 156 70 3 194 93 52 14 6 0 4052 3096 1080 401 161 36 320 281 129 67 24 2 875 679 302 81 30 3 233 165 62 15 5 1 ACS HF CS DHF HT HF PO RHF
Kaplan-Meier curves for all-cause death
ACS HF CS DHF HT HF PO RHF ACS HF CS DHF HT HF PO RHF
Figure 3 Kaplan–Meier curves for all-cause death at different time points: at admission (A), and at 1, 3, 6, and 12 months post-discharge (B). ACS-HF, acute heart failure and associated acute coronary syndromes; CS, cardiogenic shock; DHF, decompensated heart failure; HT-HF, hypertensive heart failure; PO, pulmonary oedema; RHF, right heart failure.
One-year outcomes
Similar to previous registries,25–28 1-year outcome rates of each
clinical profile considered by the ESC-HF-LT Registry remain unac-ceptably high, confirming that hospitalization for AHF represents a change in the trajectory of the disease process. This finding can be explained by the fact that in-hospital therapeutic approaches to these patients have remained practically unchanged during the last few decades.
In the ESC-HF-LT Registry, the proportion of cardiovascular deaths (57.5%) is lower than in the ESC-HF Pilot study (66%) and lower than in the Italian IN-HF Outcome registry (71%).
Present data reveal that 20% of patients are discharged despite persistent signs and symptoms of HF. A negligible decrease or an increase in body weight suggest a possible failure to relieve clini-cal congestion during index hospitalization, which may potentially contribute to the high post-discharge event rate in the registry. Furthermore, for some AHF patients, natriuretic peptide levels do not decrease, or decrease insufficiently during hospitalization. Although the complete mechanisms are unknown, an insufficient decrease or re-elevation of natriuretic peptides during hospital-ization suggests residual haemodynamic congestion as a result of
suboptimal treatment.29 ...
The highest rate of 1-year death was observed in patients admit-ted with CS, and the highest rate of 1-year HF re-hospitalization was noted in patients with RHF. Patients with HT-HF and ACS-HF had the best survival during hospitalization and throughout the follow-up. These patients presented with high or normal SBP, had a lower index of non-cardiac co-morbidities, and were discharged with minimal residual congestion, better NYHA class and better renal function when compared to other clinical profiles. Further-more, identification of aetiological factors and precipitants, as well as aetiological treatment (coronary interventions or hypertension treatment) is easier in these two clinical profiles.
Differences in 1-year outcome among clinical profiles and SBP categories depend on the time of the analysis. In particular, when performed later after discharge, differences in outcome rates among clinical profiles tend to disappear, and all clinical profiles have comparable 1-year outcomes between 6 and 12 months post-discharge. ACS-HF and HT-HF patients tend to equalize 1-year mortality rate of CS patients after 6 months post-discharge. A similar finding was found when 1-year outcomes were compared among SBP categories, and after 6 months post-discharge, no differences in 1-year outcome were noted.
This finding can be relevant for future clinical trials enrolling patients hospitalized for AHF at different time intervals
Survival
probabilit
y
Time between admission and death/readmission /last visit
e g r a h c s i d t s o p s h t n o m 3 e g r a h c s i d t s o p h t n o m 1
6 months post discharge 12 months post discharge Logrank p<0.001
Logrank p<0.001 Logrank p<0.001Logrank p<0.001 Logrank p<0.001Logrank p<0.001
Logrank p<0.001
Logrank p<0.001 Logrank p=0.314Logrank p=0.314
ACS HF CS DHF HT HF PO RHF
A
B
ACS-HF; DHF; CS HT-HF; PO; RHF; 940 742 333 143 66 3 191 84 46 14 6 0 3987 2609 908 383 149 33 317 263 117 61 23 2 871 614 268 73 29 3 231 140 54 12 3 1 845 717 232 124 47 2 103 78 19 11 4 0 3296 2496 645 326 92 12 294 260 90 55 17 0 724 582 164 66 24 1 183 132 40 11 2 0 801 679 177 109 15 0 95 75 16 10 2 0 2966 2303 485 265 57 1 286 253 69 48 8 0 675 537 112 52 11 1 162 126 28 7 2 0 599 151 99 3 0 73 20 6 1 0 2001 1085 565 21 0 240 619 102 24 0 537 412 124 16 0 121 98 34 0 0 281 46 1 54 13 0 0 1085 203 21 0 619 88 17 0 412 70 11 98 21 0 0Kaplan-Meier curves for all-cause death and HF hospitalization
ACS HF CS DHF HT HF PO RHF ACS HF CS DHF HT HF PO RHF
Figure 4 Kaplan–Meier curves for all-cause death and heart failure (HF) re-hospitalization at different time points: at admission (A), and at 1, 3, 6, and 12 months post-discharge (B).
ACS-HF, acute heart failure and associated acute coronary syndromes; CS, cardiogenic shock; DHF, decompensated heart failure; HT-HF, hypertensive heart failure; PO, pulmonary oedema; RHF, right heart failure.
post-discharge. When testing a novel therapy during HF hos-pitalization or in the first months post-discharge, the investigators should be aware of the differences in outcome rates among AHF
clinical profiles or SBP categories.30 Patients who have survived
6 months post-discharge represent a more uniform group, and their subsequent 1-year outcome rate is less influenced by clinical profile or SBP classification at admission.
Limitations
Although AHF criteria and classification are well established in the ESC guidelines and provided to the investigators, the AHF diagnosis and clinical profile assignment were made at the point of care by each clinician-investigator, without central confirmation, potentially resulting in incomplete or inaccurate classification. The reliability of classification (i.e. agreement between two or more study investigators) was not assessed in this study and needs further investigation. Absence of the restricting criteria to grade severity of pulmonary congestion may have resulted in inconsistent classification and overlap between PO and HT-HF patients.
There was no central committee to adjudicate the causes of
death and type of re-hospitalization. ...
The registry included only patients from cardiology departments or specialized HF units, and the extent to which the findings from this study can be generalized to other populations is unclear.
Conclusions
The ESC-HF-LT Registry demonstrates the importance of sys-tematic characterization of AHF patients during their in-hospital course. Classifying AHF patients on the basis of clinical rel-evant data may mediate improvements in quality of care and outcomes.
Rates of adverse outcomes in patients admitted for AHF remain very high, both in-hospital and during the follow-up period, and substantial differences were found when patients were stratified by clinical profile, SBP, or congestion/hypoperfusion phenotypes. However, differences in 1-year outcome rates tend to diminish in the first few months post-discharge, and 1-year outcome rates of patients following 6 months after discharge did not vary significantly by clinical profile or SBP at admission, suggesting extinction of the initial acute process leading to decompensation and homogeneity in the long-term course.
Supplementary Information
Additional Supporting Information may be found in the online version of this article:
Appendix S1. Committee and Investigators.
Appendix S2. Clinical profiles at presentation according to the 2008 ESC guidelines.
Table S1. Pairwise comparison by Tukey’s adjustment for each outcome at each time point.
Table S2. Adjusted Cox regression analysis for each outcome; 1-year all-cause death, 1-year HF hospitalizations, 1-year all-cause death or HF hospitalizations.
Figure S1. Kaplan–Meier survival curves for all-cause death (excluding patients with ACS-HF and HT-HF) at admission, and at 1, 3, 6 and 12 months post-discharge.
Figure S2. Kaplan–Meier survival curves for all-cause death for SBP categories at admission, and at 1, 3, 6 and 12 months post-discharge.
Figure S3. Kaplan–Meier curves for all-cause death and HF hospitalization for SBP categories at admission, and at 1, 3, 6 and 12 months post-discharge.
Acknowledgements
Registry Executive Committee and Steering Committee of the EURObservational Research Programme (EORP). Data collec-tion was conducted by the EORP Department from the ESC by Emanuela Fiorucci as Project Officer, Gerard Gracia as Data Man-ager. Statistical analyses were performed by Cecile Laroche. Overall activities were coordinated and supervised by Dr Aldo P. Maggioni (EORP Scientific Coordinator). All investigators are listed in the Supplementary material online, Appendix S1.
Funding
Since the start of EORP, the following companies have sup-ported the programme: Abbott Vascular Int. (2011–2014), Amgen Cardiovascular (2009–2018), AstraZeneca (2014–2017), Bayer AG (2009–2018), Boehringer Ingelheim (2009–2019), Boston Scientific (2009–2012), The Bristol Myers Squibb and Pfizer Alliance (2011–2016), The Alliance Daiichi Sankyo Europe GmbH and Eli Lilly and Company (2011–2017), Edwards (2016–2019), Gedeon Richter Plc. (2014–2017), Menarini Int. Op. (2009–2012), MSD-Merck & Co. (2011–2014), Novartis Pharma AG (2014–2017), ResMed (2014–2016), Sanofi (2009–2011), SERVIER (2009–2018).
Conflict of interest: S.D.A. reports personal fees from Car-diorentis, BRAHMS GmbH, and Novartis, from null, during the conduct of the study. O.C. reports grants from Vifor, Novartis, Servier, outside the submitted work. M.G.C.-L.o reports grants and personal fees from Novartis, personal fees from AstraZeneca, out-side the submitted work. F.R. reports grants and personal fees from St. Jude Medical, Servier, Zoll, AstraZeneca, Sanofi, Cardiorentis, Novartis, Amgen, BMS, Pfizer, Fresenius, Vifor, outside the sub-mitted work. A.M. reports personal fees from Novartis, Orion, Roche, Servier, Cardiorentis, Zs Pharma, grants and personal fees ...
...
...
from Abbott, Adrenomed, grants from MyCartis, Critical Diagnos-tics, outside the submitted work. A.P.M. reports personal fees from Bayer, Cardiorentis, Novartis, outside the submitted work. A.J.C. reports personal fees from Respicardia, Servier, Vifor, outside the submitted work. R.F. reports that he received honorarium from Servier for steering committee membership consulting and speak-ing, and support for travel to study meetings from Servier, and personal fees from Boehringer-Ingelheim, Novartis, Merck Serono, Irbtech; finally, he is a stockholder in Medical Trials Analysis. G.F. Filippatos reports he was Committee member of trials and reg-istries sponsored from Bayer, Novartis, Servier, Vifor, outside the submitted work. All other has nothing to disclose.
References
1. Ponikowski P, Voors AA, Anker SD, Bueno H, Cleland JG, Coats AJ, Falk V, González-Juanatey JR, Harjola VP, Jankowska EA, Jessup M, Linde C, Nihoy-annopoulos P, Parissis JT, Pieske B, Riley JP, Rosano GM, Ruilope LM, Ruschitzka F, Rutten FH, van der Meer P. 2016 ESC Guidelines for the diagnosis and treat-ment of acute and chronic heart failure The Task Force for the diagnosis and treatment of acute and chronic heart failure of the European Society of Car-diology (ESC). Developed with the special contribution of the Heart Failure Association (HFA) of the ESC. Eur J Heart Fail 2016;18:891–975.
2. Dickstein K, Cohen-Solal A, Filippatos G, McMurray JJ, Ponikowski P, Poole-Wilson PA, Strömberg A, van Veldhuisen DJ, Atar D, Hoes AW, Keren A, Mebazaa A, Nieminen M, Priori SG, Swedberg K. ESC Guidelines for the diagnosis and treatment of acute and chronic heart failure 2008: the Task Force for the Diagnosis and Treatment of Acute and Chronic Heart Failure 2008 of the European Society of Cardiology. Developed in collaboration with the Heart Failure Association of the ESC (HFA) and endorsed by the European Society of Intensive Care Medicine (ESICM). Eur Heart J 2008;29:2388–2442. 3. McMurray JJ, Adamopoulos S, Anker SD, Auricchio A, Böhm M, Dickstein K, Falk
V, Filippatos G, Fonseca C, Gomez-Sanchez MA, Jaarsma T, Køber L, Lip GY, Maggioni AP, Parkhomenko A, Pieske BM, Popescu BA, Rønnevik PK, Rutten FH, Schwitter J, Seferovic P, Stepinska J, Trindade PT, Voors AA, Zannad F, Zeiher A; ESC Committee for Practice Guidelines. ESC Guidelines for the diagnosis and treatment of acute and chronic heart failure 2012: The Task Force for the Diagnosis and Treatment of Acute and Chronic Heart Failure 2012 of the European Society of Cardiology. Developed in collaboration with the Heart Failure Association (HFA) of the ESC. Eur J Heart Fail 2012;14:803–869. 4. Ambrosy AP, Fonarow GC, Butler J, Chioncel O, Greene SJ, Vaduganathan M,
Nodari S, Lam CS, Sato N, Shah AN, Gheorghiade M The global health and economic burden of hospitalizations for heart failure—lessons learned from hospitalized heart failure registries. J Am Coll Cardiol 2014;63:1123–1133. 5. Zannad F, Mebazaa A, Juillière Y, Cohen-Solal A, Guize L, Alla F, Rougé P, Blin
P, Barlet MH, Paolozzi L, Vincent C, Desnos M, Samii K; EFICA Investigators. Clinical profile, contemporary management and one-year mortality in patients with severe acute heart failure syndromes: the EFICA study. Eur J Heart Fail 2006;8:697–705.
6. Follath F, Yilmaz MB, Delgado JF, Parissis JT, Porcher R, Gayat E, Burrows N, McLean A, Vilas-Boas F, Mebazaa A. Clinical presentation, management and outcomes in the Acute Heart Failure Global Survey of Standard Treatment (ALARM-HF). Intensive Care Med 2011;37:619–626.
7. Spinar J, Parenica J, Vitovec J, Widimsky P, Linhart A, Fedorco M, Malek F, Cihalik C, Spinarova L, Miklik R, Felsoci M, Bambuch M, Dusek L, Jarkovsky J. Baseline characteristics and hospital mortality in the Acute Heart Failure Database (AHEAD) Main registry. Crit Care 2011;15:R291.
8. Chioncel O, Vinereanu D, Datcu M, Ionescu DD, Capalneanu R, Brukner I, Dorobantu M, Ambrosy A, Macarie C, Gheorghiade M. The Romanian Acute Heart Failure Syndromes (RO-AHFS) registry. Am Heart J 2011;162:142–153. 9. Oliva F, Mortara A, Cacciatore G, Chinaglia A, Di Lenarda A, Gorini M, Metra
M, Senni M, Maggioni AP, Tavazzi L; IN-HF Outcome Investigators. Acute heart failure patient profiles, management and in-hospital outcome: results of the Italian Registry on Heart Failure Outcome. Eur J Heart Fail 2012;14:1208–1217. 10. Logeart D, Isnard R, Resche-Rigon M, Seronde MF, de Groote P, Jondeau G,
Galinier M, Mulak G, Donal E, Delahaye F, Juilliere Y, Damy T, Jourdain P, Bauer F, Eicher JC, Neuder Y, Trochu JN; Heart Failure of the French Society of Cardiology. Current aspects of the spectrum of acute heart failure syndromes in a real-life setting: the OFICA study. Eur J Heart Fail 2013;15:465–476.
11. Cleland JG, Swedberg K, Follath F, Komajda M, Cohen-Solal A, Aguilar JC, Dietz R, Gavazzi A, Hobbs R, Korewicki J, Madeira HC, Moiseyev VS, Preda I, van Gilst WH, Widimsky J, Freemantle N, Eastaugh J, Mason J; Study Group on Diagnosis of the Working Group on Heart Failure of the European Society of Cardiology. The EuroHeart failure survey programme—a survey on the quality of care among patients with heart failure in Europe. Part 1: patient characteristics and diagnosis.
Eur Heart J 2003;24:442–463.
12. Nieminen MS, Brutsaert D, Dickstein K, Drexler H, Follath F, Harjola VP, Hochadel M, Komajda M, Lassus J, Lopez-Sendon JL, Ponikowski P, Tavazzi L; EuroHeart Survey Investigators; Heart Failure Association, European Society of Cardiology. EuroHeart Failure Survey II (EHFS II): a survey on hospitalized acute heart failure patients: description of population. Eur Heart J 2006;27:2725–2736. 13. Siirilä-Waris K, Lassus J, Melin J, Peuhkurinen K, Nieminen MS, Harjola VP; FINN-AKVA Study Group. Characteristics, outcomes, and predictors of 1-year mortality in patients hospitalized for acute heart failure. Eur Heart J 2006;27:3011–3017.
14. Maggioni AP, Anker SD, Dahlstrom U, Filippatos G, Ponikowski P, Zannad F, Amir O, Chioncel O, Leiro MC, Drozdz J, Erglis A, Fazlibegovic E, Fonseca C, Fruhwald F, Gatzov P, Goncalvesova E, Hassanein M, Hradec J, Kavoliuniene A, Lainscak M, Logeart D, Merkely B, Metra M, Persson H, Seferovic P, Temizhan A, Tousoulis D, Tavazzi L; Heart Failure Association of the ESC. Are hospitalized or ambulatory patients with heart failure treated in accordance with European Society of Cardiology guidelines? Evidence from 12,440 patients of the ESC Heart Failure Long-Term Registry. Eur J Heart Fail 2013;15:1173–1184.
15. Crespo-Leiro MG, Anker SD, Maggioni AP, Coats AJ, Filippatos G, Ruschitzka F, Ferrari R, Piepoli MF, Delgado Jimenez JF, Metra M, Fonseca C, Hradec J, Amir O, Logeart D, Dahlström U, Merkely B, Drozdz J, Goncalvesova E, Hassanein M, Chioncel O, Lainscak M, Seferovic PM, Tousoulis D, Kavoliuniene A, Fruhwald F, Fazlibegovic E, Temizhan A, Gatzov P, Erglis A, Laroche C, Mebazaa A. European Society of Cardiology Heart Failure Long-Term Registry (ESC-HF-LT): 1-year follow-up outcomes and differences across regions. Eur J
Heart Fail 2016;18:613–625.
16. Hicks KA, Tcheng JE, Bozkurt B, Chaitman BR, Cutlip DE, Farb A, Fonarow GC, Jacobs JP, Jaff MR, Lichtman JH, Limacher MC, Mahaffey KW, Mehran R, Nissen SE, Smith EE, Targum SL. 2014 ACC/AHA key data elements and definitions for cardiovascular endpoint events in clinical trials: a report of the American College of Cardiology/American Heart Association Task Force on Clinical Data Standards (Writing Committee to Develop Cardiovascular Endpoints Data Standards).
Circulation 2015;132:302–361.
17. Chioncel O, Ambrosy AP, Bubenek S, Filipescu D, Vinereanu D, Petris A, Christodorescu R, Macarie C, Gheorghiade M, Collins SP; Romanian Acute Heart Failure Syndromes Study Investigators. Epidemiology, pathophysiology, and in-hospital management of pulmonary edema: data from the Roma-nian Acute Heart Failure Syndromes registry. J Cardiovasc Med 2016;17: 92–104.
18. Parissis JT, Nikolaou M, Mebazaa A, Ikonomidis I, Delgado J, Vilas-Boas F, Paraskevaidis I, Mc Lean A, Kremastinos D, Follath F. Acute pulmonary oedema: clinical characteristics, prognostic factors, and in-hospital management. Eur J
Heart Fail 2010;12:1193–1202.
19. Harjola VP, Lassus J, Sionis A, Køber L, Tarvasmäki T, Spinar J, Parissis J, Banaszewski M, Silva-Cardoso J, Carubelli V, Di Somma S, Tolppanen H, Zeymer U, Thiele H, Nieminen MS, Mebazaa A; CardShock Study Investigators; GREAT Network. Clinical picture and risk prediction of short-term mortality in cardio-genic shock. Eur J Heart Fail 2015;17:501–509.
20. Mebazaa A, Pang PS, Tavares M, Collins SP, Storrow AB, Laribi S, Andre S, Mark Courtney D, Hasa J, Spinar J, Masip J, Frank Peacock W, Sliwa K, ...
...
Gayat E, Filippatos G, Cleland JG, Gheorghiade M. The impact of early standard therapy on dyspnoea in patients with acute heart failure: the URGENT-dyspnoea study. Eur Heart J 2010;31:832–841.
21. Harjola VP, Mebazaa A, ˇCelutkien˙e J, Bettex D, Bueno H, Chioncel O, Crespo-Leiro MG, Falk V, Filippatos G, Gibbs S, Leite-Moreira A, Lassus J, Masip J, Mueller C, Mullens W, Naeije R, Nordegraaf AV, Parissis, Riley JP, Ristic A, Rosano G, Rudiger A, Ruschitzka F, Seferovic P, Sztrymf B, Vieillard-Baron A, Yilmaz MB. Contemporary management of acute right ventricular failure: a state-ment from the Heart Failure Association and the Working Group on Pulmonary Circulation and Right Ventricular Function of the European Society of Cardiology.
Eur J Heart Fail 2016;18:226–241.
22. Maggioni AP, Dahlström U, Filippatos G, Chioncel O, CrespoLeiro M, Drozdz J, Fruhwald F, Gullestad L, Logeart D, Metra M, Parissis J, Persson H, Ponikowski P, Rauchhaus M, Voors A, Wendelboe Nielsen O, Zannad F, Tavazzi L; Heart Failure Association of the ESC (HFA). EURObservational Research Programme: the Heart Failure Pilot Survey (ESC-HF Pilot). Eur J Heart Fail 2010;12:1076–1084. 23. Gheorghiade M, Follath F, Ponikowski P, Barsuk JH, Blair JE, Cleland JG, Dickstein
K, Drazner MH, Fonarow GC, Jaarsma T, Jondeau G, Sendon JL, Mebazaa A, Metra M, Nieminen M, Pang PS, Seferovic P, Stevenson LW, van Veldhuisen DJ, Zannad F, Anker SD, Rhodes A, McMurray JJ, Filippatos G; European Society of Cardiology; European Society of Intensive Care Medicine. Assessing and grading congestion in acute heart failure: a scientific statement from the Acute Heart Failure Committee of the Heart Failure Association of the European Society of Cardiology and endorsed by the European Society of Intensive Care Medicine.
Eur J Heart Fail 2010;12:423–433.
24. Vaduganathan M, Butler J, Roessig L, Fonarow GC, Greene SJ, Metra M, Cotter G, Kupfer S, Zalewski A, Sato N, Filippatos G, Gheorghiade M. Clinical trials in hospitalized heart failure patients: targeting interventions to optimal phenotypic subpopulations. Heart Fail Rev 2015;20:393–400.
25. Maggioni AP, Dahlstrom U, Filippatos G, Chioncel O, CrespoLeiro M, DrozdzJFruhwald F, Gullestad L, Logeart D, Fabbri G, Urso R, Metra M, Parissis J, Persson H, Ponikowski P, Rauchhaus M, Voors AA, Nielsen OW, Zannad F, Tavazzi L; Heart Failure Association of the European Society of Cardiology (HFA). EURObservational Research Programme: regional differences and 1-year follow-up results of the Heart Failure Pilot Survey (ESC-HF Pilot). Eur J Heart
Fail 2013;15:808–817.
26. Tavazzi L, Senni M, Metra M, Gorini M, Cacciatore G, Chinaglia A, Di Lenarda A, Mortara A, Oliva F, Maggioni AP; IN-HF (Italian Network on Heart Failure) Outcome Investigators. Multicenter prospective observational study on acute and chronic heart failure: one-year follow-up results of IN-HF (Italian Network on Heart Failure) Outcome Registry. Circ Heart Fail 2013;6:473–481.
27. Harjola VP, Follath F, Nieminen MS, Brutsaert D, Dickstein K, Drexler H, Hochadel M, Komajda M, Lopez-Sendon JL, Ponikowski P, Tavazzi L. Char-acteristics, outcomes, and predictors of mortality at 3 months and 1 year in patients hospitalized for acute heart failure. Eur J Heart Fail 2010;12: 239–248.
28. Parenica J, Spinar J, Vitovec J, Widimsky P, Linhart A, Fedorco M, Vaclavik J, Miklik R, Felsoci M, Horakova K, Cihalik C, Malek F, Spinarova L, Belohlavek J, Kettner J, Zeman K, Dušek L, Jarkovsky J; AHEAD Main Investigators. Long-term survival following acute heart failure: The Acute Heart Failure Database-Main registry (AHEAD Main). Eur J Intern Med 2013;24:151–160.
29. Chioncel O, Collins SP, Greene SJ, Ambrosy AP, Vaduganathan M, Macarie C, Butler J, Gheorghiade M. Natriuretic peptide-guided management in heart failure.
J Cardiovasc Med 2016;17:556–568.
30. Hamo CE, Butler J, Gheorghiade M, Chioncel O. The bumpy road to drug development for acute heart failure. Eur Heart J 2016;18(Suppl G):G19–G32.