i
DECLARATION
I hereby declare that this submission is my own work and that, to the best of my knowledge and belief, it contains no material previously published or written by another person nor material which to a substantial extent has been accepted for the award of any other degree or diploma of the university or other institute of higher learning, except where due acknowledgment has been made in the text.
Camerino, March 2019
i
International School of Advanced Studies
Doctoral Course in Life and Health Sciences
Curriculum: Molecular Biology and Cellular Biotechnology
PhD thesis
Genes and Genomes in Ciliates:
• Gene expression analysis in Tetrahymena
thermophila under stress conditions
• Approach to the characterization of the germline
(micronuclear) genome in Euplotes crassus
March 2019
Candidate:
Supervisors:
Angela Piersanti
Prof. Cristina Miceli
Series and year of attendance:
Prof. Sandra Pucciarelli
096523 XXXI cycle
i
Acknowledgements
This study was carried out in the molecular and cellular biology laboratory (head of the laboratory Prof. Cristina Miceli) at the University of Camerino (Italy). The toxicology study was performed in the Laboratory of Environmental Toxicology (head of the laboratory Prof. Anne Kahru) of the National Institute of Chemical Physics and Biophysics, Tallinn, (Estonia). The pilot RNA sequencing study was performed in the Protozoan Functional Genomics laboratory (head of the laboratory Prof. Wei Miao) at the Institute of Hydrobiology, Chinese Academy of Sciences in Wuhan (China). Most of the transformation experiments were performed in the Epigenetic Mechanisms of Complex Genome Editing in Eukaryotes Laboratory (head of the laboratory Prof. Mariusz Nowacki), Institute of Cell Biology, University of Bern (Switzerland). The work was supported by the International School of Advanced Studies of the University of Camerino, the European Cooperation in Science and Technology (COST) action BM1102 “Ciliates as model systems to study genome evolution, mechanisms of non-Mendelian inheritance, and their roles in environmental adaptation”, and last but not least by the Marine Microbiology Initiative (MMI, funded by Gordon and Betty Moore foundation) in the frame of a project in collaboration with the University of Bern and the University of Connecticut (USA).
First and foremost, I am grateful to my supervisors Prof. Cristina Miceli and Prof. Sandra Pucciarelli, not only for giving me the opportunity to be a member of the research group, but also for the intellectual guidance, encouragement and valuable suggestions. I would like to thank especially Rachele Cesaroni, Dr. Matteo Mozzicafreddo, Dr. Patrizia Ballarini, Piero Saltalamacchia, Dr. Daniela Sparvoli, Dr. Kesava Priyan, Maria Sindhura John, Dr. Nagothu Joseph Amruthraj, Qin Di, Alessio Mancini and Francesca Papi, from our laboratory. I also want to thank other members of the International School of Advanced Studies at University of Camerino and of the School of Bioscience and Veterinary Medicine for their help and support during these years: Prof. Roberto Ciccocioppo, Dr. Cristina Soave, Prof. Anna Maria Eleuteri, Dr. Massimiliano Cuccioloni, Prof. Luca A. Vitali, Dr. Dezemona Petrelli, Roberto Rosati, Prof Guido Favia, Prof. Irene Ricci, Dr. Alessia Cappelli, Dr. Claudia Damiani, Dr. Matteo Valzano, Dr. Dario Pediconi and Dr. Maura Montani.
I would like to express my gratitude to Dr. Katre Juganson for her great help during my stay in Tallinn.
ii
I wish to thank Prof. Wei Miao, Jing Zhang, Wei Wei, Kangping Zhao and Dr. Miao Tien for the warm and supportive atmosphere in Wuhan.
I am thankful to Prof. Mariusz Nowacki that gave me the opportunity to join his laboratory and to work with Prof. Estienne C. Swart, Rachele Cesaroni, Dr. Iwona Rzeszutek and Dr. Xyrus Maurer-Alcalá. I also want to thank all the members of his laboratory for creating a friendly and stimulating context. I also gratefully acknowledge Prof. Lawrence. A. Klobutcher (University of Connecticut Health Center) for his precious advice and support in the frame of the MMI project.
Finally, I am very thankful to my family and all my friends for the support and understanding.
iii
Table of contents
Preface ... 1
Chapter 1 ... 8
1.0 Differential gene expression analysis in the freshwater
ciliate Tetrahymena thermophila under stress by silver
nanoparticles ... 8
1.1 Introduction and aims ... 9
1.2 Experimental procedures ... 12
1.2.1 Chemicals ... 12
1.2.2 T. thermophila strain CU428 culture ... 13
1.2.3 Toxicity test ... 14
1.2.4 Exposure of T. thermophila to silver compounds ... 14
1.2.5 RNA isolation ... 15
1.2.6 RNA sequencing and bioinformatic analysis ... 15
1.2.7 Gene expression validation ... 16
1.2.8 Data analysis ... 17
1.3 Results and discussion ... 18
1.3.1 Toxicity test ... 18
1.3.2 Differentially expressed genes (DEGs) ... 20
1.3.3 Gene Set Enrichment Analysis (GSEA) ... 29
1.3.4 Generation of oxidative stress by AgNPs ... 32
1.3.5 Gene expression validation ... 36
1.4 Conclusions ... 41
1.5 References ... 41
iv
2.0
Isolation
of
Euplotes
crassus
micronuclear
chromosomes by Pulsed Field Gel Electrophoresis ... 52
2.1 Introduction and aims ... 53
2.2 Results ... 58
2.2.1 E. crassus micronuclear chromosomes isolation by PFGE ... 58
2.2.2 IES PCR and Tec 2 PCR ... 60
2.2.3 Quantitative PCR ... 62
2.2.4 Illumina sequencing results ... 63
2.3 Discussion ... 64
2.4 Conclusions ... 65
2.5 Experimental procedures ... 66
2.5.1 E. crassus cultivation ... 66
2.5.2 E. crassus micronuclear chromosomes isolation by PFGE ... 66
2.5.3 Genomic DNA extraction ... 68
2.5.4 IES PCR and Tec 2 PCR ... 68
2.5.5 Quantitative PCR ... 70
2.5.6 Data analysis ... 71
2.6 References ... 71
Additional Project ... 77
A-1. Transfection approaches in Euplotes ... 77
A-1.1 Introduction and aims ... 78
A-1.2 Euplotes as organism of study ... 80
A-1.3 Transfection vectors ... 81
A-1.3.1 Delivery controls ... 81
A-1.3.2 Resistance marker ... 81
v
A-1.4 Transfection approaches ... 85
A-1.4.1 Biolistic ... 85
A-1.4.2 Microinjection ... 85
A-1.4.3 Electroporation ... 87
A-1.4.4 Lipofectamine® Transfection Reagent (Invitrogen) ... 87
A-1.4.5 Effectene Transfection Reagent (QIAGEN) ... 88
A-1.4.6 FuGENE HD Transfection Reagent (Promega) ... 89
A-1.5 Conclusions ... 89
vi
List of figures
Figure 1. Fluorescence microscopy image of Euplotes crassus ... 2
Figure 2. A schematic diagram of the organisation of T. thermophila ... 3
Figure 3. The Tetrahymena life cycle. ... 4
Figure 4. Viability of T. thermophila strain CU428 upon exposure to Ag compounds .. 19
Figure 5. Images of live T. thermophila cells after 2 h and 24 h incubation . ... 20
Figure 6. The MDS plot ... 21
Figure 7. Histogram showing the number of DEGs in each compared group ... 22
Figure 8. Venn diagram showing DEGs among the four treatments. ... 23
Figure 9. Heatmaps of all DEGs between different treatment groups ... 25
Figure 10. Collargol-specific GO term enrichment analysis of DEGs ... 30
Figure 11. AgNO3 and Collargol shared GO term enrichment analysis of DEGs ... 31
Figure 12. AgNO3-specific specific GO term enrichment analysis of DEGs ... 31
Figure 13. Heatmaps of DEGs of two top scored Biological Processes ... 33
Figure 14. Number of DEGs with known and unknown function ... 35
Figure 15. Heatmap illustrating the expression level of several DEGs ... 38
Figure 16. The mRNA relative expression levels detected by qPCR ... 39
Figure 17. Correlation between qPCR and RNA sequencing results ... 40
Figure 18. Schematic representation resulting from the KEGG Mapper ... 40
Figure 19. Excision of lESs and Tec elements in E. crassus ... 55
Figure 20. Types of DNA processing and their developmental timing ... 56
Figure 21. PFGE gel, 70s (1) run ... 59
Figure 22. PFGE gel, 70s (3) run ... 59
Figure 23. 1% agarose gel with IES PCR products separation ... 61
Figure 24. 1 % agarose gel with Tec 2 PCR products separation ... 61
Figure 25. qPCR result ... 63
Figure 26. Schematic representation of expected fragments IES 144+ and IES 144- .... 68
Figure 27. Schematic representation of the expected fragments IES 300+ and IES ... 69
Figure 28. Schematic representation of IES 144 internal amplicon... 70
Figure 29. GFP artificial nanochromosome (940 bp) map and sequence ... 82
vii
Figure 31. E. crassus exconjugant cell with visible Anlagen ... 86 Figure 32. E. crassus exconjugant cells injected with a synthetic 25 bp long DNA-RNA-cy3 ... 86 Figure 33. E. crassus cells 4 h after the transfection with Label IT® Plasmid ... 88
viii
List of tables
Table 1. Physicochemical parameters of AgNPs ... 13
Table 2. List of primers used in this study ... 17
Table 3. EC50 values (95% confidence intervals) ... 19
Table 4. List of 271 DEGs in Collargol 20 mg Ag/L shown in Figure 8.D ... 26
Table 5. Named DEGs in two of the top scoring Biological Processes ... 34
Table 6. Number of DEGs with known and unknown function ... 36
ix
List of abbreviations
S.I. (Système International d’Unités) abbreviations for units and standard notations for chemical elements, formulae and chemical abbreviations are used in this work. Other abbreviations are listed below.
Ω Ohm
µFD Microfarad
Ag Silver
AgNPs Silver nanoparticles AuNPs Golden nanoparticles
bp Base pairs
BP Biological process
BSA Bovine serum albumin
CAS Chinese Academy of Sciences Cbs Chromosome breakage sequence
CC Cellular component
cDNA Complementary DNA
CDS Coding sequence
CHEF Contour-clamped homogenous electric field COST European Cooperation in Science and Technology
CPM Count per million
CTH Cathepsin
Cy3 Cyanine
DEA Differential Expression Analysis DEGs Differential Expressed Genes DNA Deoxyribonucleic acid
DNase I Deoxyribonuclease I
dNTP Deoxynucleotide
E-Cbs Euplotes chromosome breakage sequence
E. crassus Euplotes crassus
e.g. Exempli gratia (for example)
EC50 Median effective concentration of the toxicant that induces a designated effect in 50% of the test organisms after a specified
x exposure time
EDTA Ethylenediamine-tetraacetic acid disodium salt
EtBr Ethidium bromide
EtOH Ethanol
FC Fold change
FW Forward primer
G418 Geneticin
gDNA genomic DNA
GFP Green fluorescent protein
GO Gene Ontology
GPX Glutathione PeroXidase
GSEA Gene Set Enrichment Analysis
h Hours
HEM Hemoglobin
HEPES 4-(2-hydroxyethyl)-1-piperazineethanesulfonic acid hsp70 Heat Shock Protein 70
IESs Internally eliminated sequences IHB Institute of Hydrobiology inches Hg Inch of mercury
kbp Kilobase pairs
KEGG Kyoto Encyclopedia of Genes and Genomes LB-medium Luria-Bertani-medium
MAC Macronucleus
MDSs Macronuclear-destined sequences MDS plot multi-dimensional scaling plot
MF Molecular function
mic Micronucleus
min Minute
MMETSP Marine Microbial Eukaryote Transcriptome Sequencing Project MMI Marine Microbiology Initiative
mRNA messenger RNA
MTT Metallothioneine
neo neomycin-resistance (neo) gene
NICPB National Institute of Chemical Physics and Biophysics
xi
PacBio Pacific biosciences SMRT sequencing PCR Polymerase chain reaction
pdi Polydispersity index PEG Polyethylene glycol
PFGE Pulsed Field Gel Electrophoresis PND Programmed nuclear death psi Pound-force per square inch PRF Programmed ribosomal frameshift qPCR Quantitative polymerase chain reaction
rDNA Ribosomal DNA
RNA Ribonucleic acid
RNAi RNA interference
RNA-Seq RNA Sequencing
ROS Reactive oxygen species
rpm Rounds per minute
rRNA Ribosomal RNA
RV Reverse primer
SDS Sodium dodecyl sulphate
sec Seconds
SPP Supplemented proteose peptone T. thermophila Tetrahymena thermophila Tec Transposonlike E. crassus
TEM Transmission electron microscopy
TetraFGD Tetrahymena Functional Genomic Database TGD Tetrahymena Genome Database
UTR Untranslated region
UV Ultraviolet
V Volt
V0 Vegetative cell
1
Preface
I carried out my PhD work at the University of Camerino in the molecular and cellular biology laboratory under the supervision of prof. Cristina Miceli and prof. Sandra Pucciarelli. The research activities of the laboratory are mainly focused on the study of molecular and cellular adaptations and responsive mechanisms of eukaryotic microorganisms to environmental changes and stressed conditions. The research approach includes the study of genome organization and control of gene expression. Ciliated protozoa, such as the freshwater Tetrahymena thermophila (Order Hymenostomatida) and marine Euplotes species (Order Hypotrichida), are used as model organisms.
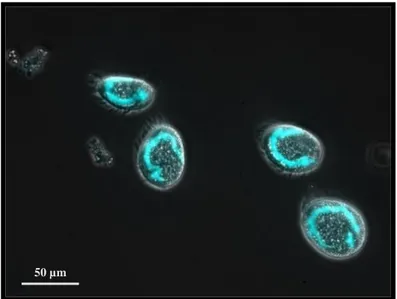
General objectives of my thesis were to demonstrate the applicability of transcriptional profiling, for elucidating the mechanisms of toxic action of engineered nanomaterials in the ciliate Tetrahymena thermophila, endorsing it as a valid model organism for the freshwater environmental pollution studies and to pave the way to the use of marine Euplotes species as additional valid models for studies on the marine environment. Despite their genetic diversity, all ciliates are characterized by two common features: the possession of complexes of cilia, used for swimming or crawling and for phagocytic food capture, and the presence of nuclear dimorphism. Each ciliate contains a germ line diploid micronucleus (mic), inactive in vegetative cells, but transcriptionally active in mating cells and responsible for the genetic continuity during sexual reproduction, and a larger polyploid somatic macronucleus (MAC), the site of transcriptional activity in the vegetative growing cell. Different ciliate species can contain different numbers of micronuclei: Tetrahymena and Euplotes species have one mic, which divides mitotically during vegetative growth. Tetrahymena species have a single ovoid MAC. Euplotes species contain a single, highly elongated MAC (Prescott 1994) (Figure 1).
2
Figure 1. Fluorescence microscopy image of Euplotes crassus. MAC appear blue after staining with a nuclear dye DAPI.
When two starved cells of different mating type undergo conjugation, they exchange haploid mic and develop a new MAC from the mic. The developing MAC is called the Anlagen. During its differentiation several programmed DNA rearrangements occur (M.-C. Yao and Chao 2005): 1) the deletion of segments of the mic genome known as internally eliminated sequences (IESs); 2) the site-specific fragmentation of the chromosomes (Fan and Yao 2000); 3) the addition of a telomere to each new end (Yu and Blackburn 1991) generating the MAC chromosomes (Eisen et al. 2006) , and 4) their amplification (M. C. Yao, Yao, and Monks 1990). In Tetrahymena approximately 6,000 IESs are removed, resulting in the MAC genome being 10% to 20% smaller than that of the mic (M. C. Yao et al. 1984). Hypotrichs undergo the same three global genomic changes of elimination, fragmentation, and amplification during MAC development, but the phenomena are more extreme and entail the elimination of 96% of the mic genomic DNA complexity in Oxytricha species and 98% in Stylonychia lemnae (Prescott 1994), generating very small chromosomes called nanochromosomes that in most cases contain a single genetic unit. Conjugation results in complete genome replacement in each exconjugant and genetic identity of both exconjugants in some species (Orias, Cervantes, and Hamilton 2011).
T. thermophila has normal dimensions of about 50 μm in length and 20 μm in width. It swims in temperate freshwater environments like streams, lakes and ponds, and it tolerates a wide range of temperatures, from 12°C up to about 41°C (Frankel 1999).
3
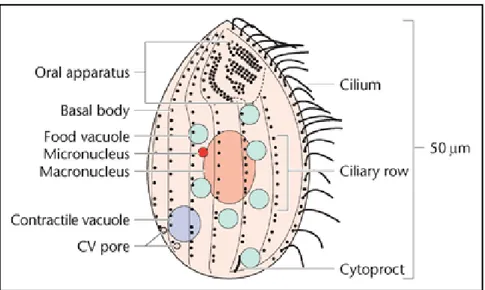
T. thermophila cell is covered by multi-layer cortex that is semi-rigid and arranged into 18-21 longitudinal rows (ciliary rows) of cortical units containing basal bodies mostly accompanied by the cilia. Nutrients are taken up via pinocytosis and phagocytosis, the latter is the main feeding mechanism of Tetrahymena. Food vacuoles are formed in an oral apparatus made up of four compound ciliary elements (hence Tetra-hymena) embedded within fibrillar structures located near the anterior end of the cell. Near the posterior end of the cell is located cytoproct where undigested food particles are excreted from the cell. An osmoregulatory organelle, the contractile vacuole, accumulates and releases collected fluid through contractile vacuole (CV) pores (Figure 2) (Wloga and Frankel 2012; Nusblat, Bright, and Turkewitz 2012; Frankel J. 2007).
Figure 2. A schematic diagram of the organisation of T. thermophila. The anterior end of the cell is oriented upwards, and the ventral (oral) surface of the cell faces the viewer. 7 of the 18– 21 ciliary rows are seen, with basal bodies shown as dots next to longitudinally oriented microtubule bands. Cilia are drawn emerging from the basal bodies of only one of the ciliary rows and omitted from the other rows. (Frankel J. 2007)
Having a doubling time of less than 3 h, T. thermophila is considered one of the fastest growing eukaryotes. It can readily grow to a high density on a wide range of media. Its life cycle (Figure 3) allows the use of conventional tools of genetic analysis, and molecular genetic tools suitable for gene function analysis. In addition, although it is unicellular, it possesses most of the conserved cell structures and molecular processes found in multicellular eukaryotes. Fundamental discoveries of molecular biology were made in this ciliate protozoan and it has been the first member of the phylum Ciliophora to have its complete somatic (MAC) genome sequenced (Eisen et al. 2006). The amplified MAC genome consists of about 104 Mb, that contain more than 27,000 protein coding genes. The Tetrahymena Functional Genomics Database (TetraFGD) is
4
available (Xiong et al. 2013) and it facilitates the study of the molecular bases of environmental responses, since data obtained in different environmental conditions can be easily compared.
Figure 3. The Tetrahymena life cycle.
In the vegetative (asexual) multiplication. V0: vegetative cell. V1: cell undergoing binary fission. mic and MAC divide mitotically and amitotically, respectively. In conjugation, sexual (non-reproductive) stage of the life cycle, events occur in synchrony in each conjugant. 1. Starved cells of different mating type form pairs. 2. Meiosis generates four haploid products, three of which are resorbed by programmed nuclear death (PND). 3. The functional meiotic product undergoes mitosis, generating the haploid migratory (anterior) and stationary (posterior) gamete pronuclei. Migratory pronuclei are reciprocally exchanged. 4. Incoming migratory and resident stationary pronuclei fuse, generating the diploid fertilization nucleus. 5. The fertilization nucleus undergoes two rounds of mitosis, generating four diploid anlagen, which will differentiate into new polyploid MACs (anterior two) and new diploid mics (posterior two). 6. New MACs and mics take up a central position and characteristic arrangement. The parental MAC migrates posteriorly and is resorbed by PND. 7. Exconjugant cells separate. One new mic is resorbed by PND. Not shown: at the first post-conjugation cell division (after stage 7), a new MAC and a mitotic daughter of the surviving new mic are distributed to each daughter cell, thus restoring the vegetative one mic, one MAC nuclear organization (stage V0). From Orias et al. 2011.
The research work of my thesis is divided in three parts: two extensive Chapters and one Additional Project section as an appendix. In Chapter 1, I reported a study on the potential toxic effect of silver nanoparticles (AgNPs) accumulation in the environment, using T. thermophila as a model organism. This was started by a
5
Cooperation in Science and Technology (COST) action BM1102 entitled “Ciliates as model systems to study genome evolution, mechanisms of non-Mendelian inheritance, and their roles in environmental adaptation” and coordinated by our laboratory.
Since the nano-industry has grown incredibly fast in the last few years (Ivask et al. 2014) and AgNPs are the most widely commercialized NPs that are used as antimicrobials in various consumer products (Bondarenko, Juganson, et al. 2013), concentrations of Ag ions are increasing in soil and water (Aueviriyavit, Phummiratch, and Maniratanachote 2014). The collateral dispersion of AgNPs in the environment may pose a threat to non-target organisms (Ivask et al. 2014). Therefore, to understand their toxicity mechanisms is essential for the design of more efficient nano-antimicrobials and for the design of biologically and environmentally benign nanomaterials.
In a previous study, only a few genes known to be involved in detoxification by oxidative stress were analysed by qPCR, after exposure of T. thermophila to AgNPs compared with the effect of a soluble silver salt, AgNO3, to evaluate the contribution of the dissolved silver to the overall toxic effect of AgNPs (Juganson et al. 2017). This study showed that Ag-ions play a major role in the toxicity of AgNPs in T. thermophila. However, although oxidative stress related genes were overexpressed in AgNP-exposed
Tetrahymena, the intracellular ROS level was not elevated, possibly due to Tetrahymena's very efficient antioxidant defense mechanisms that certainly involves
other not yet investigated genes. The study also highlighted the relevance of the AgNPs toxicity for environmentally abundant organisms and still left open the question of which other genes are involved in the Tetrahymena response to AgNPs. Does the organization in AgNPs produce a different effect on the total gene expression regulation with respect to the effect induced by the silver ions released by the salt AgNO3?
Therefore, to answer to these open questions and to obtain a global vision of the changes occurring in T. thermophila gene expression, we decided to perform an RNA sequencing analysis to compare the cell’s exposure to AgNO3 and to AgNPs. For this purpose, I went to the The National Institute of Chemical Physics and Biophysics (NICPB) of Tallinn (Estonia) to repeat the toxicity test and to learn how to handle AgNPs. Then I joined the Protozoan Functional Genomics laboratory at the Institute of Hydrobiology (IHB), Chinese Academy of Sciences (CAS) in Wuhan (China). In this laboratory coordinated by Dr. Wei Miao, a deep RNA-sequencing study of T. thermophila during the three major stages of the life cycle (growth, starvation and conjugation) was performed and a Tetrahymena functional database (TetraFGD) was developed (Xiong et al. 2013). There, as a pilot experiment, I exposed T. thermophila to
6
two sub-lethal concentrations of silver compounds and collected the cells after 2 and 24 h to perform RNA isolation and RNA-sequencing. Differential gene expression was analyzed. The experimental sequences were compared with the controls to evaluate quantitatively the inhibition or increase of gene expression due to NPs or Ag ions. Then, I performed gene set enrichment analyses.
According to these results we decided to investigate further the 24 h exposure condition, which was considered more consistent for the biological model, also considering T. thermophila doubling time.
Later, at the University of Camerino, I performed a biological replica of the 24 h exposure experiment to obtain statistically significant data. I also validated my data with qPCR and all this work is reported in detail in Chapter 1 of my thesis.
The results presented in Chapter 1 confirmed that T. thermophila is a valid freshwater model organism to study stress response mechanisms. No similar models are provided so far from the marine environment. In order to propose a seawater counterpart, my attention was focused on Euplotes marine species. These species still require analysis of the genomes to have a reference for the environmental response studies.
Some steps in this direction have already been done in our laboratory in collaborations, through a first assembly of MAC genomes of Euplotes crassus and E. focardii that revealed important aspects of the translation machinery that frequently uses frameshifting (Lobanov et al. 2017). This analysis was followed by a more deeply annotation of the Euplotes MAC to which I am currently contributing (data not yet published). However, Euplotes mic sequences are still unknown as well as the details on the DNA rearrangements to produce the MAC genome by transpositions and DNA elimination. This gap is significant for our research because the mechanisms of the stress response are most probably influenced by the DNA rearrangements and transpositions. To address this gap in research, I developed a technique to isolate E.
crassus micronuclear chromosomes, as reported in Chapter 2 of this thesis. This
work was supported by The Marine Microbiology Initiative (MMI, funded by Gordon and Betty Moore foundation) and developed in collaboration with the University of Bern and the University of Connecticut.
Finally, in order to generate real valid genetic models with Euplotes species, comparable with the Tetrahymena model, it would be necessary to establish genetic manipulation techniques for functional studies and further applications. In the
7
Additional Project section of this thesis are listed different experimental approaches for Euplotes transfection. This study was also supported by MMI which
aims to accelerate development of genetic tools to enable development of experimental model systems in marine microbial ecology.
The MMI also co-funded my PhD scholarship.
The three parts of my thesis are written to be used for three independent publications. I apologize for repetitions mainly present in the three introductions.
8
Chapter 1
1.0 Differential gene expression analysis in the
freshwater ciliate Tetrahymena thermophila under
9
1.1 Introduction and aims
Nanotechnology has become a major scientific challenge in the last few years, and researchers are continuing to discover unique properties and applications of nanomaterials. There are different purposes for the use of nanoparticles (NPs) in improving human health, environmental quality, computer science technology and general devices. They have already found their commercial applications in various products (Salata 2004). Nevertheless, the same properties which make NPs so attractive for their use in new products have also led to concerns that NPs may raise the risk for humans and the environment (Dubey et al. 2015). If compared to their respective bulk materials, NPs possess different physical and chemical properties, such as lower melting points, specific optical properties, mechanical strengths, specific magnetizations and higher specific surface areas. These properties proved to be attractive in various industrial applications (Horikoshi and Serpone 2013). Another property of NPs is a high surface-to-volume ratio, that means that a higher portion of the atoms, constituting the material, are located at the surface of the particle itself. These atoms are in a different bonding state compared to those located inside, more unbound and active, resulting in easy bonding with contacting materials and influencing the particle properties like reactivity, adsorption rate, solubility and bioavailability. There is increasing evidence that the unique desired physicochemical properties of NPs, which make nanomaterials more efficient in industrial applications, render these materials also more harmful to living organisms (Bondarenko, Juganson, et al. 2013). At least it is known that the major phenomena driving NPs toxicity are: dissolution, organism-dependent cellular uptake, induction of oxidative stress and consequent cellular damages (Ivask et al. 2014).
NPs are abundant in nature, as they are produced in many natural processes, including photochemical reactions, volcanic eruptions, forest fires, simple erosion, and by plants, animals and microbes (Buzea, Pacheco, and Robbie 2010). They can also be produced as a by-product of many human industrial and domestic activities, such as cooking, material fabrication and transport using internal combustion and jet engines. Different methods are successfully used to obtain AgNPs, including physical (Brobbey et al. 2017; He, Ren, and Chen 2017), chemical (Han et al. 2017; Khatoon et al. 2017), physicochemical (Verma et al. 2017) and biological synthesis approaches (Dutta et al.
10
2017; Singh et al. 2017). Recent results show that the properties of AgNPs largely vary based on the diversified synthesis processes (Akter et al. 2018).
Among the metal NPs, AgNPs have the highest degree of commercialization due to their known antimicrobial properties (Gopinath et al. 2010; Sotiriou and Pratsinis 2011; Youngs et al. 2012; Guo et al. 2014; Dubey et al. 2015). AgNPs are important in many industries, such as pharmaceuticals, cosmetics, textiles, surface coatings, electronic components, and food packaging (Nadagouda, Speth, and Varma 2011; Benn et al. 2010).
The use of silver as a bactericide and fungicide has been known for more than 20 centuries. In the 19th century its use in medicine was widespread, but it declined with the advent of antibiotics (Hobman and Crossman 2015). However, problems arising from the emergence of antibiotic resistant strains have led to renewed interest in silver as an antibiotic agent. Recent studies have confirmed that silver particles have effects against a wide spectrum of Gram-negative and Gram-positive bacteria and some also exhibit anti-fungal and antiviral activity (Rai, Yadav, and Gade 2009). Currently, nanosilver is perhaps the most preferred antimicrobial nanomaterial and AgNPs coatings have been used to inhibit the unwanted growth of bacterial biofilms in medical catheters, prostheses, heart valves, etc. (Ivask et al. 2014). Direct contact between a bacterial cell and AgNPs’ surface enhances the toxicity of nanosilver. More specifically, cell-NP contact increases the cellular uptake of particle-associated Ag ions, generating toxicity (Bondarenko, Juganson, et al. 2013).
Even if AgNPs possess tremendous advantages that recommend them for novel biomedical applications, their toxicity recently became an intensive subject of study (Burdușel et al. 2018). AgNPs could be released into the environment during the production, transport, erosion, washing, and disposal of AgNPs products (Nowack and Mueller 2008). There are two major classes of products which expedite the release of AgNPs into the environment: the cosmetics and healing lubricants, which via dermal exposure are eventually released into water bodies while bathing, and the nanomaterials incorporated into textile fabrics, which upon washing are released into the water stream (Wiesner et al. 2009). The broad industrial applications have high potential to increase environmental exposure, and it may have negative impacts on the ecosystems and pose a threat to ‘‘non-target’’ organisms, such as natural microbes and aquatic biota (Fabrega et al. 2011; Anjum et al. 2013). AgNPs are of especially high concern, because
11
according to the recent scientific literature, aquatic species are extremely sensitive to AgNPs (Kahru and Dubourguier 2010; Bondarenko, Juganson, et al. 2013).
The intrinsic biocide activity of AgNPs is influenced by different physicochemical features, including morphology, size, dissolution states, surface charge, and surface coating (Durán et al. 2016; Koduru et al. 2018). Cell type, exposure time, and amount of AgNPs also play an important role in cytotoxicity. The shape of the AgNPs might influence the cellular uptake mechanism (diffusion, phagocytosis and endocytosis), which in turn modulates the cytotoxicity (AshaRani et al. 2009). The concentration range of NPs that can induce toxicity depends on the particle size, type of medium, temperature, and time of exposure (Kittler et al. 2010). More aggregated particles showed fewer effects on the cellular level (Lankoff et al. 2012). The NPs surface coating defines much of their bioactivity. Therefore, it is one of the main factors influencing the final toxicological outcome (Ashkarran et al. 2012; Lesniak et al. 2013). For better understanding of NPs toxicity, it is important to explore their physicochemical properties in the media where the biological toxicity tests are performed. As dissolution is one of the main contributors to the toxicity of AgNPs (Holl 2009; Casals, Gonzalez, and Puntes 2012), it is important to distinguish the effect of Ag ions and AgNPs (Johnston et al. 2010; Bouwmeester et al. 2011). Several studies have shown that AgNP-induced toxicity is triggered by microbial membrane damage, caused by the attachment of AgNPs on the cell surface, and subsequent structural and functional alterations (such as gap formation and membrane destabilization); and microbial sub-cellular structure damage, caused by the release of free Ag ions and subsequent reactive oxygen species (ROS) generation or essential macromolecule (proteins, enzymes, and nucleotides) inactivation (Foldbjerg et al. 2009; Durán et al. 2016; Akter et al. 2018).
Studies of the toxicity mechanisms are crucial for understanding the impact of NPs on the living organisms and to explore the functional and long terms applications of AgNPs. These studies are crucial for the design of more efficient nano-antimicrobials, and evenly for the design of nanomaterials that are biologically and/or environmentally benign throughout their life-cycle. The toxicity effects induced by AgNPs have been evaluated using numerous in vitro and in vivo models, but still there are contradictions in interpretations due to disparity in methodology tested (Dubey et al. 2015). Only a few specific genes have been found to be influenced specifically by NPs till now, and it
12
would be helpful to check the entire gene expression profile. Previous studies, that analyze the gene expression profile of unicellular eukaryotes exposed to AgNPs, lack a control for the evaluation of the Ag ions effect (Simon et al. 2013; Pan, Zhang, and Lin 2018).
In the current study we used the freshwater ciliate Tetrahymena thermophila to elucidate the environmental effects of AgNPs using next-generation sequencing technologies (Marioni et al. 2008). T. thermophila is an ecologically relevant model organism for nanotoxicology (Mortimer, Kahru, and Slaveykova 2014; Mortimer et al. 2014; Mortimer et al. 2016). It has the advantages of a short life cycle, cosmopolitan distribution, simplicity, high degree of reproducibility, and quick responses to environmental disturbances. In addition, although it is unicellular, it possesses most of the conserved cell structures and molecular processes found in multicellular eukaryotes. With this approach, we expected to obtain a global and reliable vision of the changes occurring in gene expression after exposure to Collargol (well characterized protein-stabilized AgNPs). We also compared the results with the effect of the soluble silver salt AgNO3 to evaluate the contribution of the dissolved silver to the overall toxic effect of AgNPs. We tested two sub-lethal concentrations to evaluate the impact of these substances in viable cells after 24 h of exposure. The experimental RNA sequencing results were compared with the control to evaluate quantitatively the inhibition or increase of gene expression due to NPs or silver ions. Then, gene set enrichment analysis was performed and by complementing the differential expression analysis information with the Tetrahymena functional genomic database TetraFGD (Miao Laboratory 2017), we contributed to a better understanding of the mechanism of AgNPs toxicity.
1.2 Experimental procedures
1.2.1 Chemicals
Casein-coated colloidal silver NPs, called Collargol (batch N 297, from Laboratories Argenol S. L.) dispersed in MilliQ water at 1 g/L and AgNO3 as a 0,1 M solution (Sigma-Aldrich) were kindly supplied by Dr. K. Juganson (NICPB, Tallinn, Estonia). Stock suspensions and solutions of silver compounds were stored at 4°C in the dark.
13
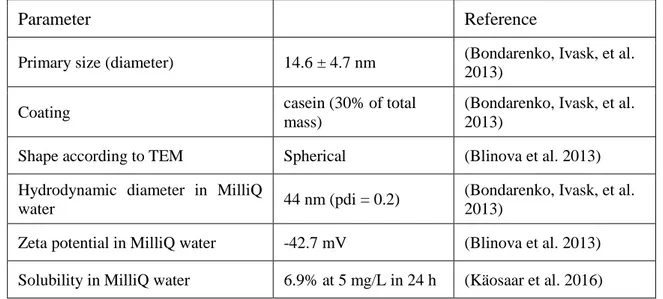
The dilutions of NPs and AgNO3 were prepared in MilliQ water. Physicochemical characterization of this type of AgNP have been reported previously (Blinova et al. 2013; Bondarenko, Ivask, et al. 2013) and are summarized in Table 1 (Juganson et al. 2017).
Table 1. Physicochemical parameters of AgNPs (Collargol) (Modified by Juganson et al. 2017).
Parameter Reference
Primary size (diameter) 14.6 ± 4.7 nm (Bondarenko, Ivask, et al. 2013)
Coating casein (30% of total
mass)
(Bondarenko, Ivask, et al. 2013)
Shape according to TEM Spherical (Blinova et al. 2013) Hydrodynamic diameter in MilliQ
water 44 nm (pdi = 0.2)
(Bondarenko, Ivask, et al. 2013)
Zeta potential in MilliQ water -42.7 mV (Blinova et al. 2013) Solubility in MilliQ water 6.9% at 5 mg/L in 24 h (Käosaar et al. 2016)
TEM = transmission electron microscopy; pdi = polydispersity index;
MilliQ water = ultrapure water.
1.2.2 T. thermophila strain CU428 culture
T. thermophila strain CU428, whose macronuclear genome is sequenced, was kindly supplied by Professor W. Miao (IHB, CAS, Wuhan, China).
100 µl of cells were transferred to 5 ml of SPP medium (2% protease peptone, 0,1% yeast extract, 0.2% glucose and 0.003% Fe-EDTA) supplemented with the antibiotics streptomycin sulphate and penicillin G, at 250 µg/ml (CARLO ERBA Reagents), and the fungicide amphotericin B at 1.25 µg/ml (CARLO ERBA Reagents). The cells were incubated at 30°C under shaking in a glass flask to grow o/n. Cell density was determined by counting the cells in a haemocytometer (Neubauer). To allow the counting, T. thermophila cells were fixed in 5% formalin (Mortimer, Kasemets, and Kahru 2010). When cells were in their logarithmic growth phase, with a doubling time of less than 3 h and a density of about 3 ~ 4×10⁵ cells/ml, they were harvested by centrifugation at 1300 rpm for 5 min, at room temperature, and washed twice with MilliQ water.
14
1.2.3 Toxicity test
100 µL of T. thermophila culture, with a density of 106 cells/ ml, was added to 100 µL of test solutions (Collargol and AgNO3 at different concentrations in MilliQ water) in triplicate. After 24 h exposure in 96-well plates at 25°C in the dark, the toxicity of Collargol and AgNO3 was evaluated by measuring the cellular ATP content using the luciferin-luciferase assay (Sigma-Aldrich). The toxicity test has been performed In the Laboratory of Environmental Toxicology of the National Institute of Chemical Physics and Biophysics of Tallinn (Estonia) (Juganson et al. 2017; Jemec et al. 2016; Mortimer, Kasemets, and Kahru 2010).
1.2.4 Exposure of T. thermophila to silver compounds
T. thermophila CU428 strain was exposed to two sub-lethal concentrations of Collargol at 10 mg Ag/L and 20 mg Ag/L. AgNO3 was used as a control for dissolved Ag ions, expected to be present in AgNP dispersions, respectively at 0.76 mg Ag/L and 1.5 mg Ag/L of AgNO3, as previously determined by Juganson et.al. 2017.
In the current study, the exposures were conducted in MilliQ water to avoid interactions of media components with AgNPs and dissolved Ag ions. T. thermophila, is known to survive in water for at least a week (Koppelhus, Hellung-Larsen, and Leick 1994), and the starved cells undergo physiological, biochemical and molecular changes (Cassidy-Hanley 2012). However, these were not crucial factors in interpreting the results because the exposures to AgNPs and control chemicals occurred in the same conditions. Thus, any difference in gene expression or physiology of protozoa were assumed to be induced by the chemical exposures (Juganson et al. 2017).
The experiment has been performed in triplicate, in 6-well plates, non-tissue culture treated, with each well filled with 5 ml of T. thermophila culture, with a density of 5.5×10⁵ cells/ml. 0.5 ml of the toxicants were added to the cells and 0.5 ml of MilliQ water to the controls; the final cell density was 5×10⁵ cell/ml. The plates were incubated at 25°C in the dark. Visible light was avoided since it promotes the biosynthesis of AgNPs from Ag ions by T. thermophila (Juganson et al. 2013). The cells have been visualized with light microscope to monitor any changes.
15
1.2.5 RNA isolation
After 24 h exposure, 5.5 ml of T. thermophila culture, with a density of 5×10⁵ cells/ml, were collected by centrifuging for 15 min at 3000 rpm. The cell pellet was dissolved in TRI Reagent (Sigma-Aldrich) and RNA was isolated according to the manufacturer’s protocol. Agarose gel electrophoresis (1%), NanodropTM 1000 UV-Vis
Spectrophotometer (Thermo Fisher Scientific) and Agilent 2100 Bioanalyzer (Agilent Technologies) were used to check the integrity, concentration and quality of RNA.
1.2.6 RNA sequencing and bioinformatic analysis
RNA-Seq data were obtained for 16 RNA samples of T. thermophila (4 samples without toxicants as controls, 3 samples stressed with Collargol 10 mg Ag/L, 3 samples stressed with Collargol 20 mg Ag/L, 3 samples stressed with AgNO3 0.76 mg Ag/L and 3 samples stressed with AgNO3 1.52 mg Ag/L) using an Illumina NextSeq 500 deep sequencing system (producing paired-end reads with an Illumina 1.9 encoding and 75 bp of read length). Library preparation was conducted with the Illumina TruSeq Stranded mRNA Library Preparation Kit and the reads quality, obtained from the sequencing, was checked using the FastQC software (Andrews S. 2010). Transcriptome assembly was performed using the Trinity package included in the “RNA-Seq De novo Assembly” section of Blast2GO (Grabherr et al. 2011), and a range from 84.7% to 85% of paired-end reads were mapped to the T. thermophila transcriptome obtained from the Tetrahymena Genome Database (TGD) (Stover et al. 2006).
Then the experimental samples were compared with the control to evaluate quantitatively the inhibition or increase of gene expression due to NPs or silver ions. The Differential Expression Analysis (DEA) was carried out using the edgeR package (TMM as normalization method and GLM likelihood ratio test as statistical test), included in the “Pairwise Differential Expression Analysis” section of Blast2GO (Robinson, McCarthy, and Smyth 2009) to calculate normalized fold change and counts-per-million (CPM) ensuring that expression levels for different genes and transcripts can be compared across runs. Stringent default criteria were set: genes showing |log2 (fold change)| > 1 and FDR < 0.05 in all the 3 replica are defined as Differential Expressed Genes (DEGs).
To assign gene function to contigs, the Gene Set Enrichment Analysis (GSEA) in Blast2GO (Götz et al. 2008) was performed.
16
1.2.7 Gene expression validation
Real-time PCR was used to confirm the effects of Collargol and AgNO3 on the expression levels of selected genes listed in Table 2. Genes among the DGE list were selected considering their physiological expression profile in TetraFGD (Miao Laboratory 2017) and their associated biological role. Primers (Thermo Fisher Scientific) were designed using the Primer-BLAST application included in the NCBI website. The specificity of each primer set and annealing temperature to optimize PCR conditions and the fluorescence signal specificity of PCR amplification were confirmed through assessment of the product melting curves and the efficiency was between 94.7% and 102.4% with r2 = 0.99.
800 ng of each RNA sample were retrotranscribed to cDNA using an iScript gDNA Clear cDNA Synthesis Kit (Bio-Rad) with iScript DNase to digest genomic DNA contamination. 0.3 μL (12.5 ng) of cDNA from each sample was used in qPCR using SsoAdvanced Universal SYBR Green Supermix and the CFX Connect Real-Time PCR Detection System (Bio-Rad). All reactions were performed in triplicate in a final volume of 20 μl. Thermal cycling conditions were as follows: 3 min denaturation at 98°C followed by 40 cycles for 15 sec denaturation at 98°C, 30 sec annealing and elongation at 60. 17S rRNA and Hsp705 genes were references for normalization, and the relative amount of mRNA was calculated using the 2−ΔΔCt method (Livak and Schmittgen 2001).
17 Table 2. List of primers used in this study.
Gene name Primer Sequence
Ribosomal protein (GenBank: M10932.1) 17S* FW: 5’ GAATTGACGGAACAGCACACC 3’ RV: 5’ TCACTCCACCAACTAAGAACGGC 3’ HSP70a paralog SSA5 (TTHERM_00558440) hsp705* FW: 5’ TCTCAAAGCCAGTCAAGAATGC 3’ RV: 5’ GCCATAAGCAATAGCAGCAGC 3’ Metallothionein (TTHERM_00660230) MTT5* FW: 5’ GTCGGTTCAGGAGAAGGATGC 3’ RV: 5’ CCTCCAGGGCAGCATTCTTTAG 3’ Metallothionein (TTHERM_00241640) MTT1* FW: 5’ GCGGATGTTGCTGCGTAAGTAA 3’ RV: 5’ GGGATCAAAGCAGCAGGGTTTA 3’ Metallothionein (TTHERM_00433530) MTT4 FW: 5’ GTTACTGAAAGCTGTGGCTGC 3’ RV: 5’ ATGCGGTTCTACTTCTAACTGTAAATGC 3’ Hemoglobin 1 (TTHERM_00535150) HEM1 FW: 5’ CTTACTATGCTTTTAGGAGGACCCAA 3’ RV: 5’ CATTGAGAATCTTGCCGCCAC 3’ CaTHepsin 12 (TTHERM_00561510) CTH12 FW: 5’ GAATGCCAGATAAATTGTCAGACGTG 3’ RV: 5’ CTCATAATAACGCTACTATTGGTCTAACTC 3’ HSP70a paralog SSA4 (TTHERM_01080440) hsp703* FW: 5’ TCTAAAAGCTAAGTCCACGAAGTT 3’ RV: 5’ AACCAGTTAGAATTGCAGCCTATA 3’ 26S proteasome subunit P45 fam.
Prot. (TTHERM_00551090)
RPT6 FW: 5’ GGACGCCGAAGAAAACTTAGGT 3’
RV: 5’ ACAAGGAAGCCTTAAAGAAGACTATTGG 3’ 26S proteasome non-ATPase reg.
subunit 6 (TTHERM_00191240)
RPN7 FW: 5’ GGACGCCGAAGAAAACTTAGGT 3’
RV: 5’ ACAAGGAAGCCTTAAAGAAGACTATTGG 3’ *17S, hsp705, MTT5, MTT1 and hsp703 primers have been previously used in (Juganson et al. 2017).
1.2.8 Data analysis
For the toxicity test, the concentration-effect curves by the log-normal model were constructed and the EC50 values (the effective concentration that induces a response in 50% of the population) with 95% confidence intervals were calculated based on nominal concentrations using REGTOX software for Microsoft Excel™ (Vindimian 2001). All data were expressed as the average of three independent experiments ± standard deviation (SD).
For qPCR experiments the statistical analyses were performed with CFX Maestro™ Software for Bio-Rad CFX Real-Time PCR Systems. One-way ANOVA analyses were used to assess significant differences (p < 0.01).
18
1.3 Results and discussion
1.3.1 Toxicity test
We first verified that the toxicity of AgNPs increased in a concentration-dependent manner. Based on this result, we selected two sub-lethal concentrations of Collargol, at 10 mg Ag/L and 20 mg Ag/L. In order to see the effects of AgNPs in viable cells and evaluate their impact in the gene expression, only sub-lethal concentrations were used for the RNA-sequencing analysis after 24 h exposure. We decided to investigate the 24 h exposure condition since it was considered more consistent for the biological model considering its doubling time.
AgNO3 was used as an ionic silver control, at concentrations equal to the dissolved silver concentration in the dispersion of AgNPs. Specifically, 0.76 mg Ag/L and 1.52 mg Ag/L of AgNO3 were used (Figure 4).
T. thermophila is known to show a higher tolerance to Ag compounds (EC50 values in Table 3) than other freshwater invertebrates (Juganson et al. 2013; Juganson et al. 2017). Such results are remarkable considering that the toxicity assays were performed in MilliQ water, where the effects of the medium components on the Ag ions complexation and speciation were eliminated. These features are presumably a result of the adaption to high environmental concentrations of pollutants as protozoa are also present in the wastewater purification process (Esteban, Tellez, and Bautista 1991). Indeed, the EC50 after 24 h of exposure to the toxicants is higher than the EC50 after 2 h. Changes in the cells were visible in AgNPs exposed samples, where food vacuoles appeared dark after 2 h and 24 h exposure (Figure 5), due to internalised AgNPs After 24 h extracellular agglomerates of expelled food vacuole contents were also present (not shown in the picture).
19
Figure 4. Viability of T. thermophila strain CU428 upon exposure to Ag compounds for 2 and 24 h: a concentration-effect analysis. Data points are the average values of at least 3 replicates and error bars indicate standard deviations. ATP concentration was used as a viability endpoint. Concentration-effect curves were generated using REGTOX software for Microsoft ExcelTM.
Table 3. EC50 values (95% confidence intervals). 0 20 40 60 80 100 120 140 0,1 1 10 100 1000 V iabil it y, % Concentration, mg Ag/L Collargol 24h data points Collargol 2h data points AgNO3 24h data points agNO3 2h data points EC50
Collargol (mg Ag/L) AgNO3 (mg Ag/L)
2 h 28.1 (25.2-32.4) 0.96 (0.87-0.98) 24 h 38.2 (33.1-45.8) 1.05 (1.02-1.17) AgNO3 24 h AgNO3 2 h Collargol 24 h Collargol 2 h
20
Control AgNO3 1.52 mg Ag/L Collargol 20 mg Ag/L
2 h
24 h
Figure 5. Images of live T. thermophila cells after 2 h and 24 h incubation in MilliQ water (Control) and exposure to sub-lethal concentration of 20 mg Ag/L of AgNPs or 1.52 mg Ag/L of AgNO3 in MilliQ water. Arrows indicate food vacuoles filled with AgNPs (Collargol 20 mg Ag/L).
1.3.2 Differentially expressed genes (DEGs)
To explore the overall differences between the expression profiles of the different samples we clustered them in two dimensions using multi-dimensional scaling (MDS) plots. This is both an analysis step and a quality control step. The distance between each group of samples can be interpreted as the leading log-fold change between the samples for the genes that best distinguish that group of samples. (Chen, Lun, and Smyth 2016). The MDS plot shows that replicates from the same treatment cluster together, while samples from different treatments are well separated. In other words, differences between different treatments are larger than those within the same treatment, meaning that there are likely to be statistically significant differences between different treatments. It also verified the reproducibility and reliability of the RNA-Seq data. (Figure 6).
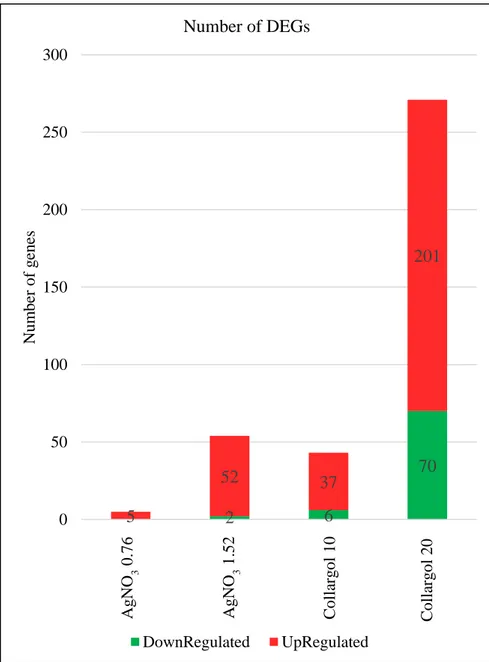
The expression profiles of the control samples are in agreement with the data available on TetraFGD (Miao Laboratory 2017) after 24 h of starvation. The number of DEGs at different concentration is shown in Figure 7. Both Ag compounds resulted in either inhibition and increase of gene expression. AgNPs clearly affected a higher number of genes. As summarised in Figure 7, there are 43 DEGs (37 up and 6 down-regulated) are in the sample exposed to Collargol 10 mg Ag/L and 271 DEGs (201 up and 70
down-21
regulated) in the sample exposed to Collargol 20 mg Ag/L. 5 up-regulated genes in T. thermophila exposed to AgNO3 0.76 mg Ag/L and 54 DEGs (52 up and 2 down-regulaed) in the sample exposed to AgNO3 1.52 mg Ag/L.
32 DEGs changed their expression only in the incubation with AgNO3, 24 genes are affected by both Ag compounds, 257 differentially affected genes are specifically affected by Collargol and most of them (223 genes) are triggered only at the highest Collargol concentration (Figure 8).
In many cases there is a linear tendency (of up or down regulation) that is concentration dependent. To obtain a global visualization of the results, we generated heatmaps for all DEGs under each stress condition (Figure 9 and Table 4).
Figure 6. The MDS plot explores the overall differences between the expression profiles of the different samples. It shows similarity between samples in which distances correspond to leading changes (Leading logFC) between each pair of RNA samples. The leading log-fold-change is the average (root-mean-square) of the largest absolute log-fold-log-fold-changes between each pair of samples. Each colour indicates a different treatment and each square represents one treatment replica. The numbers in the data labels stand for the concentration of each compound.
22
Figure 7. Histogram showing the number of DEGs in each compared group.
2 6 70 5 52 37 201 0 50 100 150 200 250 300 A gN O 3 0,76 A gN O 3 1,52 C ol al rgol 10 C ol lar gol 20 N um ber of g ene s Number of DEGs DownRegulated UpRegulated A g N O 3 0.76 A g N O 3 1.52 C ol la rg ol 10 C ol la rg ol 20
23
Figure 8. Venn diagram showing DEGs among the four treatments.(Oliveros 2015).
AgNO3 0.76 mg Ag/L Control
24
AgNO3 1.52 mg Ag/L Control
Collargol 10 mg Ag/L Control B)
25
Collargol 20 mg Ag/L Control
Figure 9. Heatmaps of all DEGs between different treatment groups. CPM values are used to generate the heatmaps. The numerical values are represented by a range of colours, from red (more expressed) to green (less expressed). The dendrograms added to the left and top side are produced by a hierarchical clustering method that takes as input the Euclidean distance computed between genes (left) and samples (top). A) AgNO3 0.76 mg Ag/L. B) AgNO3 1.52 mg Ag/L. C) Collargol 10 mg Ag/L. D) Collargol 20 mg Ag/L. The genes list is not displayed in Figure 9.D) because it is not readable; involved genes are listed in Table 4.
a b c d e f g h i j k l m n o p q r D)
26
Table 4. List of 271 DEGs in Collargol 20 mg Ag/L shown in Figure 9.D.
a) 1 - 15 1 TTHERM_00529930 d) 46 60 46 TTHERM_00301860 2 TTHERM_00039010 47 TTHERM_000043960 3 TTHERM_00433520 48 TTHERM_000440549 4 TTHERM_00660230 49 TTHERM_00365350 5 TTHERM_00640030 50 TTHERM_00798120 6 TTHERM_00142420 51 TTHERM_00211510 7 TTHERM_01222600 52 TTHERM_00498240 8 TTHERM_00569200 53 TTHERM_00069540 9 TTHERM_00251190 54 TTHERM_00405450 10 TTHERM_00535150 55 TTHERM_00234140 11 TTHERM_00058260 56 TTHERM_000947489 12 TTHERM_00160810 57 TTHERM_00798150 13 TTHERM_00804710 58 TTHERM_00187230 14 TTHERM_00954210 59 TTHERM_000566889 15 TTHERM_00462900 60 TTHERM_01080440 b) 16 30 16 TTHERM_00249710 e) 61 - 75 61 TTHERM_00160800 17 TTHERM_00572020 62 TTHERM_00046090 18 TTHERM_00079730 63 TTHERM_00961860 19 TTHERM_00529870 64 TTHERM_00439070 20 TTHERM_00239090 65 TTHERM_00030430 21 TTHERM_00191240 66 TTHERM_000452041 22 TTHERM_00661650 67 TTHERM_000735269 23 TTHERM_00420410 68 TTHERM_00568050 24 TTHERM_01049360 69 TTHERM_00475050 25 TTHERM_00102730 70 TTHERM_00688790 26 TTHERM_00655970 71 TTHERM_00773550 27 TTHERM_000723629 72 TTHERM_00004850 28 TTHERM_00503800 73 TTHERM_00151150 29 TTHERM_00890130 74 TTHERM_00051700 30 TTHERM_00318570 75 TTHERM_00962090 c) 31 - 45 31 TTHERM_00497060 f) 75 - 90 76 TTHERM_00426250 32 TTHERM_00145060 77 TTHERM_000723219 33 TTHERM_00227040 78 TTHERM_00498140 34 TTHERM_00717640 79 TTHERM_00526310 35 TTHERM_01205320 80 TTHERM_01141610 36 TTHERM_00943020 81 TTHERM_00535500 37 TTHERM_00446110 82 TTHERM_00152000 38 TTHERM_00313800 83 TTHERM_00971980 39 TTHERM_000529532 84 TTHERM_00760550 40 TTHERM_00666640 85 TTHERM_00575380 41 TTHERM_00138010 86 TTHERM_00187260 42 TTHERM_00239310 87 TTHERM_00460610 43 TTHERM_00526449 88 TTHERM_00203060 44 TTHERM_00125160 89 TTHERM_000158529 45 TTHERM_00572000 90 TTHERM_01149330
27 g) 91 105 91 TTHERM_00142240 j) 136 - 150 136 TTHERM_00365360 92 TTHERM_000062688 137 TTHERM_01138240 93 TTHERM_000242186 138 TTHERM_000558149 94 TTHERM_000748977 139 TTHERM_00191050 95 TTHERM_000066709 140 TTHERM_000191059 96 TTHERM_00035350 141 TTHERM_00532610 97 TTHERM_00927210 142 TTHERM_00670280 98 TTHERM_000593091 143 TTHERM_01456070 99 TTHERM_002653522 144 TTHERM_00471760 100 TTHERM_00700930 145 TTHERM_00191020 101 TTHERM_00798140 146 TTHERM_00161860 102 TTHERM_000476968 147 TTHERM_00390120 103 TTHERM_000661568 148 TTHERM_00549460 104 TTHERM_00647470 149 TTHERM_00233090 105 TTHERM_00895760 150 TTHERM_00977590 h) 10 6 - 120 106 TTHERM_00405500 k) 15 1 -165 151 TTHERM_00825310 107 TTHERM_00476930 152 TTHERM_00492540 108 TTHERM_00516420 153 TTHERM_01193540 109 TTHERM_00649220 154 TTHERM_00137880 110 TTHERM_00046110 155 TTHERM_00384990 111 TTHERM_00895770 156 TTHERM_00483520 112 TTHERM_00575390 157 TTHERM_000346609 113 TTHERM_00971970 158 TTHERM_00947340 114 TTHERM_00660280 159 TTHERM_001205271 115 TTHERM_00476950 160 TTHERM_01074540 116 TTHERM_00187210 161 TTHERM_00937710 117 TTHERM_00654020 162 TTHERM_01075750 118 TTHERM_00351140 163 TTHERM_00734050 119 TTHERM_01227870 164 TTHERM_00316060 120 TTHERM_00046810 165 TTHERM_00942880 i) 121 - 135 121 TTHERM_000693289 l) 166 - 180 166 TTHERM_00655340 122 TTHERM_00158000 167 TTHERM_00433530 123 TTHERM_000660229 168 TTHERM_00145070 124 TTHERM_00251240 169 TTHERM_00241650 125 TTHERM_00693290 170 TTHERM_00241640 126 TTHERM_000145038 171 TTHERM_000357079 127 TTHERM_00146110 172 TTHERM_00241620 128 TTHERM_00148970 173 TTHERM_00695600 129 TTHERM_01736560 174 TTHERM_00895750 130 TTHERM_00301870 175 TTHERM_00508970 131 TTHERM_00837980 176 TTHERM_00691090 132 TTHERM_00124060 177 TTHERM_00143560 133 TTHERM_01105030 178 TTHERM_000193311 134 TTHERM_00703880 179 TTHERM_00998920 135 TTHERM_01495770 180 TTHERM_00449110
28 m) 181 - 195 181 TTHERM_00549410 p) 22 6 - 240 226 TTHERM_00245120 182 TTHERM_00856670 227 TTHERM_01135130 183 TTHERM_00518469 228 TTHERM_01220430 184 TTHERM_01044650 229 TTHERM_00013430 185 TTHERM_01085680 230 TTHERM_00047530 186 TTHERM_00191060 231 TTHERM_00105169 187 TTHERM_00144970 232 TTHERM_00023959 188 TTHERM_00189610 233 TTHERM_00129490 189 TTHERM_00654080 234 TTHERM_00503780 190 TTHERM_00274510 235 TTHERM_00616330 191 TTHERM_00185270 236 TTHERM_00463290 192 TTHERM_00283760 237 TTHERM_00509030 193 TTHERM_00929450 238 TTHERM_00895640 194 TTHERM_00405400 239 TTHERM_00655480 195 TTHERM_00878160 240 TTHERM_00476810 n) 19 6 - 210 196 TTHERM_00037640 q) 24 1 - 255 241 TTHERM_00551090 197 TTHERM_01150350 242 TTHERM_00895630 198 TTHERM_00572010 243 TTHERM_000784569 199 TTHERM_00927240 244 TTHERM_001553979 200 TTHERM_01325790 245 TTHERM_000487129 201 TTHERM_00476940 246 TTHERM_00096700 202 TTHERM_00034920 247 TTHERM_00721250 203 TTHERM_000032894 248 TTHERM_00049120 204 TTHERM_00191140 249 TTHERM_00274520 205 TTHERM_01194830 250 TTHERM_00923150 206 TTHERM_00448660 251 TTHERM_00157960 207 TTHERM_00780980 252 TTHERM_000382269 208 TTHERM_00142430 253 TTHERM_00599920 209 TTHERM_00803680 254 TTHERM_00378450 210 TTHERM_00942980 255 TTHERM_00300400 o) 21 1 - 225 211 TTHERM_00624230 r) 256 - 271 256 TTHERM_00198520 212 TTHERM_00695650 257 TTHERM_00861570 213 TTHERM_000401918 258 TTHERM_00561510 214 TTHERM_001035531 259 TTHERM_00773180 215 TTHERM_00861580 260 TTHERM_00292110 216 TTHERM_00263660 261 TTHERM_000580366 217 TTHERM_01346830 262 TTHERM_000637329 218 TTHERM_00002770 263 TTHERM_000455599 219 TTHERM_00577080 264 TTHERM_00586670 220 TTHERM_00577050 265 TTHERM_00204150 221 TTHERM_00133680 266 TTHERM_00313580 222 TTHERM_00196220 267 TTHERM_01060860 223 TTHERM_00829370 268 TTHERM_00609380 224 TTHERM_00047580 269 TTHERM_00559950 225 TTHERM_000327209 270 TTHERM_00467450 271 TTHERM_00816260
29
1.3.3 Gene Set Enrichment Analysis (GSEA)
The GSEA of these DEGs indicated their involvement in various pathways. Most of the DEGs reported here, are induced by exposure to AgNPs. These genes are involved in various biological processes (BP) and molecular functions (MF), e.g.: transport, ion transport, response to stress and to stimulus, protein phosphorylation, oxidation-reduction process, response to oxidative stress and glutathione peroxidase activity (Figure 10).
Both AnNPs and AgNO3 treatments trigger the DEGs involved in ion binding mechanisms and the proteolysis pathway (Figure 11). The enrichment of proteolysis pathway genes is a signal of protein damage that is possibly caused by the oxidative damage produced by Ag compounds (Pan, Zhang, and Lin 2018).
AgNO3 treatment is specifically associated with the upregulation of genes encoding vesicle-mediated transport membrane proteins (Figure 12) which can be explained by the fact that the ciliate T. thermophila is able to internalize metal ions by phagocytosis. This means that the cell is exposed not only through its cell surface but also via internal membranes (Juganson et al. 2017; Mortimer, Kasemets, and Kahru 2010; Kahru et al. 2008).
30
Figure 10. Collargol-specific GO term enrichment analysis of DEGs. GO terms are divided in molecular function (MF) and biological processes (BP) GO categories.
0 5 10 15 20 25 30 35 40 proteolysis involved in cellular protein catabolic process
localization establishment of localization transport response to stress response to stimulus phosphorylation ion transport protein phosphorylation phosphorylation oxidation-reduction process cellular nitrogen compound metabolic process biosynthetic process response to oxidative stress peptidase activity acting on L-amino acid peptides active ion transmembrane transporter activity cation-transporting ATPase activity ATPase coupled ion transmembrane transporter activity coenzyme binding flavin adenine dinucleotide binding NADP binding monooxygenase activity oxidoreductase activity, acting on paired donors, with incorporation…
N,N-dimethylaniline monooxygenase activity oxidoreductase activity, acting on paired donors, with incorporation…
cation transmembrane transporter activity ion transmembrane transporter activity inorganic molecular entity transmembrane transporter activity inorganic cation transmembrane transporter activity kinase activity transferase activity, transferring phosphorus-containing groups protein serine/threonine kinase activity phosphotransferase activity, alcohol group as acceptor protein kinase activity motor activity oxidoreductase activity antioxidant activity iron ion binding peroxidase activity glutathione peroxidase activity oxidoreductase activity, acting on peroxide as acceptor cadmium ion binding
BP MF C oll ar gol S P E C IF IC number of genes
GO term enrichment analysis of DEGs.
31
Figure 11. AgNO3 and Collargol shared GO term enrichment analysis of DEGs. GO terms are divided in molecular function (MF) and biological processes (BP) GO categories.
Figure 12. AgNO3-specific specific GO term enrichment analysis of DEGs. GO terms are divided in cellular components (CC) and biological processes (BP) GO categories.
.
0 5 10 15 20 25 30
proteolysis metal ion binding cation binding transition metal ion binding peptidase activity BP MF Ag NO3 an d C o llar g o l SHAR E D number of genes
GO term enrichment analysis of DEGs.
Collargol 20 Collargol 10 AgNO3 1,52 AgNO3 0,76
0 1
vesicle-mediated transport clathrin adaptor complex clathrin coat membrane coat AP-type membrane coat adaptor complex membrane protein complex coated membrane BP CC Ag NO3 SP E C IFIC number of genes
GO term enrichment analysis of DEGs.
AgNO3 1,52 AgNO3 0,76
AgNO3 1.52 AgNO3 0.76
32
1.3.4 Generation of oxidative stress by AgNPs
Oxidative stress is a cellular damage mechanism caused by a high concentration of free radicals, including the so-called reactive oxygen species (ROS). It occurs when the formation of free radicals is higher than their elimination. All organisms have mechanisms to detoxify the oxidants or to repair the damage caused by ROS, including superoxide dismutases, catalases, peroxidases, glutathione, thioredoxin and heat shock proteins (Koduru et al. 2018), which are quite conserved from prokaryotes to eukaryotes. The expression of the genes coding these proteins (oxidative stress genes) is induced by changes in the concentration of ROS (Espinosa-Diez et al. 2015).
These results suggest that AgNPs induce oxidative stress in the cells in a concentration dependent way, since, thioredoxin and glutathione reductase family proteins and GPX are up-regulated compared to untreated cells, especially at the highest AgNPs concentration (Figure 13, Table 5). Tetrahymena haemoglobin is a small oxygen-binding hemoprotein evolved with a truncated structure. Various biochemical functions other than the more conventional oxygen transport or storage have been proposed for this primitive or ancient hemoglobin, but the precise in vivo activity is still unclear (Wittenberg et al. 2002). The HEM1 gene is not only upregulated under AgNPs stress, but also by AgNO3 1. 52 mg Ag/L (Figure 13, Table 5), thus indicating that this gene plays an important role in the oxidative stress response, more than what has been described so far.
Another route could be the activation of an inflammatory response, or a response to stimulus. Although the exact mechanism whereby NPs induce pro-inflammatory effects is not known, it has been suggested that phagocytized NPs can induce an inflammatory response, consequently leading to generation of reactive oxygen species and reactive nitrogen species. The oxidative stress results in the release of pro-inflammatory mediators or cytokines in higher organisms.
33
Figure 13. Heatmaps of DEGs of two top scored Biological Processes between different treatment groups: Oxidation–reduction process and Response to stimulus. CPM values are used to generate the heatmaps. Yellow arrows indicate genes that are significantly upregulated with at least 4-fold change. The colours range indicates the gene expression levels from purple (high expression) to light blue (low expression) The genes common names are listed in Table 5.