https://doi.org/10.5194/nhess-18-1825-2018 © Author(s) 2018. This work is distributed under the Creative Commons Attribution 4.0 License.
Linking source with consequences of coastal storm impacts
for climate change and risk reduction scenarios for
Mediterranean sandy beaches
Marc Sanuy1, Enrico Duo2, Wiebke S. Jäger3, Paolo Ciavola2, and José A. Jiménez1
1Laboratori d’Enginyeria Marítima, Universitat Politècnica de Catalunya Barcelona Tech, Barcelona, Jordi Girona 1–3, 08034, Spain
2Department of Physics and Earth Science, University of Ferrara, Via Saragat 1, Ferrara, 44122, Italy
3Department of Hydraulic Engineering, Delft University of Technology, Stevinweg 1, Delft, 2628 CN, the Netherlands Correspondence: Marc Sanuy ([email protected])
Received: 29 September 2017 – Discussion started: 9 October 2017 Revised: 16 May 2018 – Accepted: 23 May 2018 – Published: 3 July 2018
Abstract. Integrated risk assessment approaches to support coastal managers’ decisions when designing plans are in-creasingly becoming an urgent need. To enable efficient coastal management, possible present and future scenar-ios must be included, disaster risk reduction measures in-tegrated, and multiple hazards dealt with. In this work, the Bayesian network-based approach to coastal risk assessment was applied and tested at two Mediterranean sandy coasts (Tordera Delta in Spain and Lido degli Estensi–Spina in Italy). Process-oriented models are used to predict hazards at the receptor scale which are converted into impacts through vulnerability relations. In each site, results from 96 simu-lations under different scenarios are integrated by using a Bayesian-based decision network to link forcing character-istics with expected impacts through conditional probabili-ties. Consultations with local stakeholders and experts have shown that the tool is valuable for communicating risks and the effects of risk reduction strategies. The tool can therefore be valuable support for coastal decision-making.
1 Introduction
Increasing coastal risk due to the intensification of haz-ard and exposure magnitudes (IPCC, 2012, 2013) is driv-ing the needs of coastal managers towards more innovative approaches for coastal risk assessment and management. At the international and European levels these needs are
high-lighted by the impact of recent extreme events such as Hur-ricane Katrina in Louisiana in 2005 (Beven II et al., 2008), storm Xynthia in France in 2010 (Bertin et al., 2012; Kolen et al., 2013), Hurricane Sandy in New York in 2012 (Kunz et al., 2013; Van Verseveld et al., 2015), and the southern North Sea storm in 2013 (Spencer et al., 2015). Similarly, in the Mediterranean, several extreme events have impacted coastal communities at the local and regional levels such as storm Klaus in 2009, as described in Bertotti et al. (2012), and cyclogenesis mechanisms in the NW Mediterranean de-scribed in Trigo et al. (2002). In this context, the coasts of Catalunya (Spain) and Emilia-Romagna (Italy) also re-cently experienced coastal storm impacts that caused socioe-conomic losses (Jiménez et al., 2012; Perini et al., 2015; Harley et al., 2016; Trembanis et al., 2017).
Therefore, coastal managers must properly deal with coastal risk when designing management plans. This is recognised in several initiatives such as the protocol of In-tegrated Coastal Zone Management (ICZM) for the Mediter-ranean, which includes a chapter on natural hazards and ad-vises signed parties to implement vulnerability and risk as-sessments. In addition, the EU Floods Directive is another example dealing specifically with floods. Therefore, the need for integrated decision support systems based on modern approaches for coastal risk assessment is increasing. Cop-ing with storm-induced risks in coastal areas involves test-ing multiple risk reduction measures against multiple forc-ing conditions in current and future scenarios considerforc-ing climate change.
The literature provides different approaches with which to implement these assessments. It is becoming increas-ingly important to consider multi-hazard approaches when assessing risk at all levels (i.e. from the regional to local scales). Therefore, the scientific community provides inte-grated and interdisciplinary approaches (e.g. Ciavola et al., 2011a, b; Penning-Rowsell et al., 2014; Vojinovic et al., 2014; Oumeraci et al., 2015; Van Dongeren et al., 2018). Up-to-date methodologies can be used in coastal risk assess-ments at different scales ranging from regional (up to hun-dreds of kilometres) to local assessments (up to 10 km). Re-gional methodologies aim to locate coastal sectors more sen-sitive to impacts, the so-called hotspots. Local approaches aim to achieve the highest possible level of accuracy for risk evaluation and to support decision-making for previously identified hotspots. Notably, coastal risk assessments must include physical concepts to characterise physical phenom-ena (i.e. the source of the hazard) and socioeconomic con-cepts to describe the impact of the physical phenomena on human assets (i.e. the consequences). A conceptual flexible framework that can capture all aspects of coastal risk assess-ment is the source–pathway–receptor–consequence (SPRC) model (e.g. Narayan et al., 2014; Zanuttigh et al., 2014; Oumeraci et al., 2015).
When addressing the problem at the local scale, it is neces-sary to accurately predict the impact and reproduce in detail coastal hazards. The analysis of physical impacts is regularly implemented with process-based numerical models provid-ing detailed information for areas prone to multiple hazards (e.g. Roelvink et al., 2009; McCall et al., 2010; Harley et al., 2011; Roelvink and Reniers, 2012). However, multiple forc-ing conditions actforc-ing at the site and under different scenarios must be evaluated. Bayesian network-based (BN) approaches have demonstrated their versatility and utility in efficiently combining multiple variables to predict system behaviour for multiple hypotheses (e.g. Plant et al., 2016). The data assimilation capacity of BN approaches allows integrating many multi-hazard simulations from process-oriented mod-els for joint assessment of different scenarios and alternatives (e.g. Gutierrez et al., 2011; Poelhekke et al., 2016), includ-ing also socioeconomic concepts (e.g. Van Verseveld et al., 2015). This is an advantage compared to classical GIS-based approaches, which are more limited when combining large number of simulations in multiple subsets of scenarios.
Jäger et al. (2018) proposed the conceptual BN framework used in this work, which is based on the integration of the SPRC and was developed in the RISC-KIT EU FP7 project (Van Dongeren et al., 2018), where it was used as a Bayesian-based decision network (BDN). Plomaritis et al. (2018) ap-plied the framework to test its potential as an early warn-ing system and the response of risk reduction measures in Ria Formosa (Portugal). In this paper, the authors describe the application of the framework adapted to select and com-pare strategic alternatives to reduce coastal risk in current and projected future climate scenarios. The application was
con-ducted at two sedimentary coasts in the Mediterranean en-vironment, namely the Tordera Delta for the Catalan coast (Spain) and the Lido degli Estensi–Spina for the Emilia-Romagna coast (Italy). At both study sites, the tested mea-sures were pre-selected taking into account the outcome of interviews to stakeholders (see Martinez et al., 2018) and ob-tained results were used in a participatory process to select acceptable measures on the basis of a multi-criteria analysis (see Barquet and Cumiskey, 2018).
2 Regional contexts and case studies
The two presented case study sites are representative of many other coastal areas in the Mediterranean consisting of sandy beaches where local economic activities are based on the tourist sector. These areas are characterised by urbanisa-tion and infrastructural growth close to the shoreline (lim-iting natural beach accommodation processes) and economic activities located on the beach and immediate first part of the hinterland (e.g. concessions, campsites, restaurants). The coast keeps offering its recreational function, but loses its protective function against storms. In addition, the hinterland is exposed to storm-induced hazards.
2.1 Tordera Delta, Catalunya (Spain)
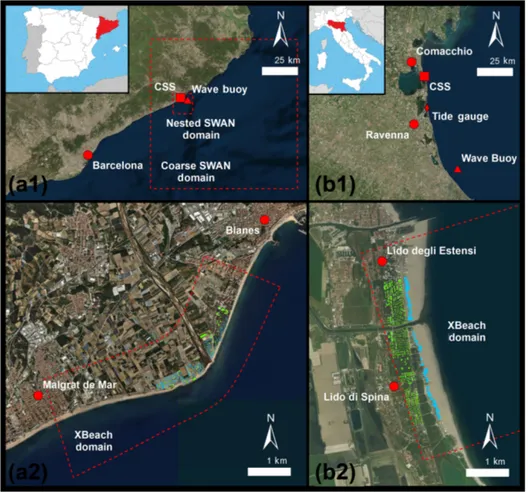
The Catalan coast is located in the NW Mediterranean Sea (Fig. 1a1). It consists of a coastline 600 km long with about 280 km of beaches. Coastal damage has increased during the last decades as a result of the increasing exposure along the coastal zone and progressive narrowing of existing beaches (Jiménez et al., 2012) through dominant erosive behaviour due to net littoral drift (Jiménez et al., 2011). Locations expe-riencing storm-induced problems are present along the entire coastline and are especially concentrated in areas experienc-ing the largest decadal-scale shoreline erosion rates. Among these areas, the Tordera Delta, located about 50 km north of Barcelona, provides a good example (Jiménez et al., 2018) (Fig. 2).
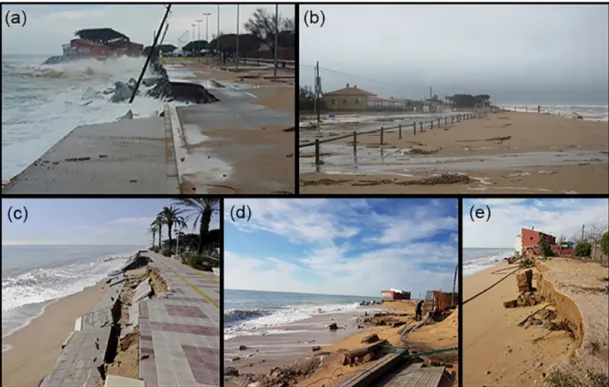
The deltaic coast is composed of a coarse sandy coastline extending about 5 km from S’Abanell beach at the northern end and Malgrat de Mar beach in the south (see Fig. 2). This zone is highly dynamic and is currently in retreat because of the net long-shore sediment transport directed southwest and the decrease in Tordera river sediment supplies. Con-sequently, the beaches surrounding the river mouth, which were traditionally stable or accreting, are being significantly eroded (Jiménez et al., 2011; Sardá et al., 2013). As a result of the progressive narrowing of the beach in the area, the fre-quency of inundation episodes and damage to existing infras-tructure (beach promenade, campsite installations, desalina-tion plant infrastructure, roads) has significantly increased since the beginning of the 1990s (Jiménez et al., 2011; Sardá et al., 2013) (Fig. 2).
Figure 1. Regional and local contexts: (a1) central-northern Catalan coast; (b1) Emilia-Romagna coast; (a2) local hotspot of Tordera Delta; (b2) local hotspots of Lido degli Estensi–Spina. The main locations (red dots), wave buoys (red triangles), tide gauge (red diamond), and the case study sites (red squares). The domains of the large-scale and local models (dashed red lines) are highlighted for each box.
Subsequently, existing campsites in the most affected zones have abandoned the areas closer to the shoreline, as in many cases, those are fully eroded or directly exposed to wave action. In other cases, owners have tried to implement local protection measures that in many cases have enhanced existing erosion (Jiménez et al., 2018).
Coastal storms in the Catalan Sea can be defined as events during which the significant wave height (Hs) exceeds a threshold of 2 m for a minimum duration of 6 h (Mendoza et al., 2011). Despite this, not all storms can be considered as hazardous events in terms of induced inundation and/or ero-sion. Mendoza et al. (2011) developed a five-category storm classification for typical conditions in the Catalan Sea based on their power content. The classification seems to well rep-resent the behaviour of storm events in the Mediterranean and was successfully employed in the Northern Adriatic (Ar-maroli et al., 2012). Furthermore, Mendoza et al. (2011) es-timated the expected order of magnitude of induced coastal hazards (erosion and inundation) for each class and beach characteristics along the Catalan coast. According to their re-sults, storms from category III (Hs = 3.5 m, duration around 50 h) to V (Hs = 6 m, duration longer than 100 h) are most
likely to cause significant damages. One important aspect to consider is that wave-induced run-up (setup + swash) is the largest contribution to overwash at the beach during storm events, because the magnitude of surges along the Catalan coast is relatively low (Mendoza and Jiménez, 2008). 2.2 Lido degli Estensi–Spina, Emilia-Romagna (Italy) The Emilia-Romagna (Italy) coast is located in the north-ern part of the Adriatic Sea (Fig. 1b1). The coast is about 130 km long and characterised by low-lying, predominantly dissipative sandy beaches. The coastal corridor has low elevations, mainly ranging from −2 to 3 m a.m.s.l. (Re-gione Emilia-Romagna, 2010). The area alternates between highly urbanised touristic zones and natural areas with dunes, which are often threatened by flooding and erosion (Re-gione Emilia-Romagna, 2010). The impact of coastal ero-sion was emphasised by subsidence due to water and gas extraction over the last century, especially in the Ravenna area (Taramelli et al., 2015), a decrease in riverine sediment transport because of the strong human influence on rivers and their basins (Preciso et al., 2012), and the reforestation of the Apennines (Billi and Rinaldi, 1997). Touristic activities
Figure 2. Impacts on the Tordera Delta. Destruction of a road at Malgrat (a); overwash at campsites north of the river mouth (b); destruction of the promenade north of the river mouth (c); beach erosion and damage to utilities and buildings at Malgrat (d, e).
(accommodation, food service, beach services) can be con-sidered main drivers of the coastal economy. Beach conces-sions, which provide beach and food services, have grown exponentially in number since the second half of the last century, with negative consequences on natural areas, as in the province of Ravenna (Sytnik and Stecchi, 2014). To pro-tect the coast and its assets from the impacts of flooding and erosion, regional managers have constructed hard defences (e.g. emerged and submerged breakwaters, groins, rubble mounds; Regione Emilia-Romagna, 2010) along the entire regional coast (over 60 % of the coast is protected) and regu-larly implement restorative nourishment plans.
During the last decades, several EU projects such as The-seus (www.theThe-seusproject.eu, last access: May 2018) and MICORE (www.micore.eu, last access: May 2018) provided a good understanding of hydro-morphodynamics and risks to the coast. These projects and works published in the in-ternational literature such as Ciavola et al. (2007), Armaroli et al. (2009, 2012), and Perini et al. (2016) were the prod-uct of strong collaboration between scientists and regional managers (Servizio Geologico Sismico e dei Suoli, SGSS). This led to the compilation and implementation of a storm database (Perini et al., 2011) and a regional early warn-ing system (Harley et al., 2016). The RISC-KIT project (www.risckit.eu, last access: May 2018) provided additional knowledge on this coastal area. The areas most exposed to coastal risk are well known, as can be seen in the works of Perini et al. (2016) and Armaroli and Duo (2018).
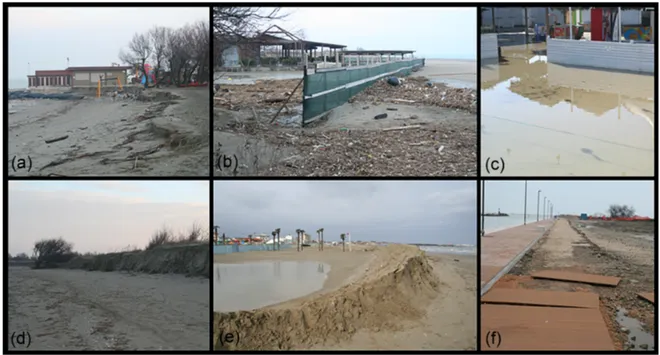
For a more local perspective, the Lido degli Estensi–Spina coastline (Comacchio municipality, Ferrara province, Italy) area represents a highly touristic stretch of coast with con-cessions directly facing the sea (Fig. 1b2). The littoral drift is northward as confirmed by the width of the sandy beaches, which increases from 20 to 50 m in the southern part of Lido di Spina to 200 to 300 m in the northern part of Lido degli Estensi. Here the sediment is trapped by the groin of the mouth of a navigation canal (Porto Canale). The beach is not protected, and regional managers implement regular nour-ishment in the southern part of the area (Nordstrom et al., 2015). At the back of the concessions, the villages accom-modate restaurants and hotels for tourists, along with resi-dential buildings (mainly holiday houses). In a recent study, Bertoni et al. (2015) analysed aerial photographs of the evo-lution of the case study area, focusing on the stretch of coast between Porto Garibaldi and the Reno river mouth. The area was impacted by the event in February 2015 (see Fig. 3) with limited, but not negligible, consequences for several conces-sions (Perini et al., 2015; Trembanis et al., 2017).
The hydrodynamics of the regional domain are well de-scribed in terms of storm waves and surges (IDROSER, 1996; Ciavola et al., 2007). The area is micro-tidal (neap tidal range: 0.3–0.4 m; spring tidal range: 0.8–0.9 m); the surge component plays an important role (1-in-2-year storm surge: 0.61 m) and is mainly generated from the SE (Scirocco) winds (according to the orientation of the Adriatic Sea). Fur-thermore, the wave climate is low energy (mean Hs −0.4 m; 60 % of waves are below 1 m). However, extreme events can
Figure 3. Impacts of the event in February 2015 on the Lido degli Estensi–Spina case study area. Impacts of erosion and flooding on concessions at Lido di Spina south (a, b) and Lido degli Estensi (c); sandy scarp due to the erosion of the dune in the south of Lido di Spina (d); eroded winter dune in Porto Garibaldi (e); damages to the Porto Canale front at the Lido degli Estensi (f).
be energetic, such as the storm of September 2004 (maxi-mum Hs = 5.65 m, estimated by Ciavola et al., 2007) or the one of 5–6 February 2015 (maximum Hs = 4.66 m, measured at the Cesenatico buoy shown Fig. 1b1; Perini et al., 2015; Trembanis et al., 2017).
The combination of high waves and storm surges, whose combined probability of occurrence in the area was assessed by Masina et al. (2015), can have strong impacts at the re-gional level, as demonstrated by Armaroli et al. (2009), Ar-maroli et al. (2012) and Harley and Ciavola (2013). Notably, based on historical data (Perini et al., 2011), Armaroli et al. (2012) provided a set of critical storm thresholds for natu-ral and urbanised beaches to characterise potentially impact-ing storms. The thresholds included a combination of off-shore Hs and total water level (TWL): (1) Hs ≥ 2 m and TWL (surge + tide) ≥ 0.7 m for urbanised zones and (2) Hs ≥ 3.3 and TWL (surge + tide) ≥ 0.8 m for natural areas with dunes.
3 Methodology
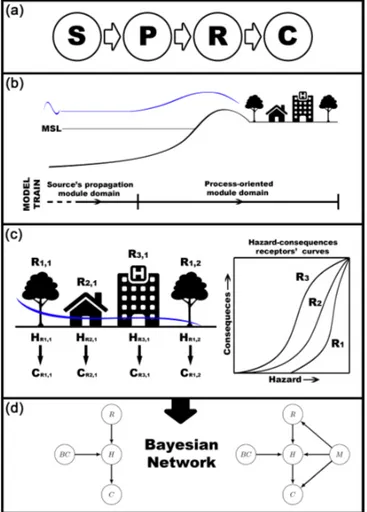
3.1 General approach: from source to consequences The analysis framework employed in this study follows Jäger et al. (2018) and is based on the use of the SPRC model (FLOODsite, 2009; Oumeraci et al., 2015), as shown in Fig. 4. This model is widely used in coastal risk management (e.g. Narayan et al., 2014) and permits a clear representation of all risk components and their links from source to conse-quence.
The source includes the forces determining coastal re-sponse to the impact of extreme storms, which in this case are essentially a set of events representative of the storm climates of the study sites over the entire intensity range (from mod-erate to extreme). These storms propagate through the path-way, causing erosion at the coast and inundation on the hin-terland. Both hazards are the main focus of the analysis. The pathway is solved through a process-oriented model chain to propagate storms and quantify induced processes. These are assessed for the entire coastal domain where receptors are present, characterised by their location and typology, which define their exposure and vulnerability to each hazard. Fi-nally, consequences are evaluated by combining the vulner-ability and exposure of each receptor with the magnitude of the hazards.
Since the main objective of the analysis is to test risk re-duction strategies to help decision makers in future planning, the framework is applied under current conditions (CUS), which define the baseline scenario and climate change sce-narios (CCSs) to define a plausible future projection. Finally, the analysis is repeated considering different risk reduction measures.
The BN approach reproduces the steps of the SPRC model through dependency relations between variables. This affects the application of the steps of the SPRC model, as explained in the following sections. At the same time, the BN data as-similation capabilities are used to integrate large amounts of simulations, i.e. results from multiple sources at multiple receptors. The BN integrates dependency relations between
Figure 4. General methodology. (a) The SPRC conceptual frame-work is implemented through (b) a model chain, which consists of a propagation module of the source (S) and a process-oriented module for the coastal area reproducing the pathway (P). Then, (c) the con-sequences (C) are calculated based on the computed hazards (H) at the receptor (R) scale by using vulnerability relations (i.e. hazard– consequences functions). In the last step (d), all variables including source boundary conditions (BC) are fitted in a BN, as well as im-pacts and the implementation of measures (M).
source, hazard, and consequences, at the receptor scale, for all available incoming conditions and scenarios.
3.2 Source: identification and design
To properly characterise storms, all relevant variables con-trolling the magnitude of induced hazards (erosion and inun-dation) must be considered, i.e. Hs, wave period (Tp), wave direction, storm duration, and water level. In this approach, source characteristics are defined in terms of a set of rep-resentative storms that cover the typical conditions at each study site. This information is obtained from existing wave time series or bulk data of the events (recorded or modelled), usually in deep waters, propagated towards the coast to char-acterise storm conditions at the nearshore of the study areas. Probable combinations that cannot be covered using
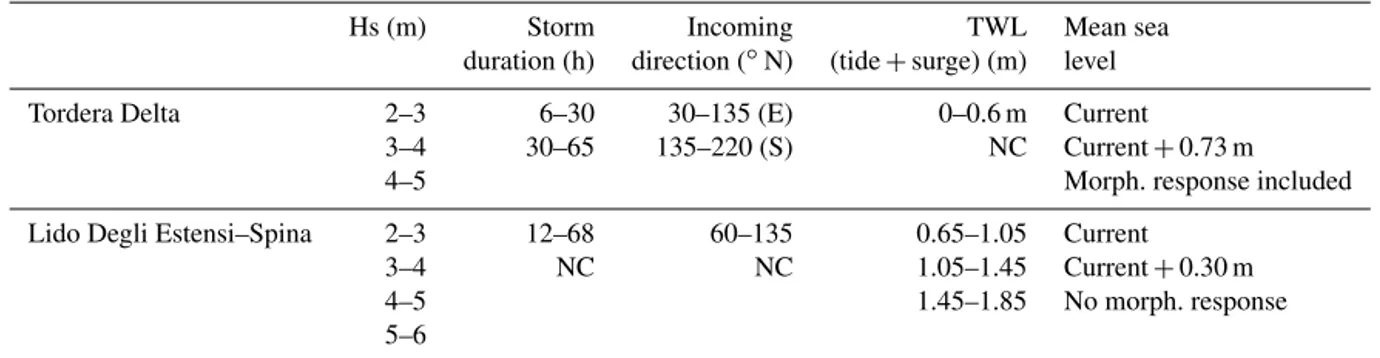
exist-ing records are represented by synthetic design storms (e.g. Poelhekke et al., 2016; Plomaritis et al., 2018; Jäger et al., 2018). The storm events were selected based on the infor-mation available for each study site through the RISC-KIT WEB-GIS impact-oriented database (Ciavola et al., 2018; http://risckit.cloudapp.net/risckit/#/), which provided storm characteristics and socioeconomic impacts of the events. In addition, time series of waves (either bulk Hs, Tp and mean direction, or spectrum) and water levels during each storm event were used when this information was available. In or-der to be used in a BN approach, storm characteristic vari-ables must be discretised in ranges which define the resolu-tion of the source descripresolu-tion. In this applicaresolu-tion, used simu-lations cover uniformly all variable combinations, assuming no prior knowledge of their statistics.
For the Tordera Delta case, the selected variables to de-fine storm scenarios were Hs at the peak of the storm, to-tal storm duration, and incoming storm direction. Tp does not significantly vary during storms in the study area (see Mendoza et al., 2011) and was not included as a character-istic variable. Due to the coastline configuration and mor-phology, the area is sensitive to the direction of the incom-ing storm (Sanuy and Jiménez, 2018). Thus, the main di-rections in terms of dominant (E) and secondary (S) storms needed to be considered separately. Finally, the position of the mean sea level (MSL) during the event was included to reproduce hypothetical future projections of sea level rise (SLR) due to climate change. The selected bins for each variable can be seen in Table 1. These lead to 12 combina-tions defining the source under current MSL and 12 under future MSL (given by a SLR scenario). Each combination of states is represented by two simulations of slightly differ-ent storms to account for potdiffer-ential variability within variable ranges, leading to a total of 24 simulations under the current MSL and 24 under SLR. Of the 24 simulations under current MSL, 16 correspond to historic (recorded) events including the two largest, which occurred in November 2001 and De-cember 2008. These were classified as extreme storms (cat-egory V) according to the Mendoza et al. (2011). To include the full range of cases, the remaining eight storms were com-pleted by using combinations of Hs–duration–direction not previously recorded. These events were modelled assuming they follow a triangular-shaped evolution with the peak in-tensity at the half of their duration (see e.g. McCall et al., 2010; Poelhekke et al., 2016). Data used to reproduce the historic events include the time series of hindcast wind fields and 2-D wave spectra time series in deep waters for the NW Mediterranean (Guedes-Soares et al., 2002; Ratsimandresy et al., 2008). Wave conditions must propagate towards the coast to properly define storm events at the study site. At the Catalan coast, the storm surge contribution to the sea surface level is a magnitude lower than the wave-induced compo-nent, and the two variables are uncorrelated (Mendoza and Jiménez, 2008). All historical events with recorded associ-ated water levels were simulassoci-ated with the real storm surge,
Table 1. Source characterisation. Variable discretisation applied at the study sites. NC denotes a variable not considered in a study case and therefore not divided in ranges.
Hs (m) Storm Incoming TWL Mean sea duration (h) direction (◦N) (tide + surge) (m) level Tordera Delta 2–3 6–30 30–135 (E) 0–0.6 m Current
3–4 30–65 135–220 (S) NC Current + 0.73 m 4–5 Morph. response included Lido Degli Estensi–Spina 2–3 12–68 60–135 0.65–1.05 Current
3–4 NC NC 1.05–1.45 Current + 0.30 m 4–5 1.45–1.85 No morph. response 5–6
while the synthetic storms were simulated with a storm surge of a 0.25 m constant throughout the event, as representative of the site according to the same authors.
Previous works in the area of the Lido degli Estensi–Spina case study have identified the dominant role of wave height and total water level in controlling the magnitude of storm-induced erosion and inundation (Armaroli et al., 2009, 2012). Due to this, variables used to characterise the source were the maximum Hs and maximum TWL (surge + tide) during each storm event. Thus, wave period and the direction of the storms were not considered as a source characteristic variable to be discretised. The used range for each variable is shown in Table 1. Seven historically based events were selected from the RISC-KIT Database, and to cover all 12 possible com-binations in the CUS five additional synthetic events were considered. Notably, for several historic events, neither re-liable nor continuous time series for waves and water lev-els were available from local measuring stations. To ensure consistency, both historical and synthetic events were rep-resented based on the following methodology. Starting with the list of bulk information for each event (maximum Hs, Tp, main direction of the storm, maximum TWL or duration when available), storms following triangular-shaped evolu-tion (e.g. Carley and Cox, 2003; Corbella and Stretch, 2012) for Hs, Tp, and surge were created. The peak of the waves was assumed to occur at the same time as the maximum surge (calculated as the difference between the TWL and maximum astronomical predicted tide). When bulk param-eters were missing, the following “worst case” assumptions were introduced: Tp at peak of 10 s, wave direction orthog-onal to the shoreline, and duration based on similarity with other storms. Each storm representing a Hs–TWL combina-tion was simulated twice, with slightly different direccombina-tions, to account for potential variability on source characteristics, leading to 24 simulations in the CUS. Additional 24 simula-tions were performed to cover the CCS.
3.3 Pathways: modelling multi-hazard impacts
To simulate the pathway and obtain hazards of interest, a model chain was designed and adapted for each site (Fig. 4b). Any model can be used within the model chain, and results will be as good as the model is accurate. The chain must be able to reproduce all hazards to be assessed (i.e. erosion and inundation). To do this, a detailed 2-D process-oriented model designed to simulate coastal storm-induced processes is used, the XBeach model, which is able to provide inte-grated information on inundation and erosion (see Roelvink et al., 2009, for model details). At present it is a state-of-art model on coastal systems. However, the proposed framework can work with different (simpler) models when they are able to simulate the target processes (inundation and erosion). The XBeach model was used in both study cases.
The model chain for the Tordera Delta consists of two blocks, one “external” and one “internal”. The external mod-ule comprises three models (HAMSOM, HIRLAM, and WAM) that supply the forcing conditions (time series of wa-ter levels, wind fields, and waves) and are run by Puertos del Estado (Spanish Ministry of Public Works). The output of these models is taken directly as an input for the inter-nal module, which comprises the SWAN (Booij et al., 1996) and XBeach (Roelvink et al., 2009) models. SWAN was used to propagate wave conditions from deep waters to the off-shore boundary of the XBeach model (20 m depth), while XBeach was employed to assess the extension and magni-tude of inundation and erosion at the study site (local scale). The model chain was validated through the St. Esteve event in 2008, obtaining a Brier skill score of 0.68 for the morpho-logical response of the emerged part of the beach (Sanuy and Jiménez, 2018). Simulation results can be considered excel-lent for scores over 0.6 (Sutherland et al., 2004)
The model chain for Lido degli Estensi–Spina only in-cluded the XBeach model. This simple approach was pos-sible based on the assumption that the information derived from the RISC-KIT Database can be considered representa-tive of the storm in the domain, as collected from different sources (e.g. offshore buoys, harbours’ tide gauges,
newspa-pers) along the Emilia-Romagna coast (Perini et al., 2011; Ciavola et al., 2018). The model was qualitatively validated using observed inundation extension and profile beach re-sponse of the February 2015 event (Perini et al., 2015; Trem-banis et al., 2017).
3.4 Receptors and consequences
The methodology applied in this work individually identi-fied receptors located at the study sites (Fig. 4c) (Jäger et al., 2017). First, receptors with homogeneous vulnerability char-acteristics were defined and separately considered. Then, for each group of receptors, polygons were drawn using a GIS-based tool to account for their exact location and size. Fi-nally, the polygons were intersected with the cells of the 2-D detailed model grid (XBeach) to assign to each receptor the nodes of the model that will affect it.
For the inundation hazard, the value of the maximum water depth inside each polygon (receptor) was used as the impact variable. Then, by using flood-damage curves for the cor-responding receptor typology, inundation water depth was translated to relative damage. This was then translated into four levels of impact – none, low, medium, and high – which are dependent on the case and receptor (see the following sections). The chosen damage curves do not include uncer-tainties, and they are used as recommended by the Admin-istration at each study site. This implies that damage ranges and damage–hazard relations are different and, therefore, fi-nal impact levels (from none to high) are specific to the site. This assumption aimed to better communicate results to local stakeholders.
The magnitude of the risk associated with erosion de-pends on the combination of vertical erosion and distance of erosion to the receptors. This was implemented by build-ing multiple buffers (increasbuild-ing in distance) around each re-ceptor and applying the polygon intersection formerly ex-plained with the gridded maximum vertical erosion output from XBeach. The definition of risk categories related to ero-sion thresholds and distances is also site dependent, given their different morphologies.
3.4.1 Exposure and vulnerability in the Tordera Delta case study
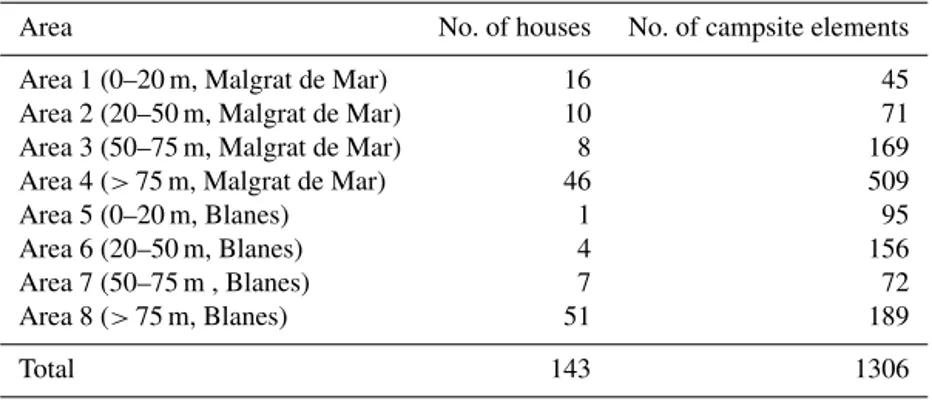
The distribution of receptors for the Tordera Delta case study was derived from cartographic information of the Catalan Cartographic Institute and completed manually through or-thophoto analysis. The study site was divided into eight ar-eas, of which four are located at the south of the river mouth, corresponding to the Malgrat de Mar municipality, and the other four to the north, corresponding to the Blanes munic-ipality. These two sets of four areas were selected to enable the analysis of the impact at different bands regarding their distance to the limit of the public beach. The first band cor-responds to the first 20 m of hinterland. The second band is
30 m wide and located just after the first one, i.e. 20 to 50 m from the boundary of the public domain. The third covers the range from 50 to 75 m, while the fourth band covers all the hinterland omitted between the end of the third band and the inland domain boundary. This enables an assessment of the distribution of the impacts in terms of distance to the coast-line and allowed exploring setbacks as risk reduction mea-sures. Three groups of receptors were identified to be homo-geneous in terms of vulnerability, namely houses (concrete buildings), campsite elements (soft buildings and caravans), and infrastructure (promenade and road at the back of the beach). Table 2 shows the distribution of campsite elements and houses in the different areas. The infrastructural recep-tors (promenade at the north and road at the south) are only located in the first 20 m band (areas 1 and 5).
The consequences of flooding were assessed through flood-damage curves used to characterise the relative dam-age based only on water depth (Table 3). Data were obtained from the Agència Catalana de l’Aigua (2014).
The relative damage values to buildings and campsite ele-ments were converted into the level of risk as follows: (i) no impact for 0 % relative damage to buildings and campsite el-ements; (ii) low impact for damages below 26 % to buildings and 50 % for campsite elements; (iii) medium impact when damages to buildings range from 26 to 45 % and damages to campsite elements range between 50 and 70 %; and (iv) high impact for relative damages higher than those formerly ex-posed for both receptors.
The buffers defined to assess the erosion hazard at the Tordera Delta are as follows: (i) a 20 m distance was used as a threshold from “none” to “low” erosion risk and cor-responds to the average beach retreat at the site for a storm with a return period of 38 years (commonly used for infras-tructural receptors similar to those in the Tordera Delta for a lifetime of about 25 years). (ii) The 12 m buffer (average retreat for the 10-year return period) was used as the thresh-old from low to “medium” impact. Medium impact is a post-monitoring situation where receptors will be exposed to the direct impact for relatively frequent storms. (iii) Finally, the 3 m buffer was used as the threshold for “high” impact risk, meaning that the receptor is directly affected by erosion at the toe or impacted by waves during the storm. A buffer was considered to be affected when vertical erosion was higher than 50 cm.
3.4.2 Exposure and vulnerability in the Lido degli Estensi–Spina case study
The analysed receptors belong to the central area of the model domain at approximately 600 m from the lateral boundaries (Fig. 1b2). Two main types of receptors were se-lected: (i) the residential and commercial buildings mainly present in the towns of Lido degli Estensi and Lido di Spina and (ii) beach concessions on the beach directly facing the sea. In this study, only receptors belonging to the seafront of
Table 2. Distribution of receptors at the Tordera Delta study site.
Area No. of houses No. of campsite elements Area 1 (0–20 m, Malgrat de Mar) 16 45 Area 2 (20–50 m, Malgrat de Mar) 10 71 Area 3 (50–75 m, Malgrat de Mar) 8 169 Area 4 (> 75 m, Malgrat de Mar) 46 509 Area 5 (0–20 m, Blanes) 1 95 Area 6 (20–50 m, Blanes) 4 156 Area 7 (50–75 m , Blanes) 7 72 Area 8 (> 75 m, Blanes) 51 189
Total 143 1306
Table 3. Vulnerability relations for houses and campsite elements at the Tordera Delta study site with and without flood resilience measures (FRM).
Relative damage (%)
Water depth at the Houses Campsites Houses Campsites
receptor (m) – FRM – FRM 0 0 0 0 0 0–0.3 18.3 50 0 0 0.3–0.6 26.5 71 18.3 50 0.6–0.9 33.2 82 18.3 50 0.9–1.5 44.7 89 26.5 71 1.5–2.1 54.1 91 33.2 82 2.1–3.0 64.5 100 44.7 89 3.0–4.0 71.2 100 54.1 91 4.0–5.0 75 100 64.5 100
Table 4. Distribution of the receptors at Lido degli Estensi and Lido di Spina.
Area Residential and Concessions commercial
buildings
Lido degli Estensi seafront 26 16 Lido di Spina seafront 47 28
Lido degli Estensi and Lido di Spina were considered, as they are mainly impacted by sea storms. Receptors were extracted from a recent regional topographic map (Carta Topografica Regionale, scale 1 : 25 000, year 2013). Table 4 summarises the identified receptors.
The vulnerability relation for inundation hazards was de-fined considering a flood-damage curve from a recent study on Italian territory by Scorzini and Frank (2015). This work was based on a micro- and macro-scale study of the impacts of the 2010 river flood in Veneto (Italy) on residential houses. In the current work, it was adapted and applied to the re-ceptors of the area (see details in Table 5a) and relates the relative damage factor (values: 0–1) to flood depth. In
partic-Table 5. Vulnerability relation for flooding adopted for the receptors at Lido degli Estensi–Spina without (a) and with flood resilience measures (b).
Flood relative damage factor (–) (a) Adapted from (b) Modified Flood depth (m) Scorzini and considering Frank (2015) the FRM 0 0 0 <0.3 <0.1 <0.1 0.3–0.7 0.1–0.2 <0.1 0.7–1.1 0.2–0.3 0.2–0.3 >1.1 >0.3 >0.3
ular, the worst case curve was used, which represents flood-related damages to single-family detached buildings with a basement. Although this curve is for residential buildings, it was assumed the same for commercial buildings and beach concessions, as no additional and specific information was available. The curve was modified considering the risk re-duction implementation described in Sect. 3.5.2. The level of flood risk was defined as follows: none, when the relative damage is null; low, when the relative damage factor is higher than zero but lower than 0.1; medium, for a factor between 0.1 and 0.2; and high, for a relative damage factor higher than 0.2.
The vulnerability relation for erosion was defined for con-cessions only. The impacts due to the erosion hazard were defined based on a two-buffer approach for each receptor: the first buffer was the receptor limits in the ground, and the second included a corridor of 10 m around the receptor.
Erosion was considered present if > 0.05 m (vertical) and significant when > 0.5 m. The erosion risk categories for each receptor were set as follows: (i) safe, when there is no erosion in any buffer; (ii) potential damage, when erosion is present in the 10 m buffer and/or present but not significant in the receptor itself; and (iii) damage, when the erosion limit of 0.5 m is exceeded within the receptor limits. Notably, the threshold of 0.5 m was set by considering the uncertainty of
the model grid topography (±0.15 m) and assuming that the foundations of the concessions are a minimum of 0.2 m thick. 3.5 Testing scenarios and risk reduction alternatives To compute the analysis under CCSs and under the imple-mentation of risk reduction measures, it was necessary to identify the variables and settings affected by each scenario, either a future projection or implementation of a measure. Therefore, an appropriate approach was selected to consider these modifications in the methodology chain.
The CCSs mainly affect the hazard and, therefore, are ap-plied in the modelling chain. The risk reduction measures can affect both hazard and vulnerability/exposure variables. In the following, the implementation of the CCSs and mea-sures is described for each case study, emphasising the af-fected variables and steps of the methodology. The measures were pre-selected considering interviews with stakeholders and were assumed to be fully implemented and completely effective (measure uptake and effectiveness: 100 %) in all cases.
3.5.1 Climate change scenarios in the case studies Future projections of MSL were based on the AR5 RCP8.5 (Church et al., 2013). Other factors such as changes in storminess, wind speed, or wave height were not expected to change significantly in the NW Mediterranean (Lionello et al., 2008; Conte and Lionello, 2013) and are characterised by high uncertainty in the Northern Adriatic (IPCC, 2013). Data to include the SLR in the assessment of future scenarios were provided by the EC Joint Research Centre database (for further detail, see Vousdoukas et al., 2016). For the Tordera Delta study case, the time horizon of 2100 was chosen, while the 2050 projection was used for Lido degli Estensi–Spina, because the projections in the Adriatic are more uncertain than in the NW Mediterranean. Therefore, the 2100 horizon could yield highly unreliable results.
At the Tordera Delta, the RCP8.5 estimates an increase of 0.73 m by 2100. Therefore, all 24 simulations described in Sect. 3.2 were repeated with the projected future sea level. Moreover, the potential beach accommodation to SLR was modelled following Bosom (2014) and Jiménez et al. (2017). This was accomplished assuming an equilibrium coastal pro-file response following the Bruun rule (Bruun, 1962), re-sulting in landward and upward displacement of the beach profile. Dunes preserve the pre-SLR shape when there is enough accommodation space, otherwise the shape is cut. The estimated shoreline retreat due to the SLR in the area is 22 m. Thus, morphological response to SLR is included in the assessment. Finally, Casas-Prat and Sierra (2012) pre-dicted a directional change in mean sea conditions from the current dominant (E) to the secondary direction (S). This ef-fect was explored by assessing only eastern incoming storms in present conditions and imposing an equal frequency of
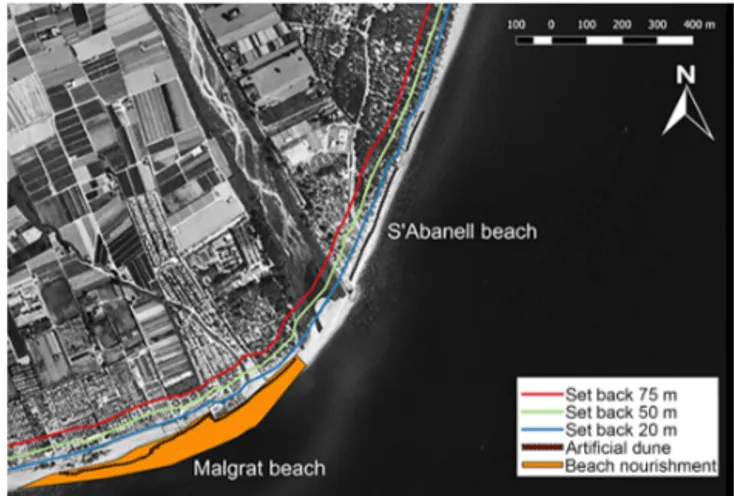
Figure 5. Risk reduction measures at Tordera Delta: receptor set-backs (20, 50, and 75 m) and nourishment + dune (beach nourish-ment at Malgrat beach + artificial dune at S’Abanell and Malgrat beaches).
eastern and southern incoming storms in future projections. Therefore, three different CCSs were explored: (i) CCS1 is CUS + SLR with the corresponding estimated beach accom-modation; (ii) CCS2 is CUS + effect of direction switch of incoming storms, and (iii) CCS3 is the assessment of the con-tribution of both components if occurring at the same time.
In Lido degli Estensi–Spina, the combined contribution of the predicted SLR with the subsidence component (not negligible in the area; e.g. Taramelli et al., 2015) was imple-mented. The resulting value of relative SLR by 2050 used in the analysis is 0.30 m. The position of the MSL was changed for all forcing events, adding the predicted relative SLR by 2050 in the CCS. The morphological accommodation to the SLR was not implemented in the numerical analysis; how-ever, the implication of this choice is discussed in Sect. 5.2. In total, 24 additional simulations were run for the CCS. 3.5.2 Risk reduction alternatives in the case studies Three risk reduction measures were tested for the Tordera Delta zone (see Fig. 5): (i) receptor setback, (ii) flood re-silience measures, and (iii) nourishment + dune.
The receptor setback measure affects the exposure of the receptors. It entails removing all receptors inside a defined band measured from the public domain coastal limit (the limit between the back of the beach and hinterland). Three scenarios of the setback were simulated: 20, 50, and 75 m.
The flood resilience measures affect the vulnerability of receptors so that for a given water depth, the expected impact decreases when the measure is implemented. It was assumed that resilience measures such as raised electricity outlets and utilities, adapted flooring, resilient plaster, and waterproof doors and windows were installed in all houses and camp-site elements. This measure was implemented by assuming a modified damage curve as shown in Table 4.
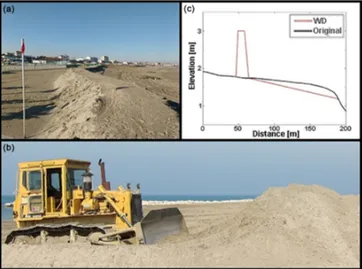
Figure 6. Artificial winter dunes in Emilia-Romagna: (a) winter dune in Porto Garibaldi (Comacchio, Italy); (b) building of a winter dune by beach scraping at Lido di Dante (Ravenna, Italy) (Harley, 2014); (c) representative model profiles at Lido di Spina north (orig-inal: black solid line; with winter dune measure: red dashed line).
Finally, the nourishment + dune changes the pathway and affects the inundation/erosion hazard. It includes beach nour-ishment at the south of the river mouth to increase the beach width by 50 m over 1 km, where the highest erosion occurs. In addition, the level at the top of the beach was increased on both sides of the river mouth, with non-erodible sandbags at the northern side, where the campsites are closer to the coast-line, and a sandy dune at the southern side. At both sides, the final height of the protective measure was +4.8 m a.m.s.l. Since this measure affects the pathway, it had to be imple-mented in the XBeach grid. Thus the 48 storms (24 current MSL, 24 current MSL + SLR) were simulated again with the edited morphology arriving to the final 96 simulations.
The selected measures tested for the Lido degli Estensi– Spina case study were (i) a winter dune system, affecting both flooding and erosion impacts, and therefore the hazards modelling process and (ii) flood resilience measures, influ-encing the flood vulnerability relations of receptors.
The winter dune (see Fig. 6) is a common risk reduc-tion practice along the Emilia-Romagna coast, especially in the Ravenna province (Harley and Ciavola, 2013), and reg-ularly implemented by local concessionaires without a sci-entifically based design criterion. It consists of a set of em-bankments built on the beach in front of concessions through beach scraping or sand replenishment (less frequent option). This risk reduction measure was implemented in the XBeach model. The winter dune was designed as a continuous dune that protects more than one concession, introducing breaks in the continuity of the feature where natural or human obsta-cles or passages were located. The top of the dune was fixed at 3 m a.m.s.l. and the width (at the top) at 10 m. The dune was integrated in the model modifying the bed levels through
Figure 7. BN graph with four nodes.
the DuneMaker 2.0 tool (Harley, 2014). Both the CUS and CCS were tested with this measure adding 48 additional sim-ulations.
The flood resilience measures decrease the receptor’s physical vulnerability to floods. It was assumed that the ef-fective application of these measures would decrease the damages for water levels lower than a certain threshold, as-sumed here as 0.7 m (e.g. all electronics must be placed above the threshold). This assumption was integrated in the analysis by modifying the selected depth–damage curve, as defined in Table 5b, and included in the BN. Considering the adopted definition of flood risk levels (see Sect. 3.4.2), the measure results in a complete obliteration of receptors for the medium flood risk, therefore increasing the receptors at the low level and not affecting receptors at high risk. 3.6 Bayesian-based decision network.
BNs use probability theory to describe the relationships be-tween many variables and can evaluate how the evidence of some variables influence other unobserved variables. For ex-ample, evidence could be a forecast of the source variables characterising an impending storm. In contrast, local hazards and damages in the coastal area have not yet been observed, but can be predicted with the BN. The model can also be up-dated with artificial evidence to explore extreme event sce-narios or investigate the potential of risk reduction plans.
A BN is based on a graph (Fig. 7). It consists of nodes con-nected by arcs that represent random variables and the poten-tial influences between them. The direction of the arcs is cru-cial for the probabilistic reasoning algorithm of the BN, but does not necessarily indicate causality. For any two variables connected by an arc, the influencing one is called a parent, while the one influenced is referred to as the child. Thus, in Fig. 7, X1, X2, and X3are the parents of X4. A simple way to parameterise a BN is to discretise continuous variables after defining their data range and to specify conditional probabil-ity tables for each node. The authors adopted this approach. The conditional probability tables indicate how much a vari-able could be influenced by others. Mathematically, the graph structure and conditional probability tables define the joint
distribution of all variables in the network, X1, . . . , Xn, based on the factorisation of conditional probability distributions (Eq. 1): p (X1, . . .,Xn) = n Y i=1 p (Xi |pa (Xi)) , (1)
where pa(Xi)are the parents of node Xi(Pearl, 1988; Jensen, 1996). Once the joint distribution has been defined, the ef-fects of any evidence can be propagated with efficient algo-rithms throughout the network (Lauritzen and Spiegelhalter, 1988).
In the RISC-KIT project, a generic structure for a BN-based approach that can support decision-making in coastal risk management was proposed. This structure is based on the SPRC and has five components (node types): source boundary condition, hazard, receptor, impact/consequence, and risk reduction measure. Typically, each component in-cludes several variables. Figure 4d shows their influence on each other. In general, all boundary conditions influence all hazards. Each type of receptor (e.g. people, buildings, infras-tructure, and ecosystems) is represented by a node where dif-ferent areas are the difdif-ferent bins (proxy for the locations of receptors on the site). Hazard intensity is conditioned by the location of the receptors and the presence of measures. Con-sequences are conditioned by hazard intensity, receptor type and presence of measures.
Alongside the generic structure, a C++ programme that automatically creates the BN (https://github.com/openearth/ coastal-dss, last access: May 2018) is also provided. As in-put, the programme requires variable definitions and land-use data, vulnerability relationships, and a 2-D gridded sim-ulation output of numerical physical process-based models of hindcast or synthetic extreme event scenarios. Essentially, the programme extracts the values of hazard variables from the simulation output at the locations of every individual re-ceptor so that hazard distributions for each rere-ceptor type can be obtained. Because each simulation contains the coastal re-sponse to one storm scenario under a specific set of measures, the distributions are conditional and can be stored directly as entries of the conditional probability tables associated with each hazard node. Being parents of the hazard nodes, bound-ary conditions, receptors’ areas, and risk reduction measures define the dimensions of the conditional probability tables. In the final step, the conditional hazard distributions were transformed to conditional impact distributions with vulner-ability steps. In the present application, the BN-based ap-proach is applied assuming no prior knowledge on the statis-tics of the source. Thus, all source variable combinations are equally fed into the BN resulting as uniform distributions of either Hs, duration, TWL, or direction. Each combination is represented by two simulations of slightly different storms to include some uncertainty due to intra-bin variability. No other uncertainty is included. Therefore, the present appli-cation is deterministic, a Bayesian-based decision network
which mainly uses the data assimilation capacity of the BN as principle advantage with respect to other methodologies (e.g. GIS-based assessments). Additionally, the BDN allows also reverse assessments, where output variables (i.e. conse-quences) can be constrained to get conditioned results on the source variables. In the Discussion section further guidance into a fully probabilistic BN approach integrating multiple sources of uncertainty is presented.
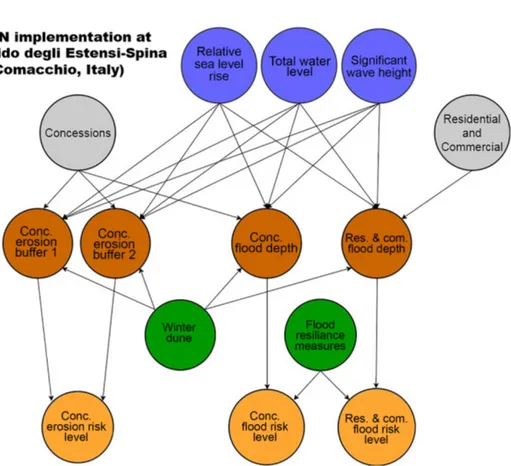
3.6.1 BDN implementation at the case study sites The schemes of the BDNs implemented for the Tordera Delta and Lido degli Estensi–Spina case study sites are shown in Figs. 8 and 9, respectively. The nodes (circles) define the variables of the network, while arcs (arrows) show the rela-tions between the variables. The boundary condirela-tions (blue), and the location and distributions of the receptors (grey) af-fect the hazards’ nodes (dark orange). The hazard is then transformed through the vulnerability relations into conse-quences (light orange). The measures’ nodes (green) can af-fect different node types depending on the efaf-fect (by defini-tion) of the measure. The structure is very flexible and can be applied at different coastal settings. The scheme can be adapted with different boundary conditions, hazards, recep-tors, consequences, and measures, depending on the needs driven by research and/or coastal management objectives. It follows that, for very similar coasts, or even for the same case study, the scheme can differ. The variables and bin ranges characterising boundary conditions are pre-selected by the user. Bins are equidistant and covering the observed values at each study site (Table 1). Additional non-observed ranges are introduced to account for SLR. The used number of intervals is a compromise between accuracy and computational effort. A total number of 96 model runs were required for the ap-plied setup at each case study site. As a reference, using par-allel simulations with 48 threads, the ratio computation time over real storm time was ∼ 0.2, meaning that a 40 h storm takes ∼ 8 h of simulation time.
4 Results
The results of scenario testing are provided for each case study through an integrated comparison of percentages of re-ceptors at each level of flooding and erosion risks. This is done by comparing the risk levels under current and CCSs, with and without measures. The results of the scenarios that will be presented in the following sections are produced by integrating in subsets all 96 simulations at each study site.
Figure 10 shows an example of the integration of simula-tions at the Tordera Delta considering the CUS without mea-sures. The figure includes three boxes with different level of (un)constrained boundary conditions and corresponding re-sults in terms of erosion risk to infrastructures. In box A, both Hs and storm duration are constrained to a specific bin (in
Figure 8. Bayesian network scheme for the Tordera Delta site.
Figure 10. Example of result integration in the Bayesian-based decision network. Combinations of Hs and duration to obtain erosion risk at infrastructures in Tordera Delta. Total water level is constrained to “current” and direction to eastern incoming storms.
this case given by the highest values) and thus, results of two different simulations are integrated to obtain the final output. In box B, Hs is unconstrained while duration is constrained to the highest bin. In this case, the final result is produced by integrating six simulations (two per each Hs bin). Finally, in box C, both Hs and duration are unconstrained and the output is given by integrating 12 simulations (2 per each Hs and du-ration bin combination), which represent the overall dataset for CUS without measures for Tordera Delta.
The current BDNs have been fed assuming no prior knowl-edge on the boundary conditions’ distributions (i.e. any boundary condition is uniform when unconstrained). This approach is adequate to explore scenarios and to assess the efficiency of protection measures in terms of impact reduc-tion.
4.1 Tordera Delta
The result assessment was performed separately for both sides of the river at S’Abanell beach at the north and Mal-grat beach at the south. The inundation impact assessment considered all receptors at the study site whereas the erosion analysis focused only on the first 20 m band of hinterland because the only receptors exposed to an erosion hazard are located in that area.
The results of the flooding impacts, here presented for campsite elements, indicate that under current conditions, re-ceptors at both sides of the river mouth are expected to suffer the same magnitude of damages: 80–83 % of elements will
be safe, while only 2–3 % of the elements are under high-impact risk (Fig. 11).
Under CCSs, a different behaviour at each side of the river mouth is detected. Southwards of the river mouth, the beach is highly sensitive to changes in both storm direction and SLR (Figs. 11 and 12). Thus, when CCS3 conditions are analysed in Malgrat, the BDN indicates that 69 % of campsite elements are affected, with 41 % being at high risk. In con-trast, the beach at the north (S’Abanell) is highly sensitive to SLR (CCS1, Fig. 11) but it is not affected by a potential change in storm direction (CCS2 and CCS3, Fig. 12).
Comparing the effectiveness of the risk reduction mea-sures highlights nourishment + dune as the most effective one against flooding under current and climate change sce-narios. As expected, the effectiveness is higher in Malgrat than in S’Abanell, as beach nourishment is located only south of the river mouth whereas the dune is present on both sides. It was observed that all significant impacts (medium and high) to receptors under current scenario were removed for both sides of the river. Moreover, at Malgrat, the number of affected receptors was reduced by ∼ 20 % for the CUS, CCS1, and CCS2 scenarios and ∼ 40 % under CCS3.
The implementation of the flood resilience measures was effective in terms of preventing high impacts on any receptor, but did not significantly reduce the total number of receptors affected by some level of risk. The magnitude of reduction of receptors at risk was ∼ 9 %. It should be mentioned that this is a theoretical measure, as we assumed that it is properly de-signed, implemented, and 100 % effective for site conditions.
Figure 11. Distribution of campsite elements at every level of flood-ing risk: (a) current scenario at S’Abanell; (b) climate change sce-nario 1 (SLR) at S’Abanell; (c) current scesce-nario at Malgrat; (d) cli-mate change scenario 1 (SLR) at Malgrat. Each bar in a panel rep-resents a risk reduction configuration (“none”: no measure imple-mented; “N + D”: nourishment and dune; “FRM”: flood resilience measures; “20SB, 50SB, and 75SB”: 20, 50, and 75 m setbacks, re-spectively).
Figure 12. Distribution of campsite elements at every level of flood-ing risk: (a) climate change scenario 2 (incomflood-ing storms from E and S) at S’Abanell; (b) climate change scenario 3 (incoming storms from E and S + SLR) at S’Abanell; (c) climate change scenario 2 (incoming storms from E and S) at Malgrat; (c) climate change sce-nario 3 (incoming storms from E and S + SLR) at Malgrat. Each bar in a panel represents a risk reduction configuration (“none”: no measure implemented; “N + D”: nourishment and dune; “FRM”: flood resilience measures; “20SB, 50SB, and 75SB”: 20, 50, and 75 m setbacks, respectively).
Finally, three receptor setbacks were tested: 20, 50, and 75 m. The results indicate that only the 75 m setback demon-strated a risk reduction magnitude comparable to nour-ishment + dune; however, the efficiency of the nourish-ment + dune was in general higher than the managed retreat. Only in S’Abanell, with higher topography and where the measure only consists of a dune without nourishment, was a greater risk reduction achieved through the 75 m setback.
Figure 13. Distribution of Infrastructures at every level erosion risk: (a) current scenario at S’Abanell; (b) climate change scenario 1 (SLR) at S’Abanell; (c) current scenario at Malgrat; (d) climate change scenario 1 (SLR) at Malgrat. Each bar in a panel repre-sents a risk reduction configuration (’“none”’: no measure imple-mented; “N + D”: nourishment and dune; “FRM”: flood resilience measures; “20SB, 50SB, and 75SB”: 20, 50, and 75 m setbacks, re-spectively).
Results for the erosion impact risk assessment showed similar results for the three analysed receptor categories and no significant differences between CUS and CC2 or between CC1 and CC3. For simplicity, results related to Infrastructure (Fig. 13), for the CUS and CC1 scenarios are provided in the following.
Under the CUS, the promenade at the north of the river mouth is at significant risk (70 % at medium risk and 13 % at high risk), whereas the road in Malgrat is potentially safe. In the CCS1 scenario, the assessment highlights that because of the increase of sea level and corresponding morphologi-cal accommodation, the percentage of promenade under high risk and therefore direct erosion at the toe increases up to 33 %, with some impact appearing on the road in Malgrat.
The assessment of the efficiency of the measures regard-ing erosion indicates that the nourishment + dune does not have a significant impact on reducing risk. In addition, the beach nourishment is regularly washed out in severe storm conditions. The only case where the nourishment plays some protective role is at the road in Malgrat, where the measure prevents the impact in CCS1. In contrast, receptor setback is 100 % effective in dealing with the impact of erosion, and a 20 m retreat (measured from beach limit in current condi-tions) is enough to cope with risk under the present situation and for all future projected conditions at both sides of the river mouth.
4.2 Lido degli Estensi–Spina
The overall results for flooding and erosion risks on conces-sions are shown in Figs. 14 and 15. Focusing on the flooding risk (Fig. 14), the CUS evidenced noticeable impacts, with Lido di Spina presenting the larger number of receptors at
Figure 14. Distribution of concessions for every level of flooding risk. (a) Current scenario at Lido degli Estensi; (b) climate change scenario at Lido degli Estensi; (c) current scenario at Lido di Spina; (d) climate change scenario at Lido di Spina. Each bar in a panel represents a risk reduction configuration (“none”: no measure im-plemented; “WD”: winter dune; “FRM”: flood resilience measures).
risk and with higher intensity. The presence of a CCS exac-erbates expected impacts.
The winter dune system had a positive impact in all cases, with the number of concessions at risk decreasing to 10 % (only low risk) at Lido degli Estensi and 13 % at low and 3 % at medium risk at Lido di Spina. This measure was also effective to reduce the risk under the CCS.
The flood resilience measures had positive effects on im-pacts by moving all receptors at medium risk to the low risk category. However, by definition, it had no effect on lowering the fraction of receptors presenting, in the current situation, low and high levels of risk.
With respect to erosion-induced impacts, obtained results indicate a lower level of risk than the identified for flooding, with only the 8 and 14 % of concessions being at risk at Lido degli Estensi and Lido di Spina, respectively (Fig. 15). These percentages increase up to 11 and 30 %, respectively, when the CCS is considered.
The effectiveness of the winter dune system as a risk re-duction measure is demonstrated by the observed decrease in the number of potentially damaged concessions at Lido di Spina under both climate scenarios. However, at Lido degli Estensi this measure increases the number of poten-tially damaged receptors. Simulation results show that when the dune is present with concessions close at its rear, and the storm overcomes the measure, water arrives with enough ve-locity to produce scouring at the first concessions.
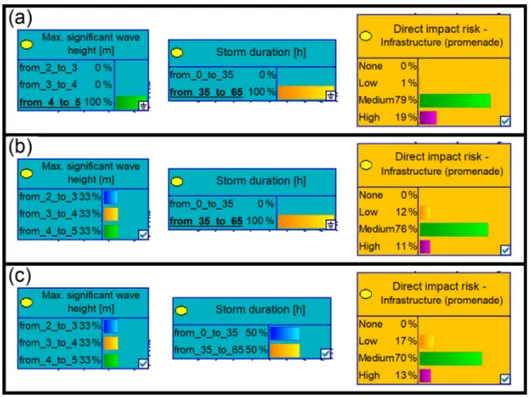
A further step in the analysis of risk scenarios was un-dertaken using the BDN in reverse mode, i.e. looking at the distribution of the boundary conditions given a certain distri-bution of flood damage to concessions at Lido degli Estensi– Spina, both with and without winter dune. Flood damage to concessions is constrained in the BDN to equal fractions of low, medium, and high risk. This can be understood as a
Figure 15. Distribution of concessions for every level of erosion risk. (a) Current scenario at Lido degli Estensi; (b) climate change scenario at Lido degli Estensi; (c) current scenario at Lido di Spina; (d) climate change scenario at Lido di Spina. Each bar in a panel represents a risk reduction configuration (“none”: no risk reduction implemented; “WD”: winter dune; “FRM”: flood resilience mea-sures).
qualitative scenario were all receptors suffer some damage, and the intensity of the damage is uniformly distributed. The BDN outputs the fractions of boundary conditions which are likely to produce the constrained impacts, according to the introduced data.
Notably, under current scenario and without measure, the Hs is distributed more uniformly compared to the TWL (Fig. 16), which demonstrates a strong increasing tendency. This indicates that compared to wave conditions, the water level is the main driver for flood impacts.
The results for the winter dune scenario showed that the largest fraction of conditions leading to flood dam-ages to concessions are TWL > 1.45 m (93 %) and Hs > 4 m (4 < Hs < 5 m: 47 %; 5 < Hs < 6 m: 43 %). These results in-dicated that the winter dune is effective to minimise the consequences of coastal storms with TWL < 1.45 m and Hs < 4 m in the current situation.
When the analysis was performed under the CCS (Fig. 17) the situation without measure demonstrated an even lower influence of Hs on flood consequences to concessions, since a more uniform distribution of this variable is obtained. As expected, the relative SLR (+0.3 m; RCP8.5 by 2050) in-creased the risk of lower-intensity storms. Thus, in general, under the CCS, all storm combinations generated flood con-sequences to concessions.
The results for the winter dune in the CCS showed that the influence of the dune system is less effective than in cur-rent conditions. Lower-intensity storms can now lead to flood damages to concessions (TWL < 1.45 m: 25 %; Hs < 4 m: 32 %). This explains the observed decrease in effective-ness of the measure in future conditions when compared to present conditions.
Figure 16. Distribution of boundary conditions (a TWL and b Hs) for constrained uniform flood damages in the current scenario for Lido degli Estensi–Spina. The configuration without measures (green bars) and for the implementation of the winter dune (red bars) were compared.
Figure 17. Distribution of boundary conditions (a TWL and b Hs) for constrained uniform flood damages in the climate change sce-nario for Lido degli Estensi–Spina. The configuration without mea-sures (green bars) and under the implementation of the winter dune (red bars) were compared.
5 Discussion
The framework of the present study is appropriate for the pre-vention phase of the disaster management cycle. In this con-text, it has been applied to support decisions for coastal risk management by facilitating intercomparison of risk reduction strategic alternatives. This comparison was performed for a large set of simulations, covering many (current and future) conditions and multiple hazards. The presented work is part of a larger investigatory process (see Martinez et al., 2018) where stakeholders and end users were interviewed to select possible measures for critical coastal areas (i.e. local scale). The objective of the present work was to provide rather sim-ple information on the efficiency of measures to be used in a participatory process (see Barquet and Cumiskey, 2018) aim-ing at selectaim-ing acceptable measures to be applied as part of an integrated local strategy for risk reduction. The analysis has some inherent uncertainties associated with the
imple-mentation of the steps of the SPRC model, which are identi-fied and discussed in what follows.
With respect to the definition of sources, the BN approach has been built by chosen storm variables limited to those pre-viously identified as the most important to control the magni-tude of storm-induced hazards at each site. Once identified, they were discretised in equal intervals covering the whole range of values observed so far. A limited number of com-binations has been used to cover the most important storm classes in terms of induced hazards and damages (Armaroli et al., 2009, 2012; Mendoza et al., 2011). Increasing num-ber of variables and/or variable resolution will allow us to better reproduce the inherent climate variability and to char-acterise better this source of uncertainty in the assessment. In spite of this, used values can be considered as representa-tive for forcing source in both areas and, in this sense, they will allow us to use the framework to assess the efficiency of tested measures to reduce inundation and erosion risks for each given condition. No prior knowledge of storm charac-teristic variables was assumed, representing them with uni-form distributions. Thus, the current application, the BDN, was essentially deterministic. This was enough to commu-nicate scenarios and measure efficiencies to stakeholders by integrating the BDN in a multi-criteria analysis such as that presented in Barquet and Cumiskey (2018). In such multi-criteria assessments, the BDN output is combined with infor-mation on additional elements required for decision-making such as economics, endurance, ecological, stakeholders’ per-ception, allowing for the final evaluation of alternatives. As it has been mentioned before, the next step should be to repro-duce the local maritime climate to analyse this performance, taking into account the relative frequency of each condition. In such a case, the BN approach would be fully probabilistic. In addition, using time series data on real historical events would reduce the uncertainties introduced by representing some events with synthetic design shapes.
Uncertainties associated with the pathway are related to the selection of the process-oriented models used to simulate induced hazards. In the current analysis, we have not consid-ered this source of uncertainty since the framework is applied by using previously selected models and recommended dam-age curves. As it was mentioned in the method section, the selected model to simulate storm-induced hazards is XBeach (Roelvink et al., 2009), which is currently one of the most applied at the international level. Applied model setting has been selected for each case study based on local calibrations and validations for selected storm impacts. This step must be done prior to BN development since it will control the ac-curacy of hazard estimation and it is also a source of uncer-tainty. In any case, the methodology can easily deal with this source of uncertainty if simulations from multiple models or model settings are used to feed the BN.
Another point to be considered is that this assessment framework has been designed to analyse the storm-induced coastal response. This implies that used models do not